
Carbon Trusts Offshore Wind Accelerator Driving down the
Carbon Trust’s Offshore Wind Accelerator Driving down the cost of offshore wind Phil de Villiers Offshore Wind Accelerator Manager
Our mission is to accelerate the move to a low carbon economy We cut carbon now by Providing specialist advice and finance to help organisations cut carbon Setting standards for carbon reduction We cut future carbon emissions by Opening markets for low carbon technologies Leading industry collaborations to commercialise technologies Investing in early stage low carbon companies 2
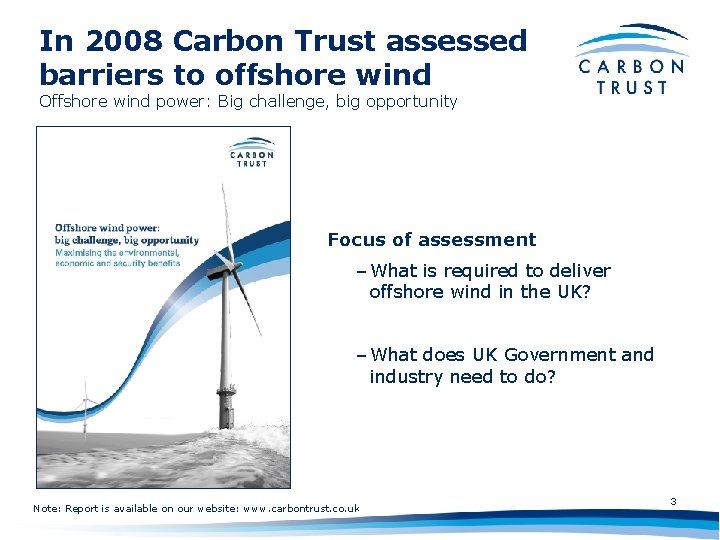
In 2008 Carbon Trust assessed barriers to offshore wind Offshore wind power: Big challenge, big opportunity Focus of assessment – What is required to deliver offshore wind in the UK? – What does UK Government and industry need to do? Note: Report is available on our website: www. carbontrust. co. uk 3
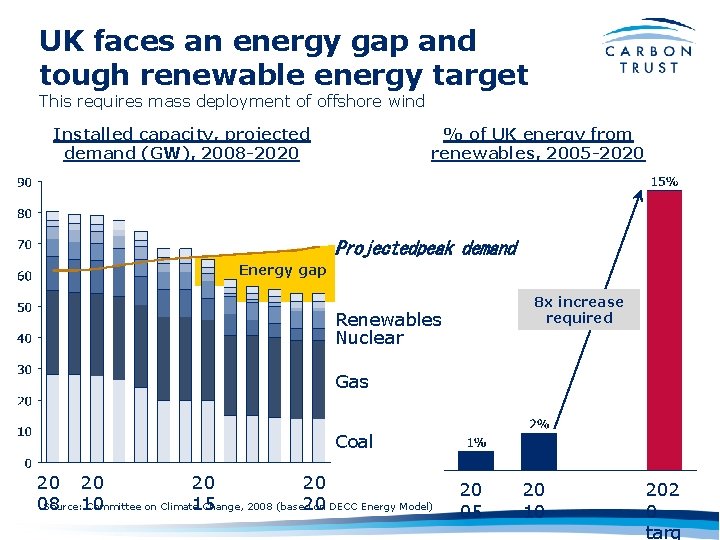
UK faces an energy gap and tough renewable energy target This requires mass deployment of offshore wind Installed capacity, projected … demand (GW), 2008 -2020 % of UK energy from renewables, 2005 -2020 Projectedpeak demand Energy gap 8 x increase required Renewables Nuclear Gas Coal 20 20 Source: 10 Committee on Climate Change, 2008 (based on DECC Energy Model) 08 15 20 20 05 20 10 202 0 targ
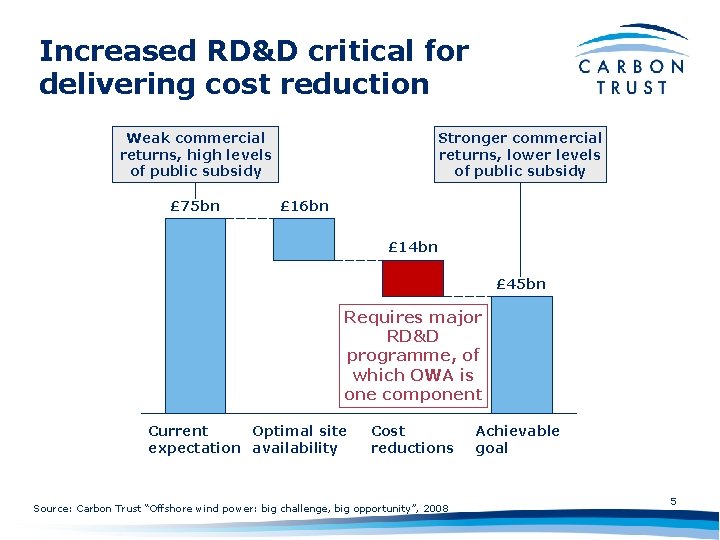
Increased RD&D critical for delivering cost reduction Weak commercial returns, high levels of public subsidy £ 75 bn Stronger commercial returns, lower levels of public subsidy £ 16 bn £ 14 bn £ 45 bn Requires major RD&D programme, of which OWA is one component Current Optimal site expectation availability Cost reductions Source: Carbon Trust “Offshore wind power: big challenge, big opportunity”, 2008 Achievable goal 5
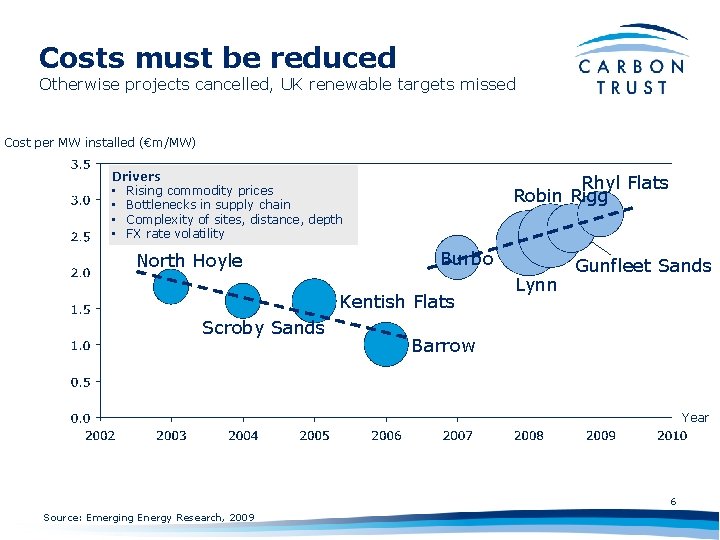
Costs must be reduced Otherwise projects cancelled, UK renewable targets missed Cost per MW installed (€m/MW) Drivers • Rising commodity prices • Bottlenecks in supply chain • Complexity of sites, distance, depth • FX rate volatility North Hoyle Rhyl Flats Robin Rigg Burbo Kentish Flats Scroby Sands Lynn Gunfleet Sands Barrow Year 6 Source: Emerging Energy Research, 2009
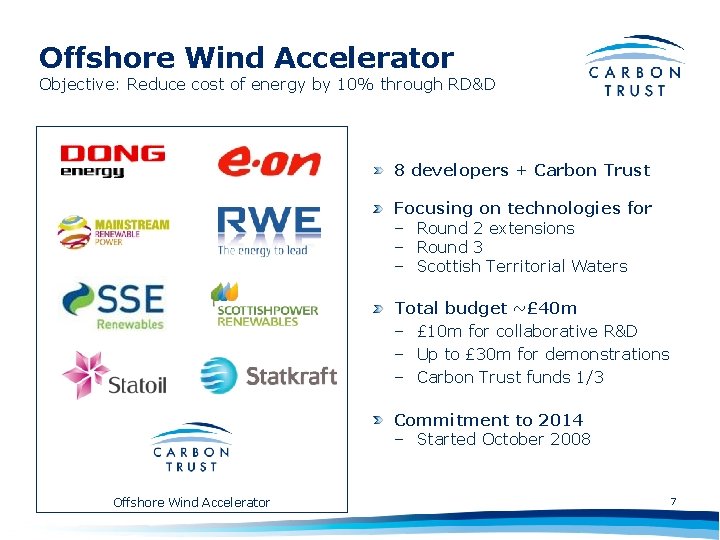
Offshore Wind Accelerator Objective: Reduce cost of energy by 10% through RD&D 8 developers + Carbon Trust Focusing on technologies for – Round 2 extensions – Round 3 – Scottish Territorial Waters Total budget ~£ 40 m – £ 10 m for collaborative R&D – Up to £ 30 m for demonstrations – Carbon Trust funds 1/3 Commitment to 2014 – Started October 2008 Offshore Wind Accelerator 7
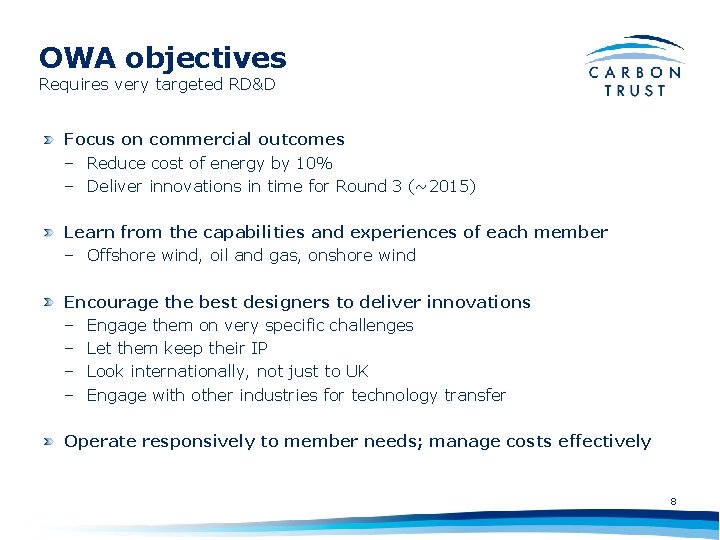
OWA objectives Requires very targeted RD&D Focus on commercial outcomes – Reduce cost of energy by 10% – Deliver innovations in time for Round 3 (~2015) Learn from the capabilities and experiences of each member – Offshore wind, oil and gas, onshore wind Encourage the best designers to deliver innovations – Engage them on very specific challenges – Let them keep their IP – Look internationally, not just to UK – Engage with other industries for technology transfer Operate responsively to member needs; manage costs effectively 8
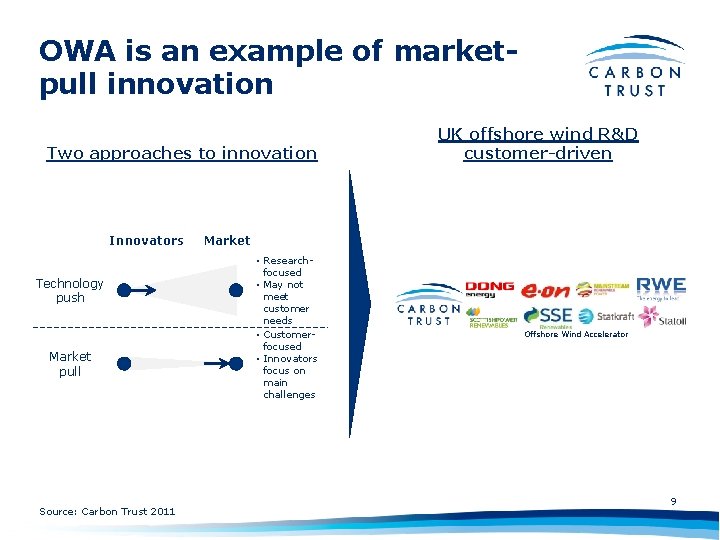
OWA is an example of marketpull innovation Two approaches to innovation Innovators Technology push Market pull Source: Carbon Trust 2011 UK offshore wind R&D customer-driven Market • Researchfocused • May not meet customer needs • Customerfocused • Innovators focus on main challenges Offshore Wind Accelerator 9
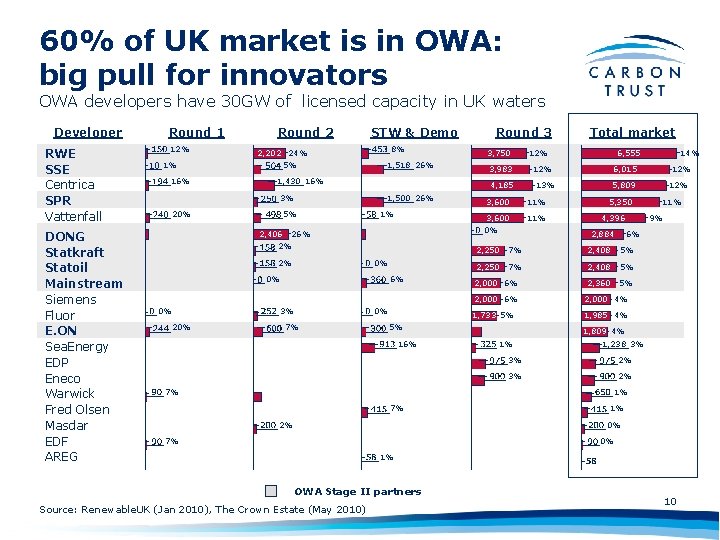
60% of UK market is in OWA: big pull for innovators OWA developers have 30 GW of licensed capacity in UK waters Developer RWE SSE Centrica SPR Vattenfall DONG Statkraft Statoil Mainstream Siemens Fluor E. ON Sea. Energy EDP Eneco Warwick Fred Olsen Masdar EDF AREG Round 1 12% Round 2 8% 2, 202 24% 1% 16% STW & Demo 5% 1, 518 26% 1, 430 16% 3% 20% 2, 406 1% 26% 0% 0% 0% 6% 3% 20% 0% 7% 3, 983 7% 6, 555 12% 3, 600 11% 12% 5, 809 5, 350 4, 396 2, 884 12% 11% 9% 6% 2, 250 7% 2, 408 5% 2, 360 5% 2, 000 6% 14% 6, 015 13% 11% 2, 000 6% 2, 000 4% 1, 733 5% 1, 985 4% 5% 16% Total market 12% 3, 600 0% 2% 2% 3, 750 4, 185 1, 500 26% 5% Round 3 1, 809 4% 1% 1, 238 3% 3% 2% 1% 7% 2% 1% 0% 7% 0% 1% OWA Stage II partners Source: Renewable. UK (Jan 2010), The Crown Estate (May 2010) 10
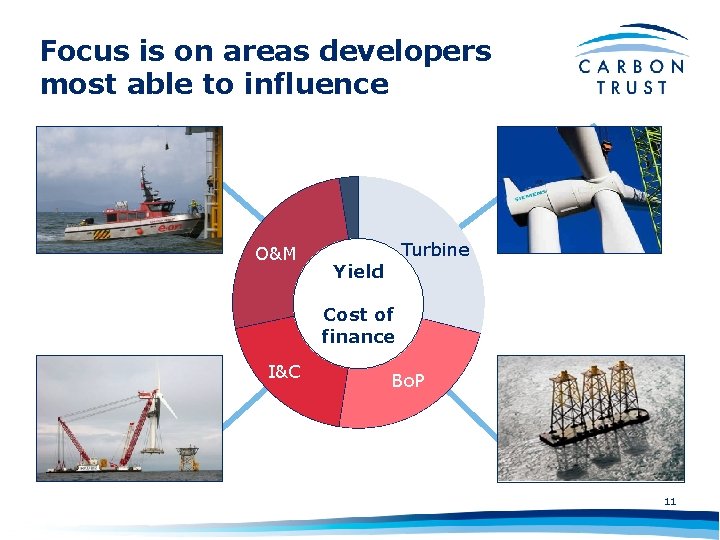
Focus is on areas developers most able to influence O&M Turbine Yield Cost of finance I&C Bo. P 11
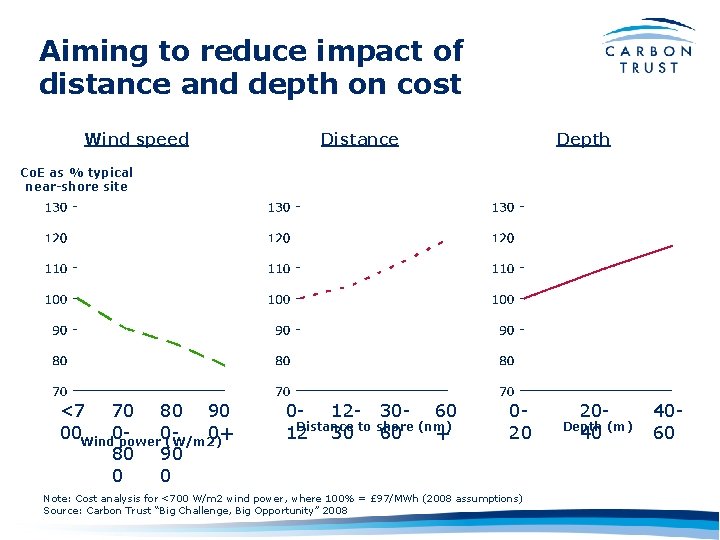
Aiming to reduce impact of distance and depth on cost Wind speed Distance Depth Co. E as % typical near-shore site <7 70 80 90 00 Wind 000+ power (W/m 2) 80 90 0 0 0 - 12 - 30 - 60 Distance to shore (nm) 12 30 60 + 020 Note: Cost analysis for <700 W/m 2 wind power, where 100% = £ 97/MWh (2008 assumptions) Source: Carbon Trust “Big Challenge, Big Opportunity” 2008 2040 Depth (m) 4060
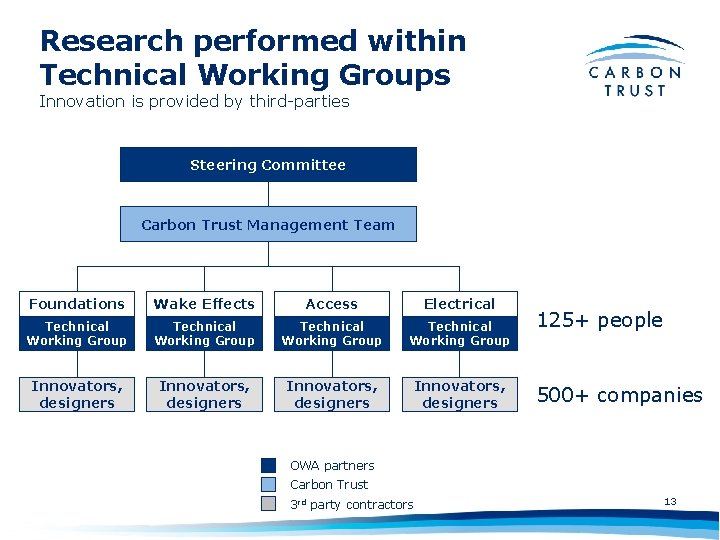
Research performed within Technical Working Groups Innovation is provided by third-parties Steering Committee Carbon Trust Management Team Foundations Wake Effects Access Electrical Technical Working Group Innovators, designers 125+ people 500+ companies OWA partners Carbon Trust 3 rd party contractors 13
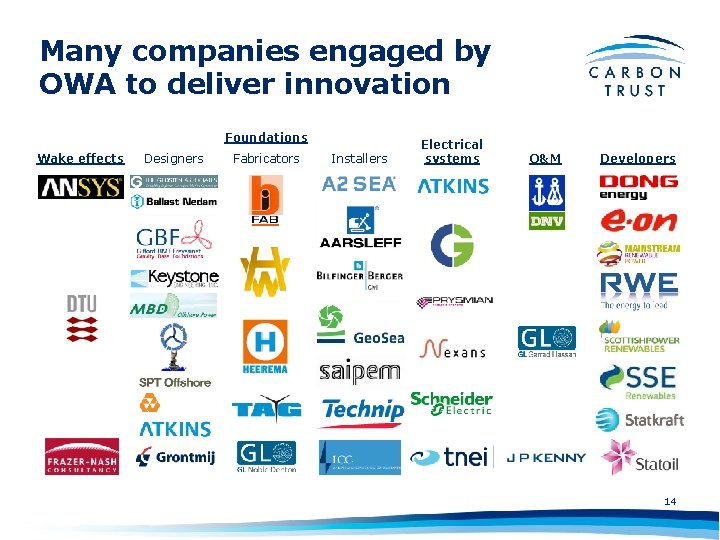
Many companies engaged by OWA to deliver innovation Foundations Wake effects Designers Fabricators Installers Electrical systems O&M Developers 14
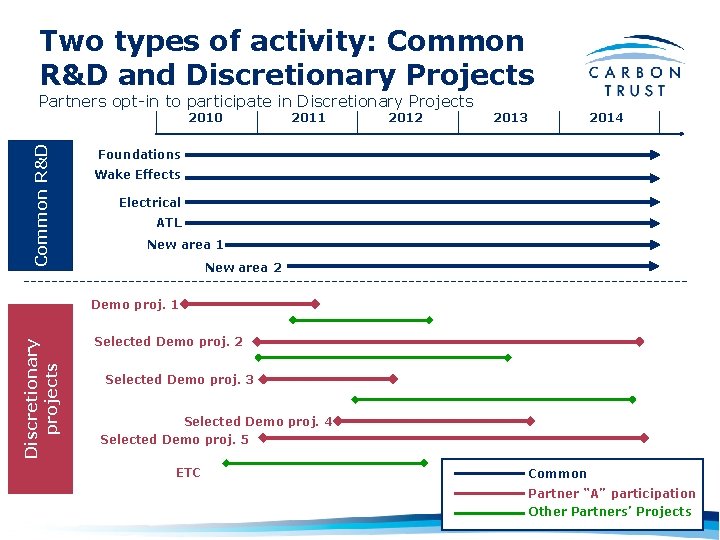
Two types of activity: Common R&D and Discretionary Projects Partners opt-in to participate in Discretionary Projects Common R&D 2010 2011 2012 2013 2014 Foundations Wake Effects Electrical ATL New area 1 New area 2 Discretionary projects Demo proj. 1 Selected Demo proj. 2 Selected Demo proj. 3 Selected Demo proj. 4 Selected Demo proj. 5 ETC Common Partner “A” participation 15 Other Partners’ Projects
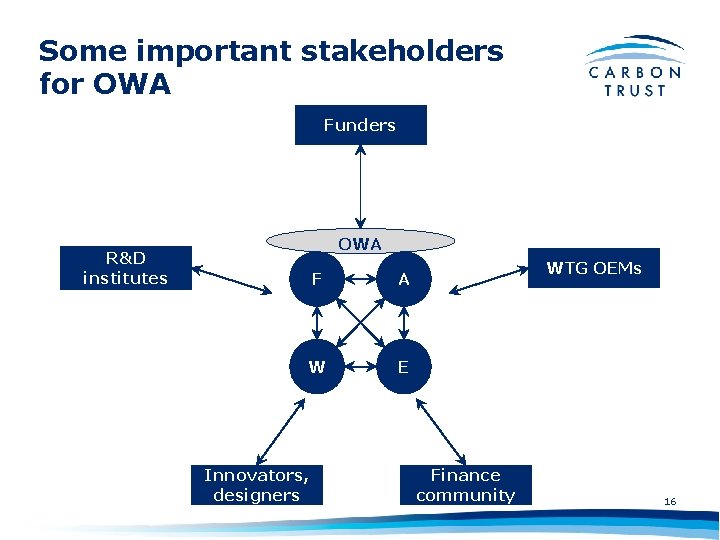
Some important stakeholders for OWA Funders OWA R&D institutes F A W E Innovators, designers WTG OEMs Finance community 16
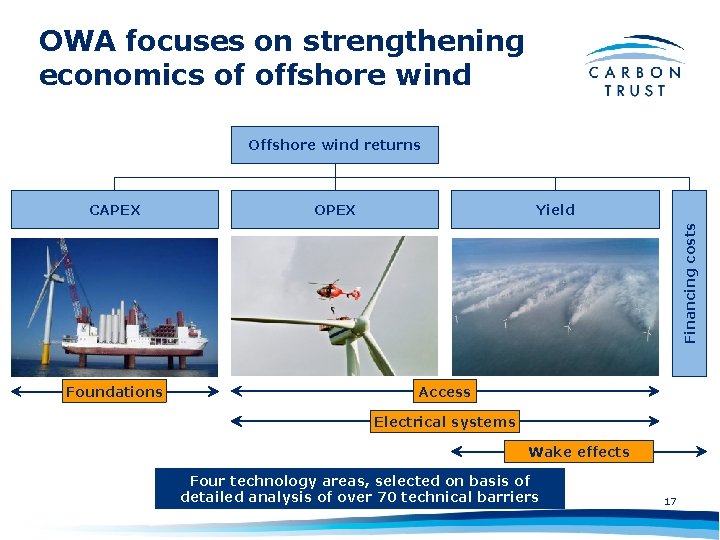
OWA focuses on strengthening economics of offshore wind Offshore wind returns OPEX Yield Financing costs CAPEX Foundations Access Electrical systems Wake effects Four technology areas, selected on basis of detailed analysis of over 70 technical barriers 17
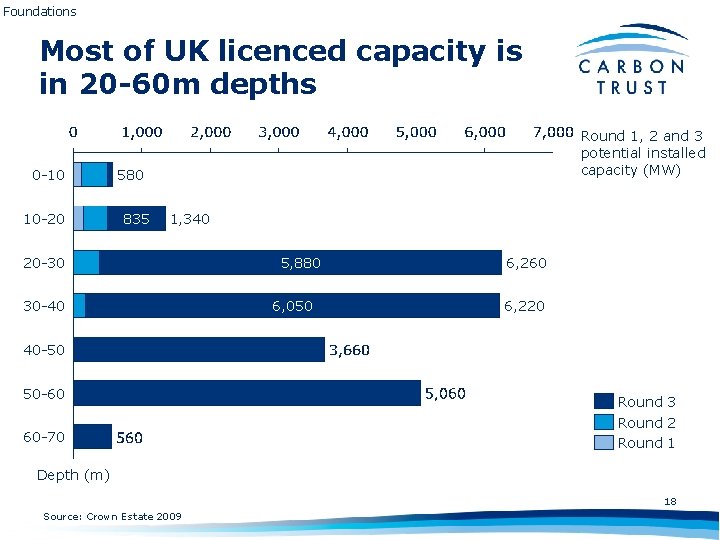
Foundations Most of UK licenced capacity is in 20 -60 m depths 0 -10 10 -20 Round 1, 2 and 3 potential installed capacity (MW) 580 835 1, 340 20 -30 30 -40 5, 880 6, 050 6, 260 6, 220 40 -50 50 -60 60 -70 Round 3 Round 2 Round 1 Depth (m) 18 Source: Crown Estate 2009
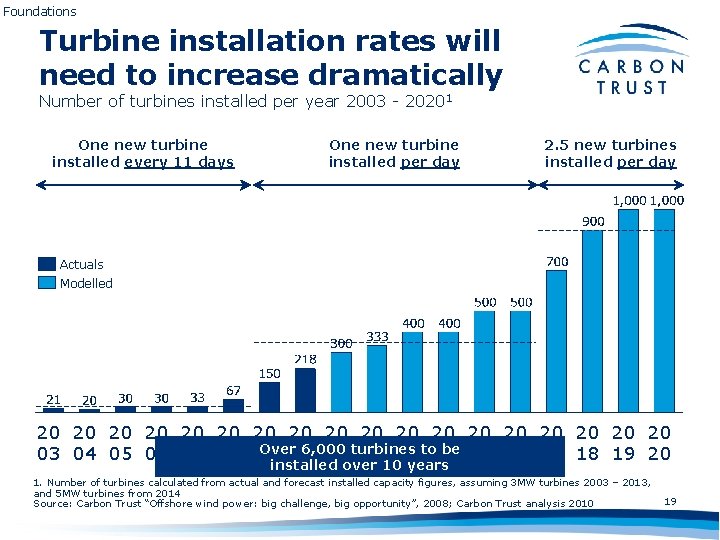
Foundations Turbine installation rates will need to increase dramatically Number of turbines installed per year 2003 - 20201 One new turbine installed every 11 days One new turbine installed per day 2. 5 new turbines installed per day Actuals Modelled 20 20 20 20 20 Over 6, 000 be 15 16 17 18 19 20 03 04 05 06 07 08 09 10 11 turbines 12 13 to 14 installed over 10 years 1. Number of turbines calculated from actual and forecast installed capacity figures, assuming 3 MW turbines 2003 – 2013, and 5 MW turbines from 2014 Source: Carbon Trust “Offshore wind power: big challenge, big opportunity”, 2008; Carbon Trust analysis 2010 19
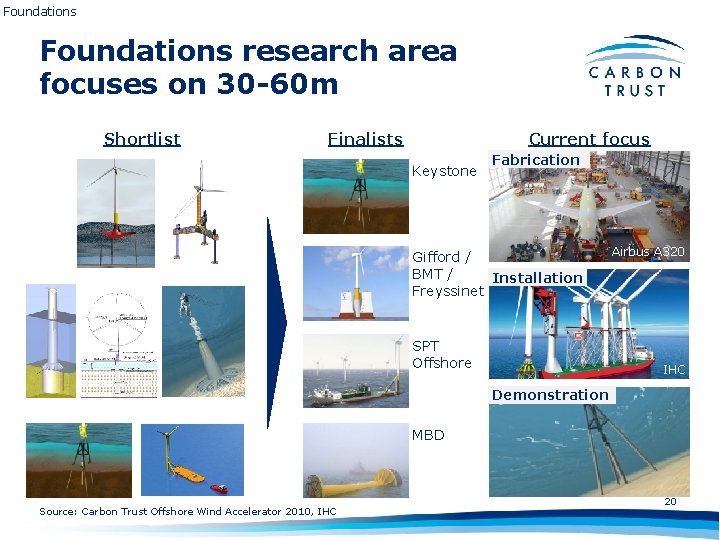
Foundations research area focuses on 30 -60 m Shortlist Finalists Current focus Keystone Fabrication Gifford / BMT / Installation Freyssinet SPT Offshore Airbus A 320 IHC Demonstration MBD Source: Carbon Trust Offshore Wind Accelerator 2010, IHC 20
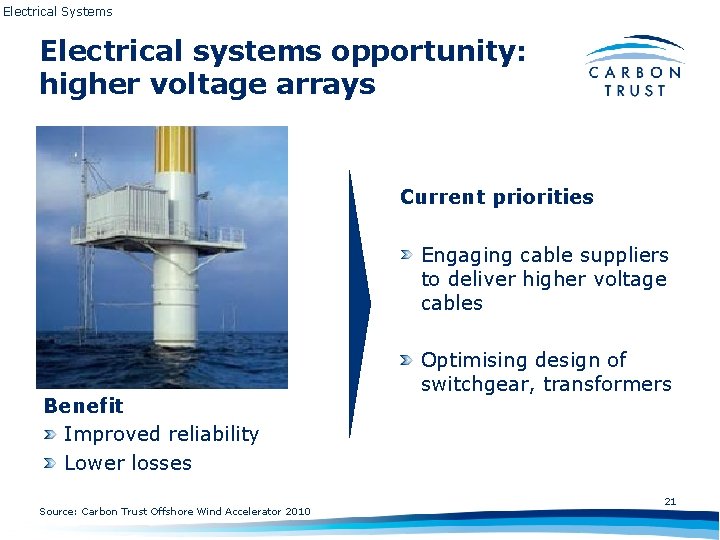
Electrical Systems Electrical systems opportunity: higher voltage arrays Current priorities Engaging cable suppliers to deliver higher voltage cables Benefit Improved reliability Lower losses Source: Carbon Trust Offshore Wind Accelerator 2010 Optimising design of switchgear, transformers 21
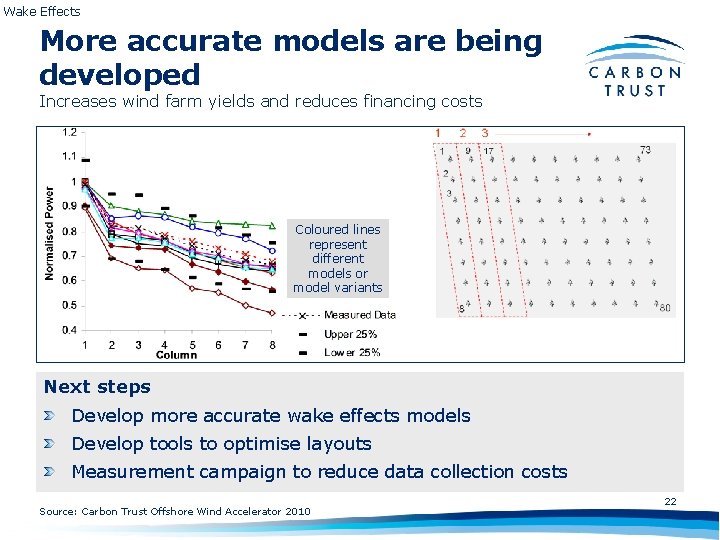
Wake Effects More accurate models are being developed Increases wind farm yields and reduces financing costs Coloured lines represent different models or model variants Next steps Develop more accurate wake effects models Develop tools to optimise layouts Measurement campaign to reduce data collection costs Source: Carbon Trust Offshore Wind Accelerator 2010 22
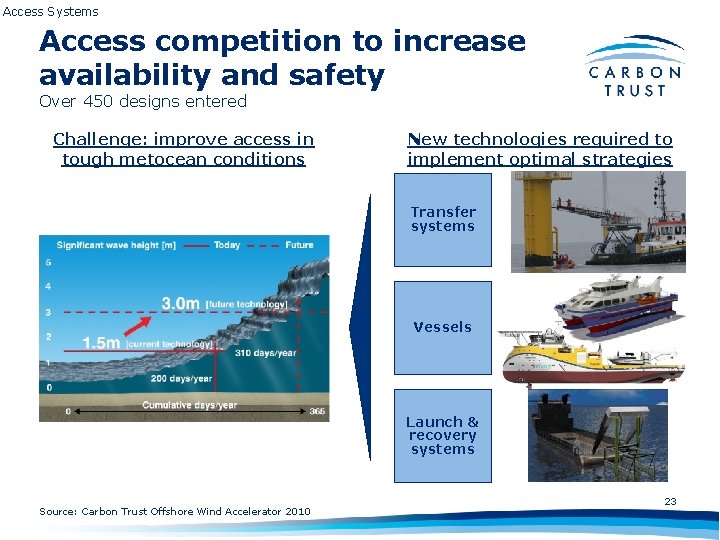
Access Systems Access competition to increase availability and safety Over 450 designs entered Challenge: improve access in tough metocean conditions New technologies required to implement optimal strategies Transfer systems Vessels Launch & recovery systems Source: Carbon Trust Offshore Wind Accelerator 2010 23
Some excellent R&D is being performed in Europe Examples Denmark – Risø Germany – RAVE, Fraunhofer Netherlands – ECN, FLOW Norway – NOWITECH Sweden – Vindforsk III UK – ETI, NAREC 24
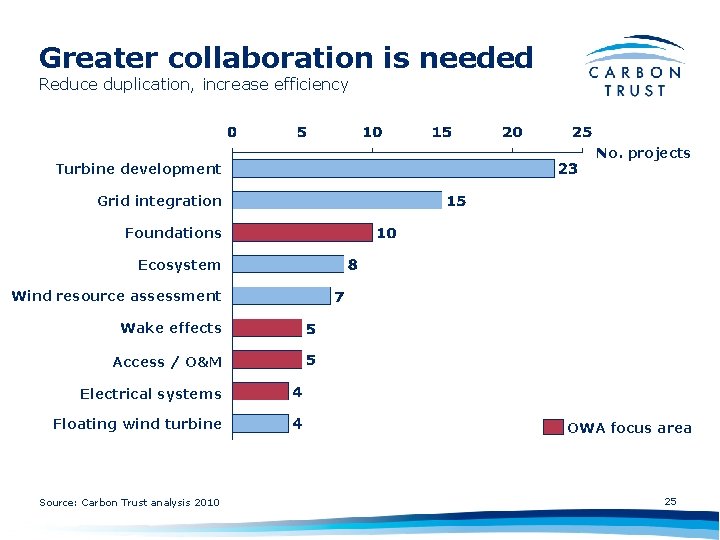
Greater collaboration is needed Reduce duplication, increase efficiency Turbine development No. projects Grid integration Foundations Ecosystem Wind resource assessment Wake effects Access / O&M Electrical systems Floating wind turbine Source: Carbon Trust analysis 2010 OWA focus area 25
Conclusions We are focusing our RD&D efforts on the needs of end users Cost reduction in site conditions applicable to EU market RD&D is essential for driving down cost of offshore wind Strengthens economic returns Reduces financing costs Reduces costs to consumers Accelerates deployment Greater collaboration would benefit everyone Avoids duplication and reinvention 26
Phil de Villiers Offshore Wind Accelerator Manager Phil. de. Villiers@Carbon. Trust. co. uk 27
- Slides: 27