
Carbon isotopic composition of waters in the South
Carbon isotopic composition of waters in the South Atlantic, tracing water masses and biological activity Alex Piotrowski and Jo Clegg University of Cambridge Thanks to Alex Thomas, Malcolm Woodward, Mike Hall, & James Rolf.
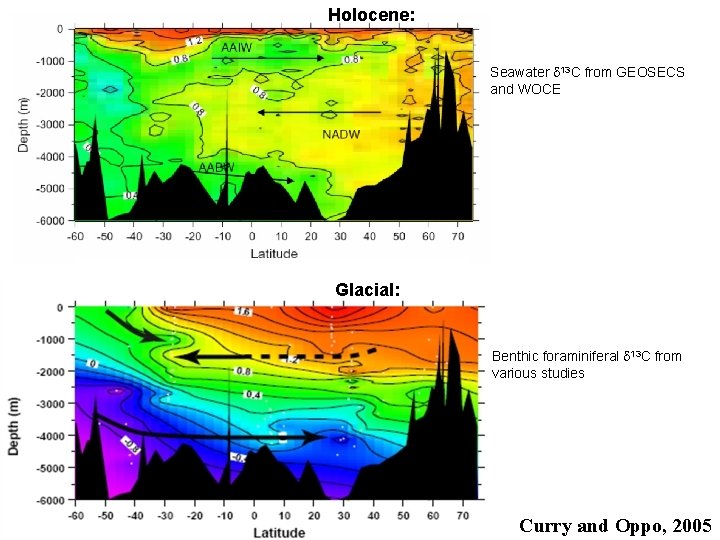
Holocene: Seawater d 13 C from GEOSECS and WOCE Glacial: Benthic foraminiferal d 13 C from various studies Curry and Oppo, 2005
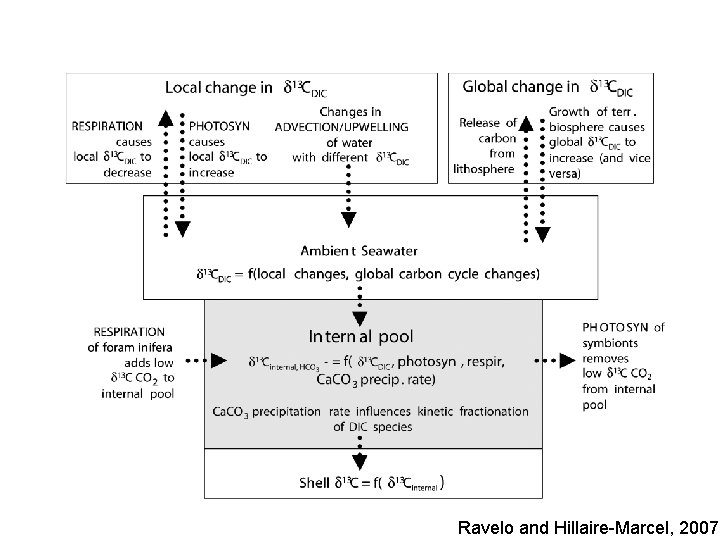
Ravelo and Hillaire-Marcel, 2007
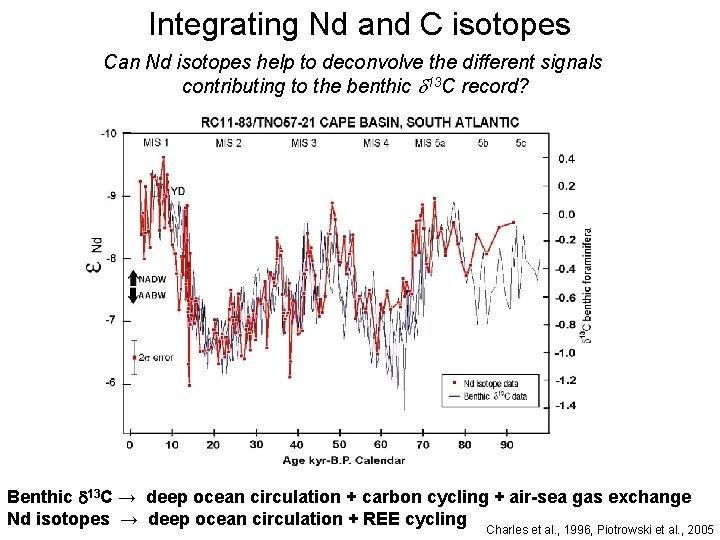
Integrating Nd and C isotopes Can Nd isotopes help to deconvolve the different signals contributing to the benthic d 13 C record? Benthic d 13 C → deep ocean circulation + carbon cycling + air-sea gas exchange Nd isotopes → deep ocean circulation + REE cycling Charles et al. , 1996, Piotrowski et al. , 2005
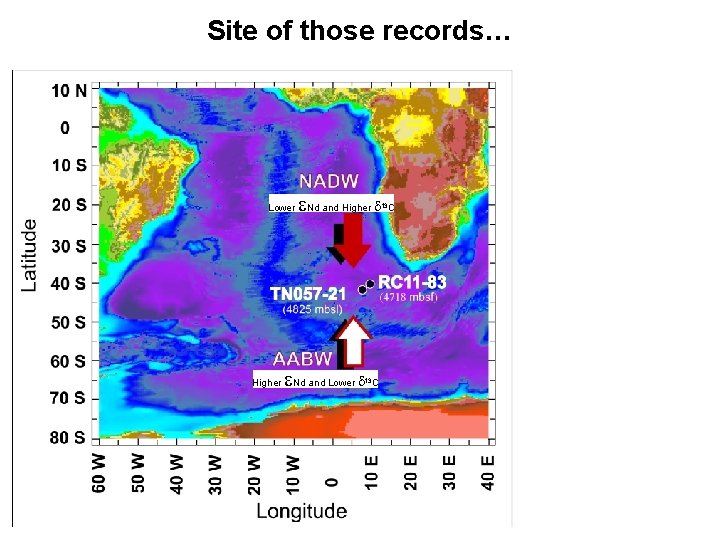
Site of those records… Lower Higher e. Nd and Higher d e. Nd and Lower d 13 C
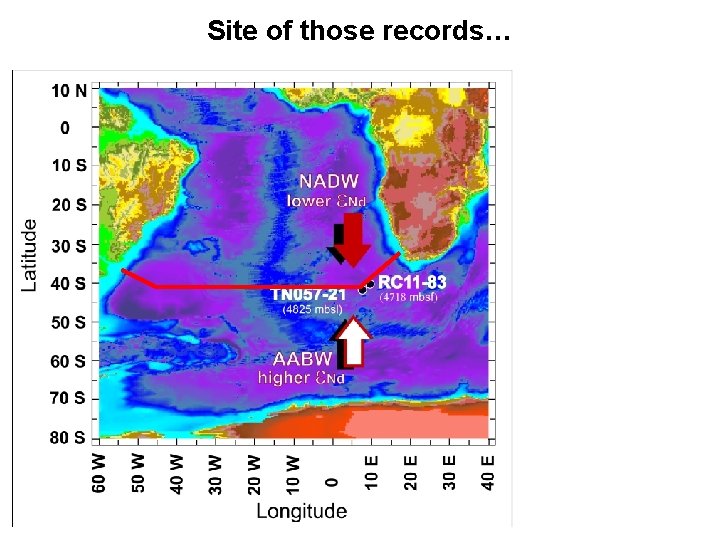
Site of those records…
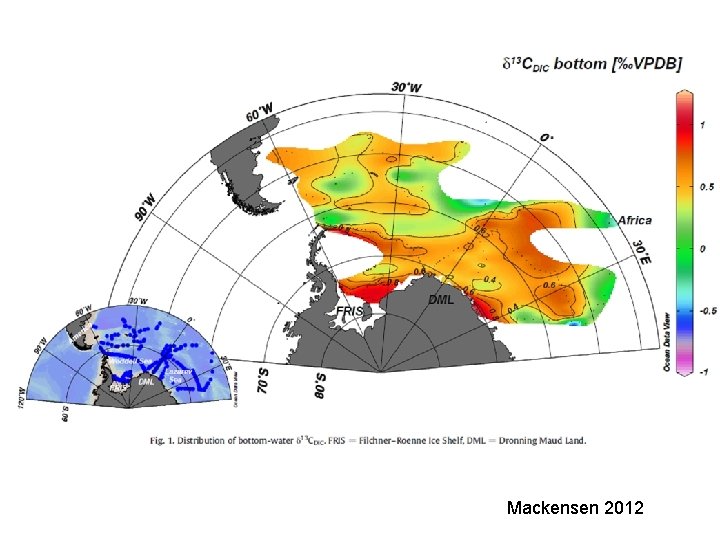
Mackensen 2012
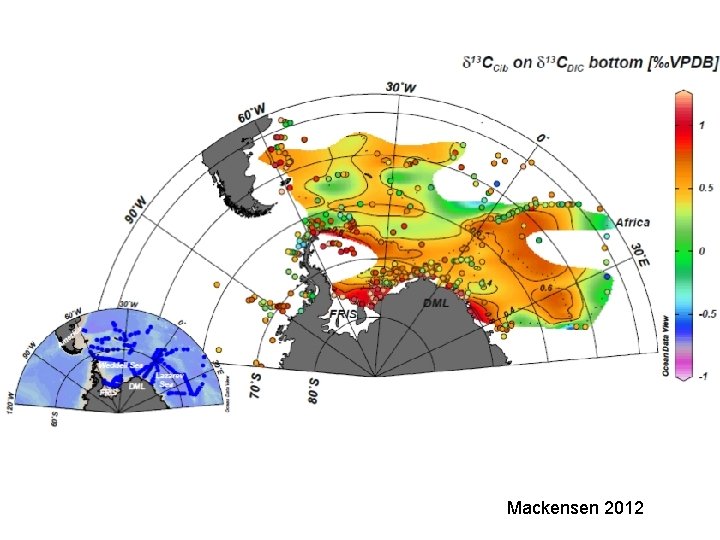
Mackensen 2012
Methods • Samples collected early to minimize gas exchange, glass containers overfilled to prevent air bubbles. • Sealed poisoned (with mercuric chloride) seawater samples stored in refrigerator • Subsamples run on Thermo MAT 253 mass spectrometer with Gas Bench
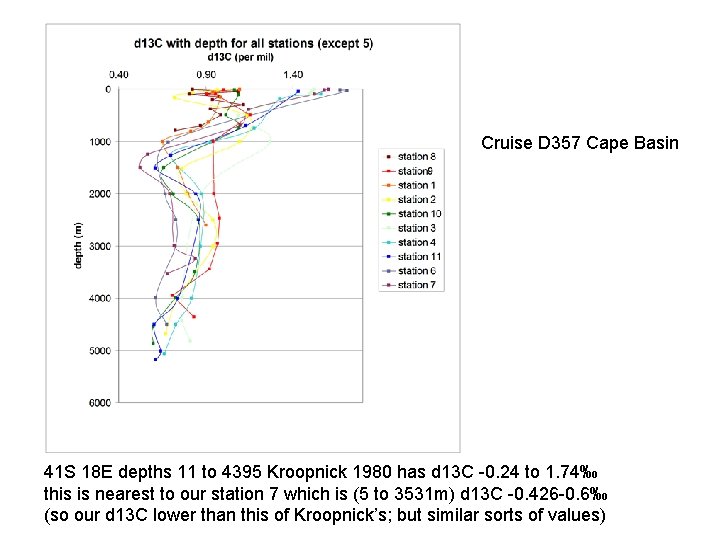
Cruise D 357 Cape Basin 41 S 18 E depths 11 to 4395 Kroopnick 1980 has d 13 C -0. 24 to 1. 74‰ this is nearest to our station 7 which is (5 to 3531 m) d 13 C -0. 426 -0. 6‰ (so our d 13 C lower than this of Kroopnick’s; but similar sorts of values)
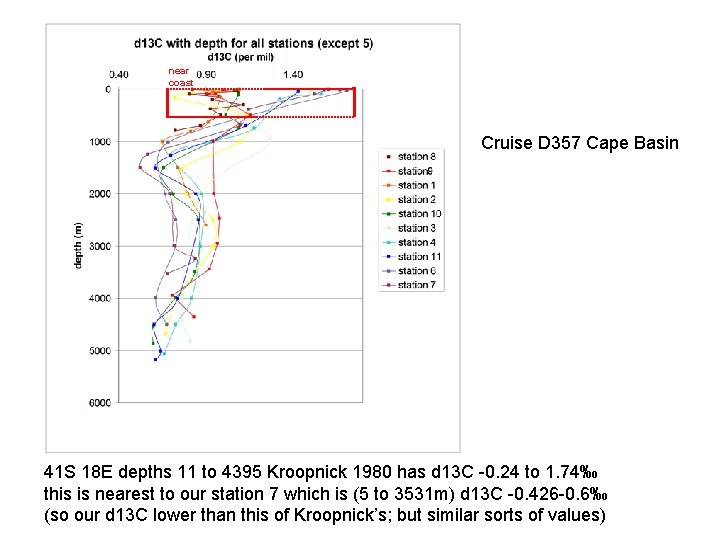
near coast Cruise D 357 Cape Basin 41 S 18 E depths 11 to 4395 Kroopnick 1980 has d 13 C -0. 24 to 1. 74‰ this is nearest to our station 7 which is (5 to 3531 m) d 13 C -0. 426 -0. 6‰ (so our d 13 C lower than this of Kroopnick’s; but similar sorts of values)
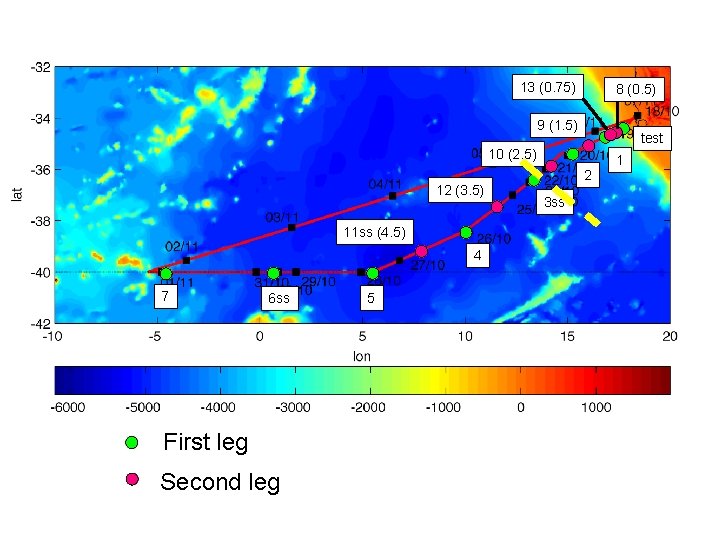
13 (0. 75) 8 (0. 5) 9 (1. 5) test 10 (2. 5) 12 (3. 5) 11 ss (4. 5) 4 7 6 ss First leg Second leg 5 2 3 ss 1
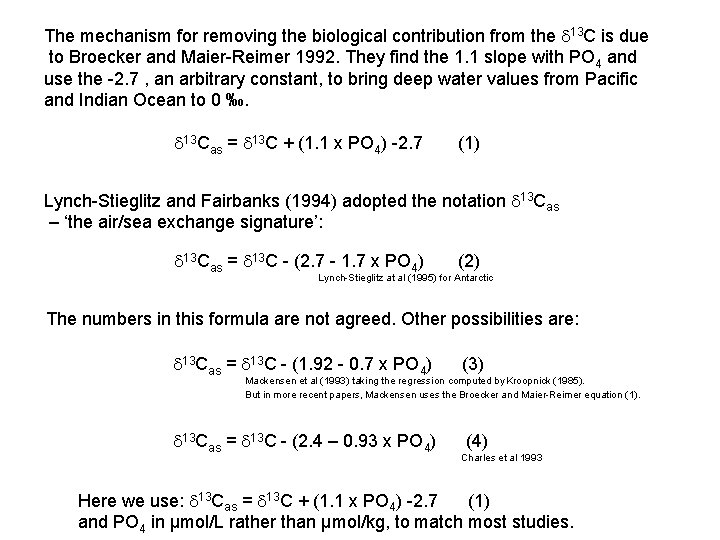
The mechanism for removing the biological contribution from the d 13 C is due to Broecker and Maier-Reimer 1992. They find the 1. 1 slope with PO 4 and use the -2. 7 , an arbitrary constant, to bring deep water values from Pacific and Indian Ocean to 0 ‰. d 13 Cas = d 13 C + (1. 1 x PO 4) -2. 7 (1) Lynch-Stieglitz and Fairbanks (1994) adopted the notation d 13 Cas – ‘the air/sea exchange signature’: d 13 Cas = d 13 C - (2. 7 - 1. 7 x PO 4) (2) Lynch-Stieglitz at al (1995) for Antarctic The numbers in this formula are not agreed. Other possibilities are: d 13 Cas = d 13 C - (1. 92 - 0. 7 x PO 4) (3) d 13 Cas = d 13 C - (2. 4 – 0. 93 x PO 4) (4) Mackensen et al (1993) taking the regression computed by Kroopnick (1985). But in more recent papers, Mackensen uses the Broecker and Maier-Reimer equation (1). Charles et al 1993 Here we use: d 13 Cas = d 13 C + (1. 1 x PO 4) -2. 7 (1) and PO 4 in μmol/L rather than μmol/kg, to match most studies.
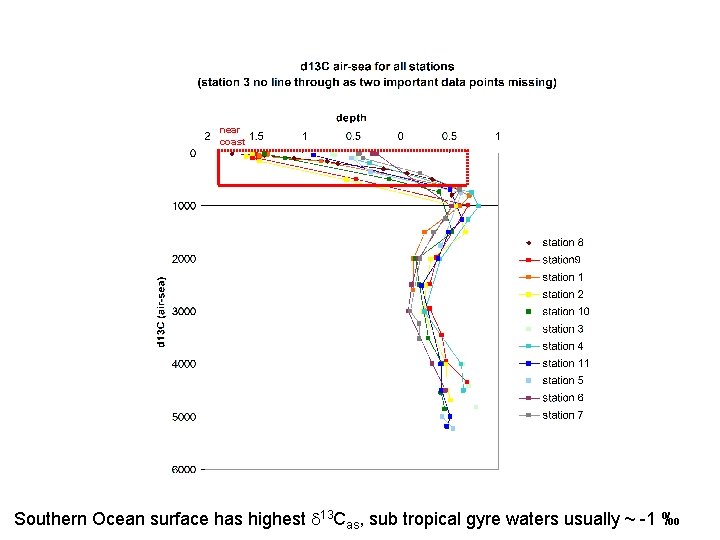
near coast Southern Ocean surface has highest d 13 Cas, sub tropical gyre waters usually ~ -1 ‰
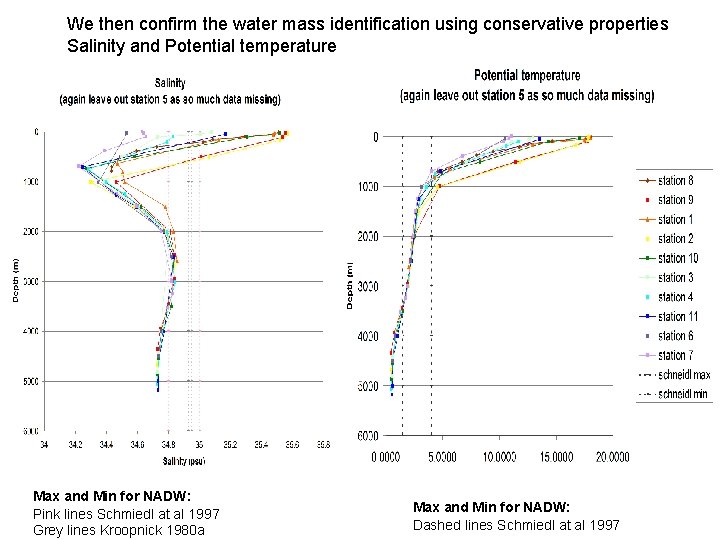
We then confirm the water mass identification using conservative properties Salinity and Potential temperature Max and Min for NADW: Pink lines Schmiedl at al 1997 Grey lines Kroopnick 1980 a Max and Min for NADW: Dashed lines Schmiedl at al 1997

AAIW NADW AABW
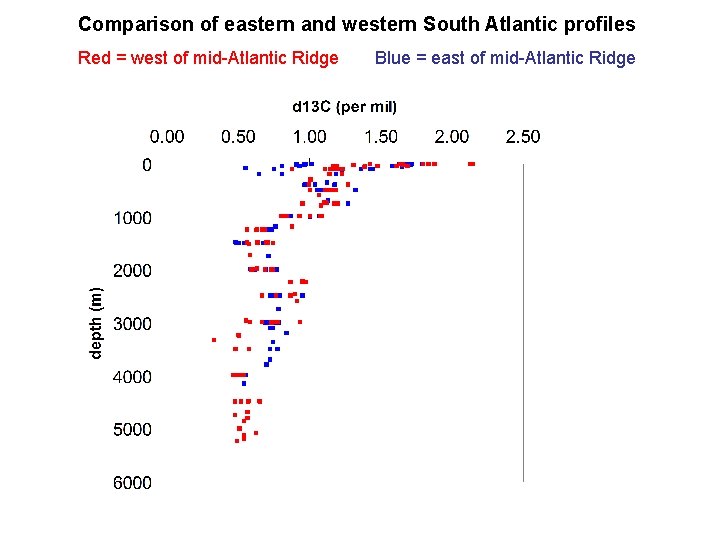
Comparison of eastern and western South Atlantic profiles Red = west of mid-Atlantic Ridge Blue = east of mid-Atlantic Ridge
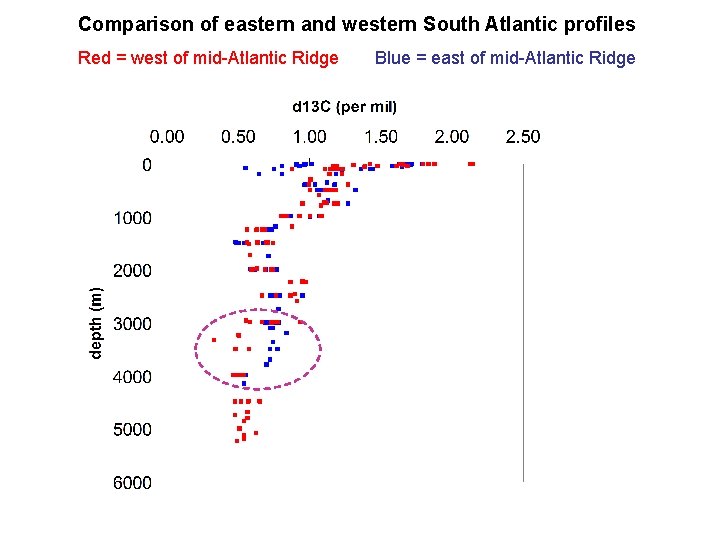
Comparison of eastern and western South Atlantic profiles Red = west of mid-Atlantic Ridge Blue = east of mid-Atlantic Ridge
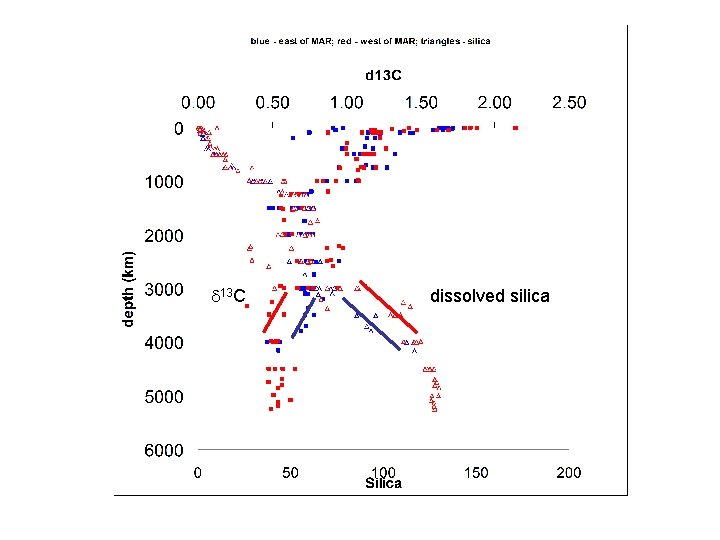
d 13 C dissolved silica
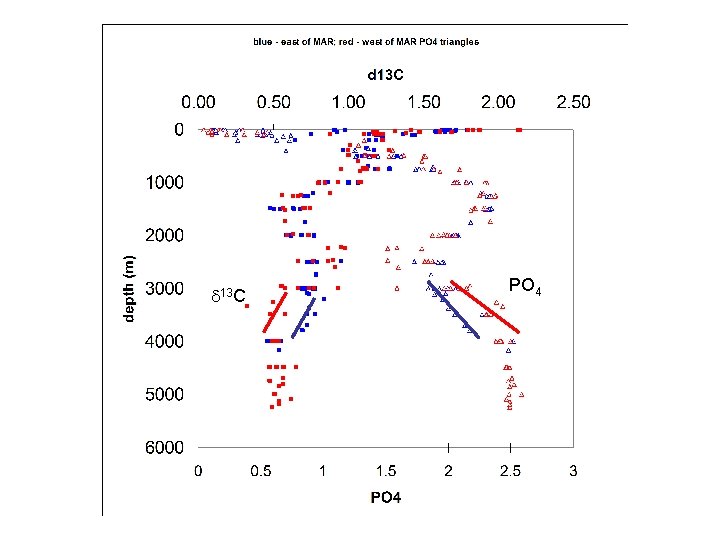
d 13 C PO 4
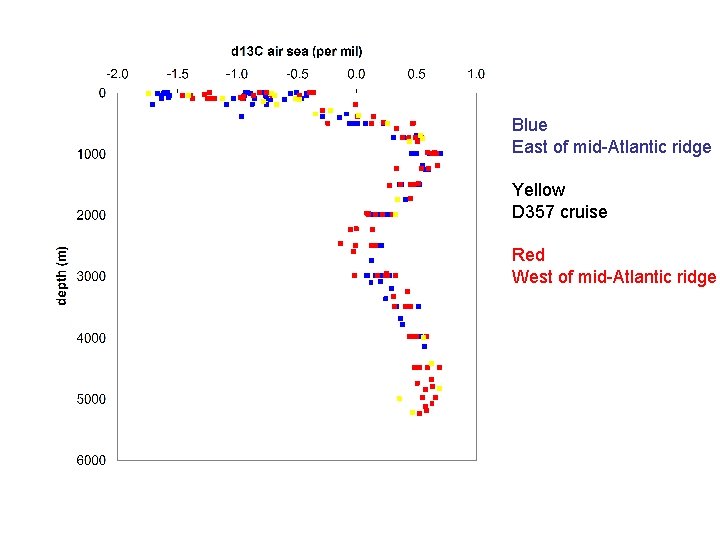
Blue East of mid-Atlantic ridge Yellow D 357 cruise Red West of mid-Atlantic ridge
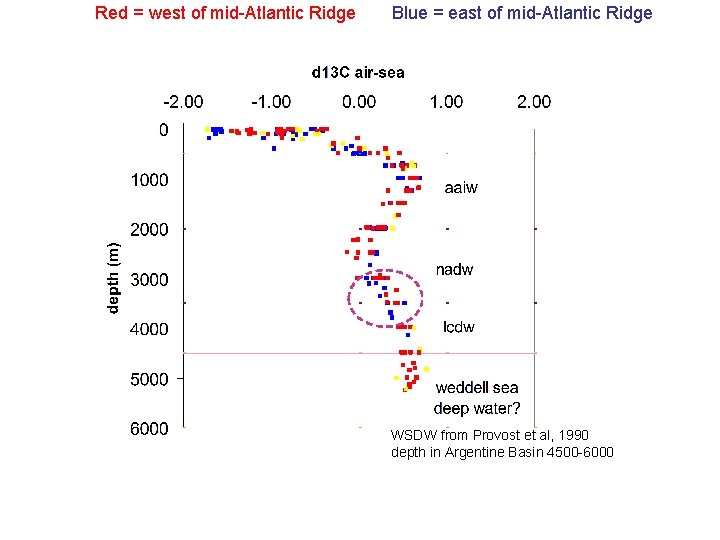
Red = west of mid-Atlantic Ridge Blue = east of mid-Atlantic Ridge WSDW from Provost et al, 1990 depth in Argentine Basin 4500 -6000
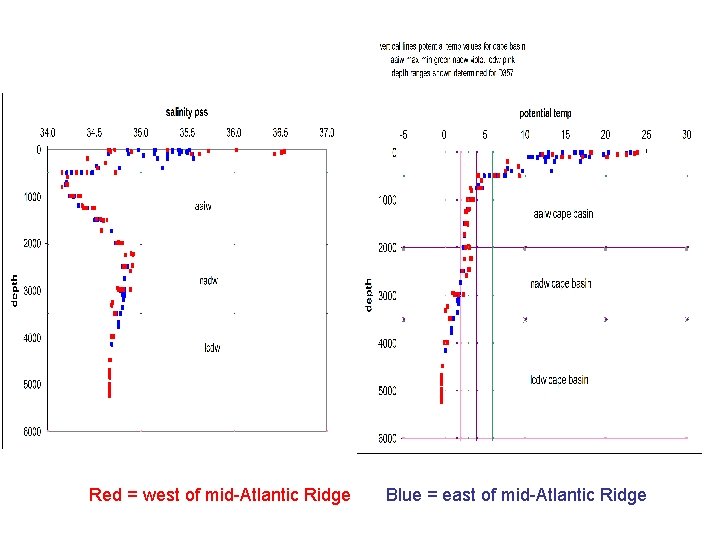
Red = west of mid-Atlantic Ridge Blue = east of mid-Atlantic Ridge
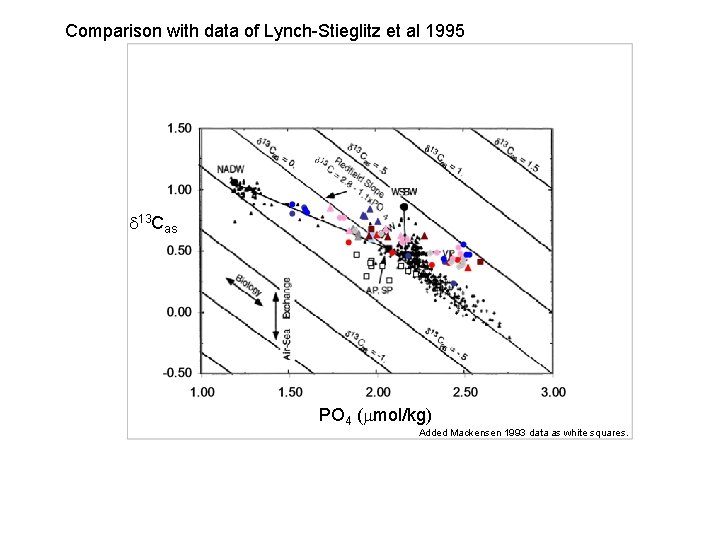
Comparison with data of Lynch-Stieglitz et al 1995 d 13 Cas PO 4 (mmol/kg) Added Mackensen 1993 data as white squares.
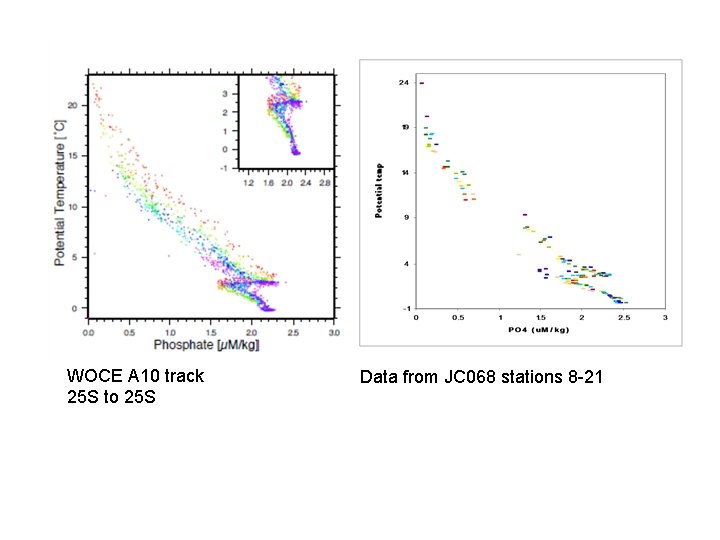
WOCE A 10 track 25 S to 25 S Data from JC 068 stations 8 -21
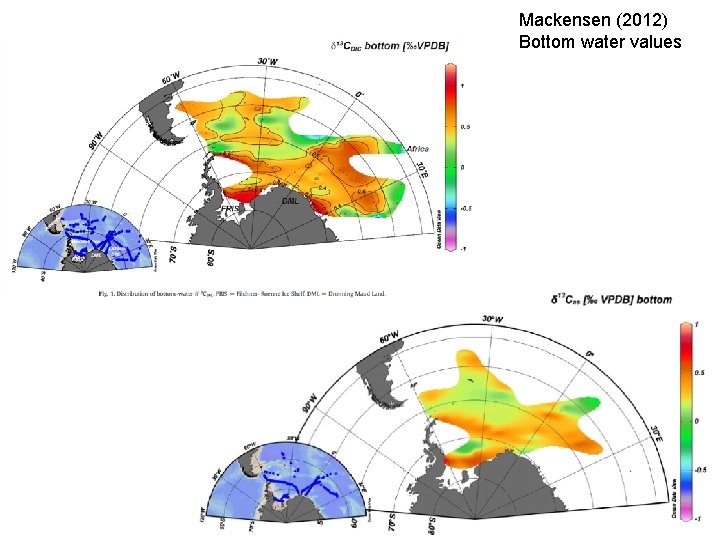
Mackensen (2012) Bottom water values
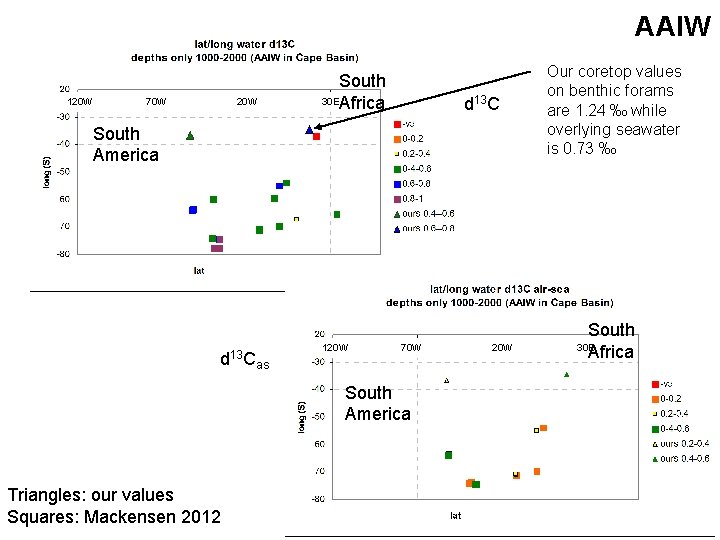
AAIW 120 W 70 W 20 W South 30 EAfrica d 13 C South America d 13 Cas 120 W 70 W South America Triangles: our values Squares: Mackensen 2012 20 W Our coretop values on benthic forams are 1. 24 ‰ while overlying seawater is 0. 73 ‰ South Africa 30 E
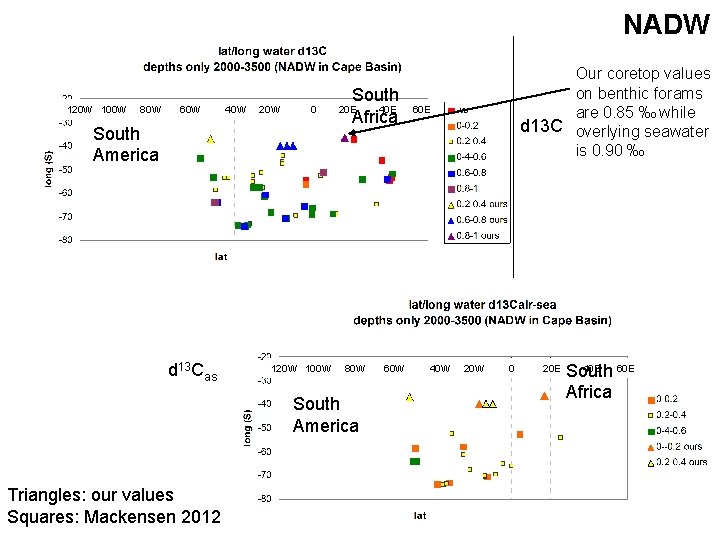
NADW 120 W 100 W 80 W 60 W 40 W 20 W 0 South America d 13 Cas 120 W 100 W South 40 E Africa 20 E 80 W South America Triangles: our values Squares: Mackensen 2012 60 W Our coretop values on benthic forams are 0. 85 ‰ while d 13 C overlying seawater is 0. 90 ‰ 60 E 40 W 20 W 0 20 E 40 E 60 E South Africa
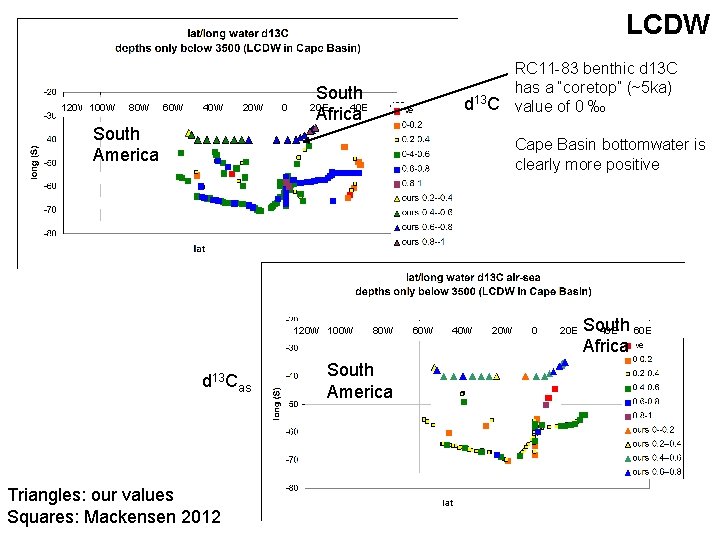
LCDW 120 W 100 W 80 W 60 W 40 W 20 W South America 0 RC 11 -83 benthic d 13 C has a “coretop” (~5 ka) 13 d C value of 0 ‰ South 40 E Africa 20 E Cape Basin bottomwater is clearly more positive 120 W 100 W d 13 Cas Triangles: our values Squares: Mackensen 2012 80 W South America 60 W 40 W 20 W 0 20 E South 40 E 60 E Africa
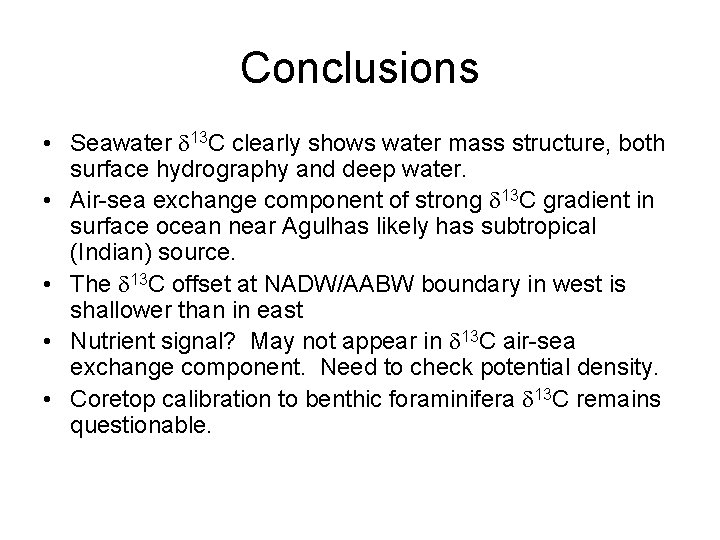
Conclusions • Seawater d 13 C clearly shows water mass structure, both surface hydrography and deep water. • Air-sea exchange component of strong d 13 C gradient in surface ocean near Agulhas likely has subtropical (Indian) source. • The d 13 C offset at NADW/AABW boundary in west is shallower than in east • Nutrient signal? May not appear in d 13 C air-sea exchange component. Need to check potential density. • Coretop calibration to benthic foraminifera d 13 C remains questionable.

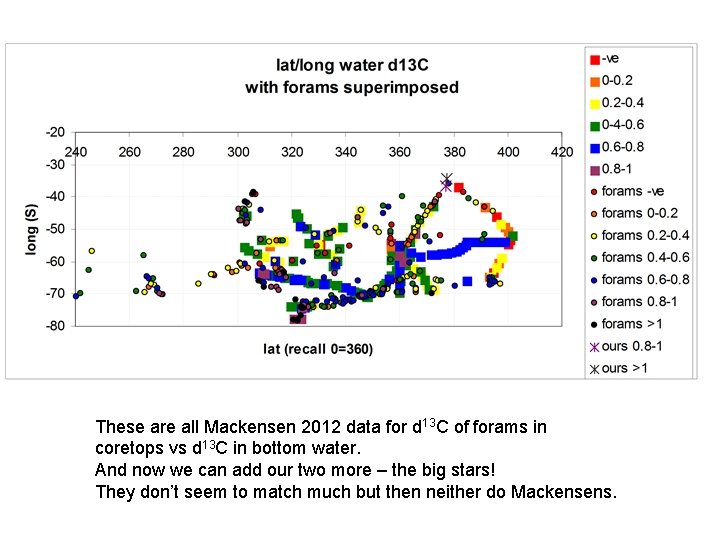
These are all Mackensen 2012 data for d 13 C of forams in coretops vs d 13 C in bottom water. And now we can add our two more – the big stars! They don’t seem to match much but then neither do Mackensens.
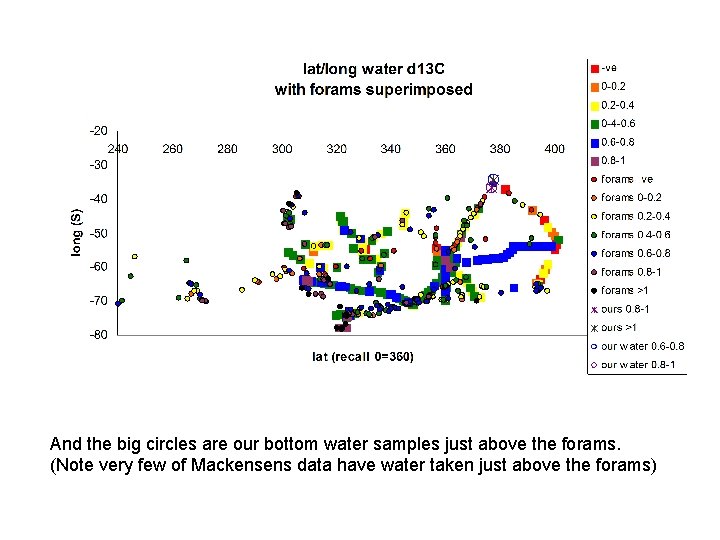
And the big circles are our bottom water samples just above the forams. (Note very few of Mackensens data have water taken just above the forams)

Worksheets provided • • • ‘jo's current look at results-xtra DIC’ ‘jo's current look at results’ ‘just before Oxford jc 068 geotraces’ jc 068 geotraces TDD and try for final

AAIW 500 -2000 NADW 2000 -3500 LCDW below 3500 So we find d 13 Cair-sea AAIW -0. 55 to 0. 1‰ NADW 0. 21 to 0. 42‰ LCDW 0. 19 to 0. 77‰ Comparisons with other data: Working out d 13 Cas using PO 4 and d 13 C of Mackensen 1993 at 44 S 10. 3 E AAIW 0. 52 to 0. 59‰ NADW 0. 003 to 0. 053‰ LCDW -0. 11 to 0. 022‰ The discrepancy in values is disappointing as I worked them out. I have checked the units and they seem to be the same – umol/L. Lynch-Stieglitz and Fairbanks 1994 had d 13 Cair-sea for Atlantic all negative (their values were from Cd not PO 4) and I can’t see where they get their modern ocean values from. We could perhaps say our values will be higher, being pulled up by mixing with positive Antarctic. But surely not this much. ( Mackensen 2012 says NADW characterised by negative d 13 Cair-sea, despite the values above 0. 003 to 0. 053‰)
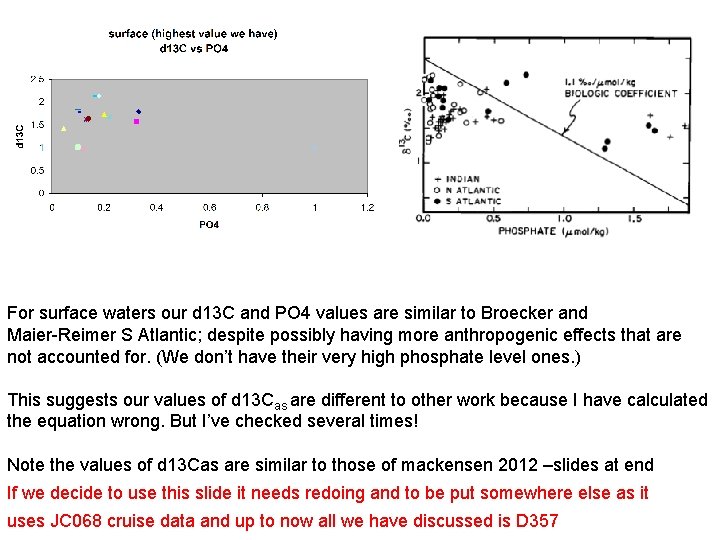
For surface waters our d 13 C and PO 4 values are similar to Broecker and Maier-Reimer S Atlantic; despite possibly having more anthropogenic effects that are not accounted for. (We don’t have their very high phosphate level ones. ) This suggests our values of d 13 Cas are different to other work because I have calculated the equation wrong. But I’ve checked several times! Note the values of d 13 Cas are similar to those of mackensen 2012 –slides at end If we decide to use this slide it needs redoing and to be put somewhere else as it uses JC 068 cruise data and up to now all we have discussed is D 357
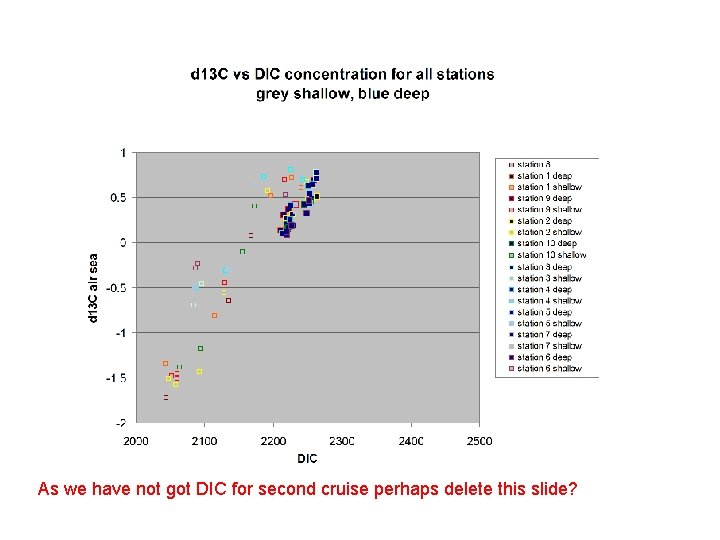
As we have not got DIC for second cruise perhaps delete this slide?

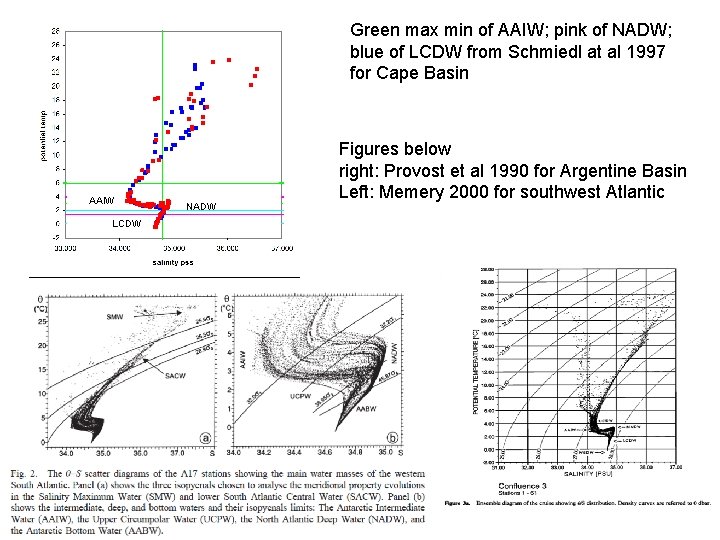
Green max min of AAIW; pink of NADW; blue of LCDW from Schmiedl at al 1997 for Cape Basin ) AAIW LCDW NADW Figures below right: Provost et al 1990 for Argentine Basin Left: Memery 2000 for southwest Atlantic

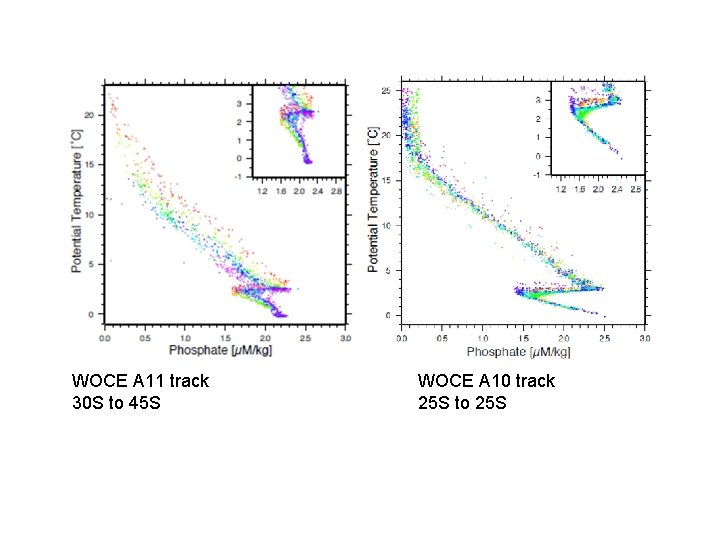
WOCE A 11 track 30 S to 45 S WOCE A 10 track 25 S to 25 S
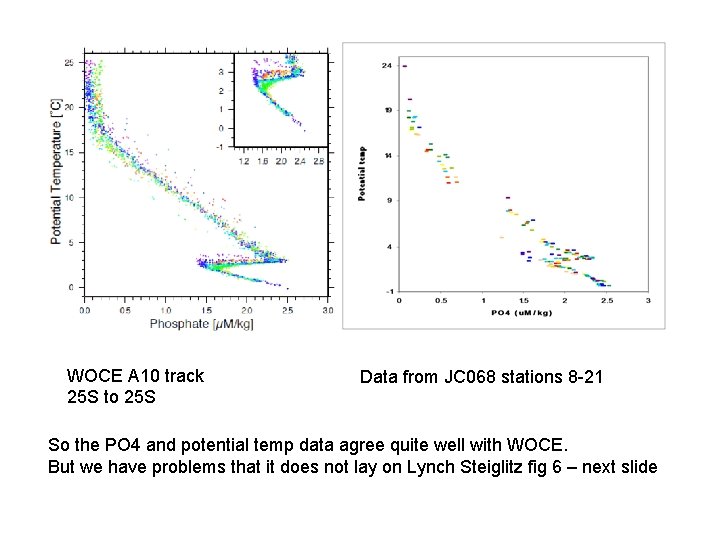
WOCE A 10 track 25 S to 25 S Data from JC 068 stations 8 -21 So the PO 4 and potential temp data agree quite well with WOCE. But we have problems that it does not lay on Lynch Steiglitz fig 6 – next slide
- Slides: 44