Capnography BY AHMAD YOUNES PROFESSOR OF THORACIC MEDICINE

Capnography BY AHMAD YOUNES PROFESSOR OF THORACIC MEDICINE Mansoura Faculty Of Medicine

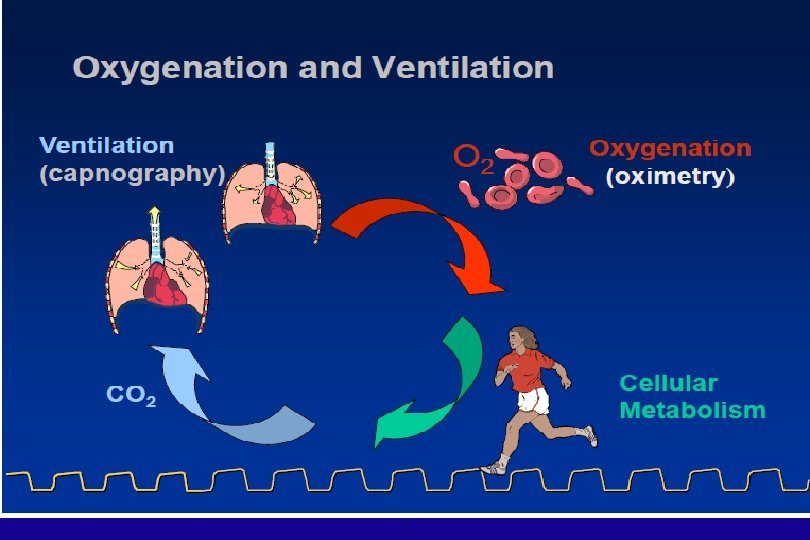
Respiration • The respiratory process consists of three main events: 1 -Cellular Metabolism of food into energy – O 2 consumption and CO 2 production. 2 - Transport of O 2 and CO 2 between cells and pulmonary capillaries, and diffusion from / into alveoli. 3 - Ventilation between alveoli and atmosphere
")
Capnography Depicts Respiration • Because all three components of respiration (metabolism, transport, and ventilation) are involved in the appearance of CO 2 in exhaled gas, capnography gives an excellent picture of the respiratory process. • Of course, oxygenation is a major part of respiration and therefore must also be monitored in order to complete the picture. This can be accomplished through pulse oximetry.
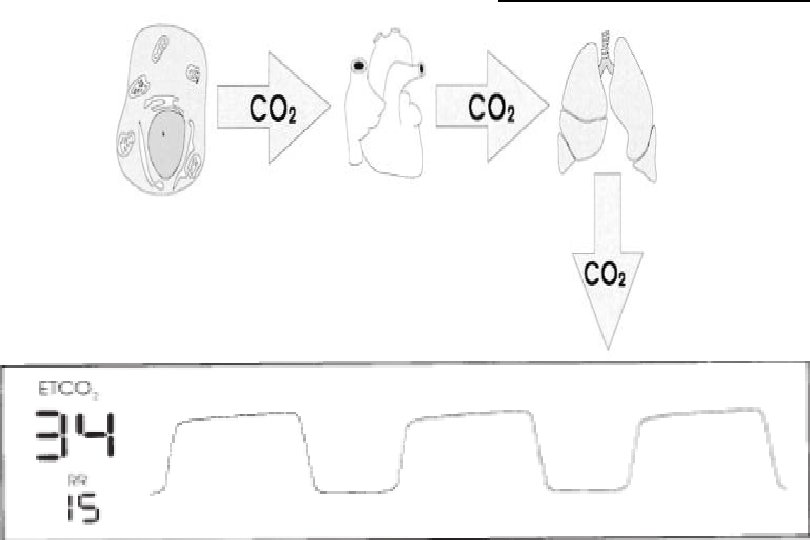
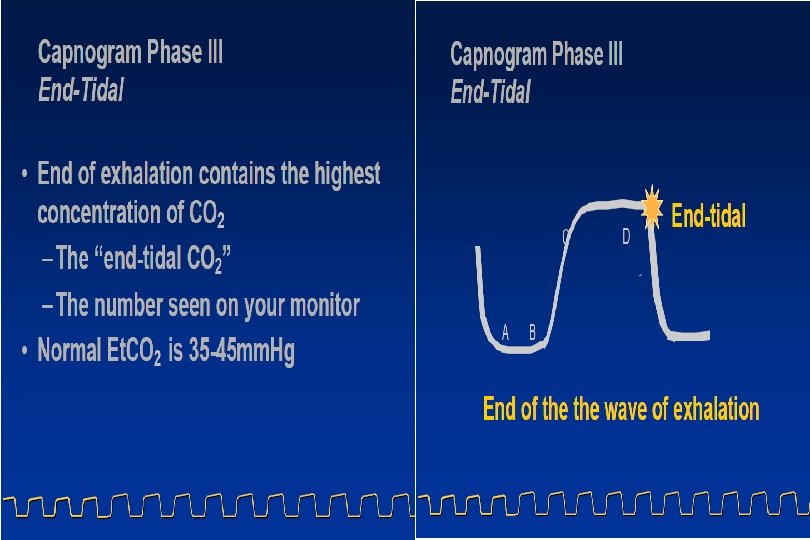
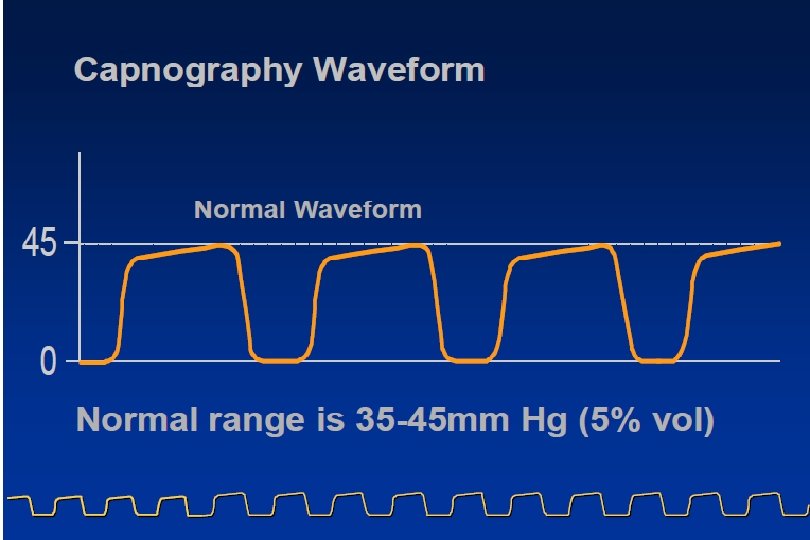

Normal Arterial and End-Tidal CO 2 Values • Normal Arterial and End-Tidal CO 2 Values : 3545 mm. Hg. • End-Tidal CO 2 (ETCO 2) from Capnograph : 3043 mm. Hg

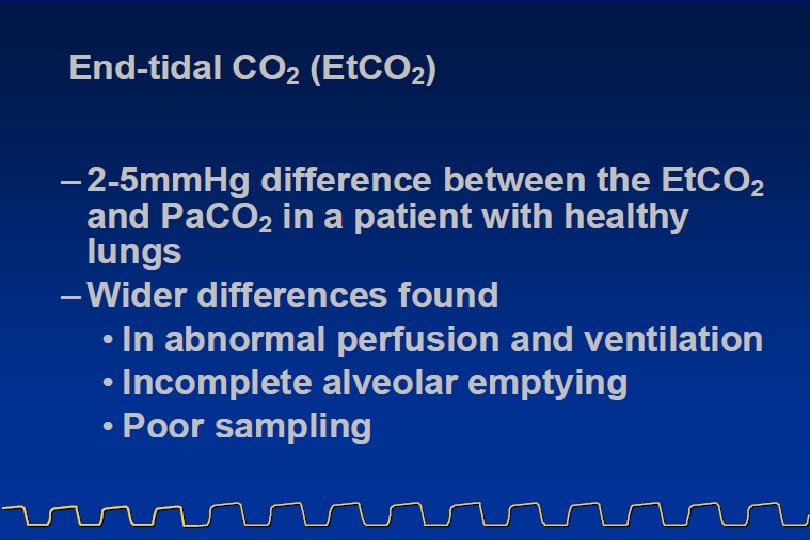
Arterial to End-Tidal CO 2 Gradient • Under normal physiologic conditions, the difference between arterial PCO 2 (from ABG) and alveolar PCO 2 (ETCO 2 from capnograph) is 2 -5 mm. Hg. This difference is termed the Pa. CO 2 – PETCO 2 gradient or the a-A DCO 2 and can be increased by: • COPD (causing incomplete alveolar emptying). • ARDS (causing a ventilation-perfusion mismatch). • A leak in the sampling system or around the ET tube. • With both healthy and diseased lungs, ETCO 2 can be used to detect trends in Pa. CO 2, alert the clinician to changes in a patient’s condition, and reduce the required number of ABGs. • With healthy lungs and normal airway conditions, end-tidal CO 2 provides a reasonable estimate of arterial CO 2 (within 2 -5 mm. Hg).

Arterial to End-Tidal CO 2 Gradient • With diseased lungs, there is an increased arterial to end-tidal CO 2 gradient due to ventilation-perfusion mismatch. • Related changes in the patient’s condition will be reflected in a widening or narrowing of the gradient, conveying the V/Q imbalance and therefore the pathophysiological state of the lungs

Factors Affecting Capnographic Readings

Physiologic Factors Affecting ETCO 2 Levels

Equipment Related Factors Affecting ETCO 2 Levels

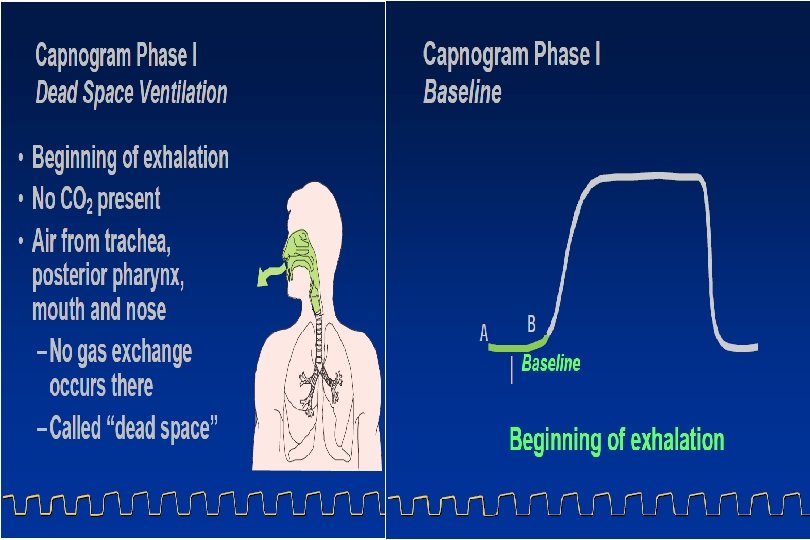
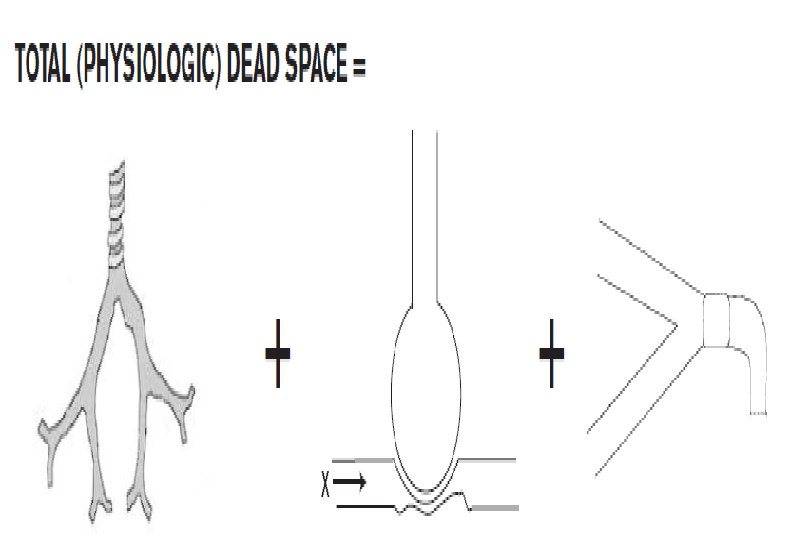
Dead Space • Dead space refers to ventilated areas which do not participate in gas exchange. • Total, or physiologic dead space, refers to the sum of : 1 - Anatomic dead space refers to the dead space caused by anatomical structures, i. e. , the airways leading to the alveoli. 2 - Alveolar dead space refers to ventilated areas which are designed for gas exchange , i. e. alveoli, but do not actually participate. This can be caused by lack of perfusion, e. g. , pulmonary embolism, or blockage of gas exchange, e. g. cystic fibrosis. 3 - Mechanical dead space refers to external artificial airways which add to the total dead space, as when a patient is being mechanically ventilated. • Mechanical dead space is an extension of anatomic dead space.
 describes the relationship between air flow in")
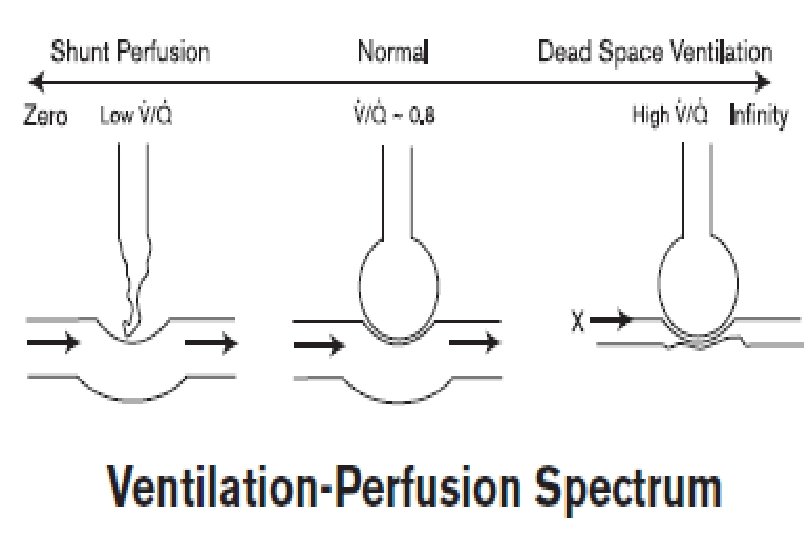
Ventilation-Perfusion Relationships • The ventilation-perfusion ratio (V/Q) describes the relationship between air flow in the alveoli and blood flow in the pulmonary capillaries. • If ventilation is perfectly matched to perfusion, then V/Q is 1. • Both ventilation and perfusion are unevenly distributed throughout the normal lung. However , the normal overall V/Q is 0. 8. • Shunt perfusion occurs under conditions in which alveoli are perfused but not ventilated, such as: Mucus plugging, ET tube in mainstream bronchus , Atelectasis. • Dead space ventilation occurs under conditions in which alveoli are ventilated but not perfused, such as: Pulmonary embolism , Hypovolemia , Cardiac arrest

Capnography vs. Capnometry • CO 2 data can be displayed in a variety of formats, such as numerics, waveforms, bar graphs, etc. • Capnogram is a real-time waveform record of the concentration of carbon dioxide in the respiratory gases • Capnograph is Capnogram waveform plus numerical value • Capnometry refers to the measurement and display of CO 2 in numeric form only. A capnometer is a device which performs such a function, displaying end-tidal and sometimes

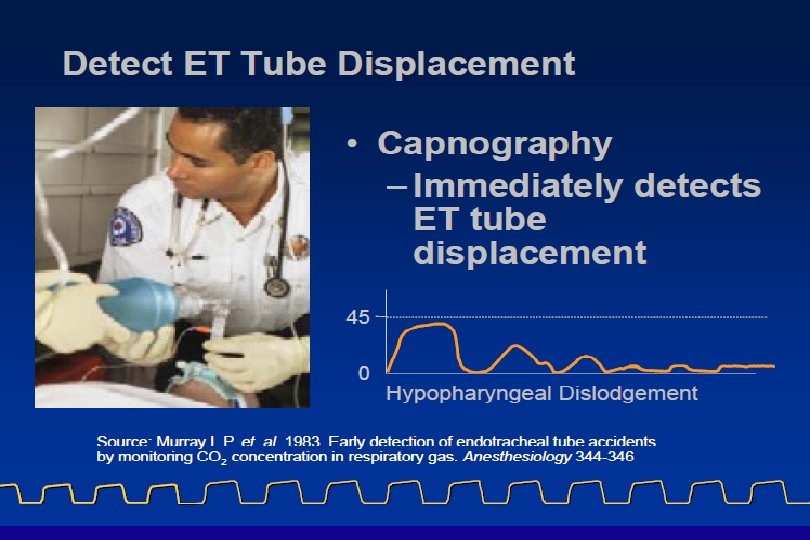
Capnography is More than ETCO 2 • Capnography is comprised of CO 2 measurement and display of the capnogram. • The capnograph enhances the clinical application of ECO 2 monitoring. • Value of the Capnogram : 1 - Validation of reported end-tidal CO 2 values 2 -Assessment of patient airway integrity , 3 - Assessment of ventilator, breathing circuit, and gas sampling integrity and 4 - Verification of proper endotracheal tube placement.

Capnography is More than ETCO 2 • Viewing a numerical value for ETCO 2 without its associated capnogram is like viewing the heart rate value from an electrocardiogram without the waveform. • End-Tidal CO 2 monitors that offer both a measurement of ETCO 2 and a waveform enhance the clincal application of ETCO 2 monitoring. • The waveform validates the ETCO 2 numerical value.

Quantitative vs. Qualitative ETCO 2 • The format for reported end-tidal CO 2 can be classified as quantitative (an actual numeric value) or qualitative (low, medium, high) • Quantitative ETCO 2 values are currently associated with electronic devices and usually can be displayed in units of mm. Hg, %, or k. Pa. • Although not absolutely necessary for some applications, i. e. , verification of proper ET tube placement, quantitative ETCO 2 is needed in order to take advantage of most of the major benefits of CO 2 measurements. • Qualitative CO 2 measurements are associated with a range of ETCO 2 rather than the actual number.

Quantitative vs. Qualitative ETCO 2 • Electronic devices usually present this as a bar graph, while colorimetric devices are presented in a percentage range grouped by color. • If the ranges are numeric as is usually the case, e. g. , <5, 5 -10, >20 mm. Hg, it is said to be semiquantitative. These devices are termed CO 2 detectors, and their applications are typically limited to ET tube verification.

ETCO 2 Trend Graph and Histogram • The trend graph and histogram of ETCO 2 are convenient ways to clearly review patient data which has been stored in memory. • They are especially useful for: 1 -Reviewing effectiveness of interventions, e. g. , drug therapy or changes in ventilator settings 2 -Noting significant events from periods when the patient was not continuously supervised 3 -Keeping records of patient data for future reference

DEVICE CHARACTERISTICS • An ETCO 2 trend graph is shown for a one hour time period. Note the transient rise in ETCO 2, indicating possible administration of a bicarbonate bolus or release of a tourniquet. • An ETCO 2 histogram is shown for an eight hour time period. This format shows a statistical distribution of ETCO 2 values recorded during the time period.
 Side-stream capnographs (right)")
Technical Aspects of Capnography Main-stream capnographs(left) Side-stream capnographs (right)
 Absorption • The infrared absorption technique for monitoring CO 2 remains the")
Infrared (IR) Absorption • The infrared absorption technique for monitoring CO 2 remains the most popular and versatile technique today. • The principle is based on the fact that CO 2 molecules absorb infrared light energy of specific wavelengths, with the amount of energy absorbed being directly related to the CO 2 concentration. • When an IR light beam is passed through a gas sample containing CO 2, the electronic signal from a photodetector , can be obtained. • This signal is then compared to the energy of the IR source, and calibrated to accurately reflect CO 2 concentration in the sample. To calibrate, the photodetector’s response to a known concentration of CO 2 is stored in the monitor’s memory.

Side stream sampling “First generation devices” • Draws large sample into machine from the line • Can be used on intubated and non-intubated patients with a nasal cannula attachment Main stream sampling “Second generation devices” • Airway mounted sensors • Generally for intubated patients

Mainstream sampling • Mainstream and sidestream sampling refer to the two basic configurations of CO 2 monitors , regarding the position of the actual measurement relative to the source of the gas being sampled: • CAPNOSTAT Mainstream CO 2 sensors are placed at the airway of an intubated patient, allowing the inspired and expired gas to pass directly across the IR light path. • State-of-the-art technology allows this configuration to be durable, small, and lightweight, and virtually hassle-free. • The major advantages of mainstream sensors are fast response time and elimination of water traps. • Fast, accurate on airway measurement, no calibration required • Disposable & reusable airway adapters for all patients

Capnostat Mainstream Co 2 sensor • Integration made easy! • There is no need to take up valuable space inside your monitoring system because all of the electronics are located inside the CAPNOSTAT head. • Only communication and power is essential to get you started. • Single patient use or reusable, < 5 cc dead space (Adult), < 1 cc dead space (Infant)

Capnostat Mainstream Co 2 sensor

Side stream Sampling • Lo. Flo Side stream CO 2 sensors are located away from the airway, requiring a gas sample to be continuously aspirated from the breathing circuit and transported to the sensor by means of a pump. • This type of system is needed for nonintubated patient. • Respironics has been providing innovative and cost effective solutions for over 20 years. • Sample Flow Rate 50 m. L /minute ± 10 m. L/minute • Robust and long life pump reduces periodic maintenance. No calibration required • Unique accessories & supplies for all patients

Lo. Flo Side stream CO 2 Sensor

Colorimetric CO 2 Detectors • Colorimetric CO 2 detectors rely on a modified form of litmus paper, which changes color relative to the hydrogen ion concentration (p. H) present. • Colorimetric CO 2 detectors actually measure the p. H of the carbonic acid that is formed as a product of the reaction between carbon dioxide and water (present as vapor in exhaled breath). • Exhaled and inhaled gas is allowed to pass across the surface of the paper and the clinician can then match the color to the color ranges printed on the device. • It is usually recommended to wait six breaths before making a determination.

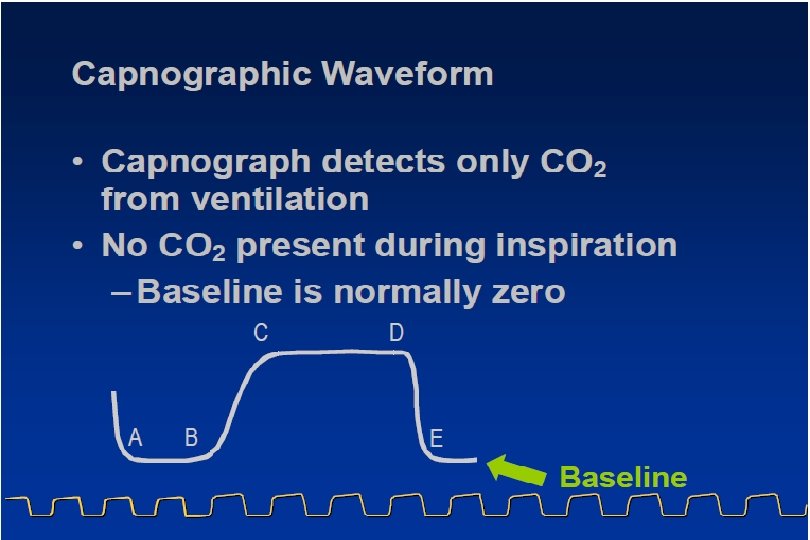
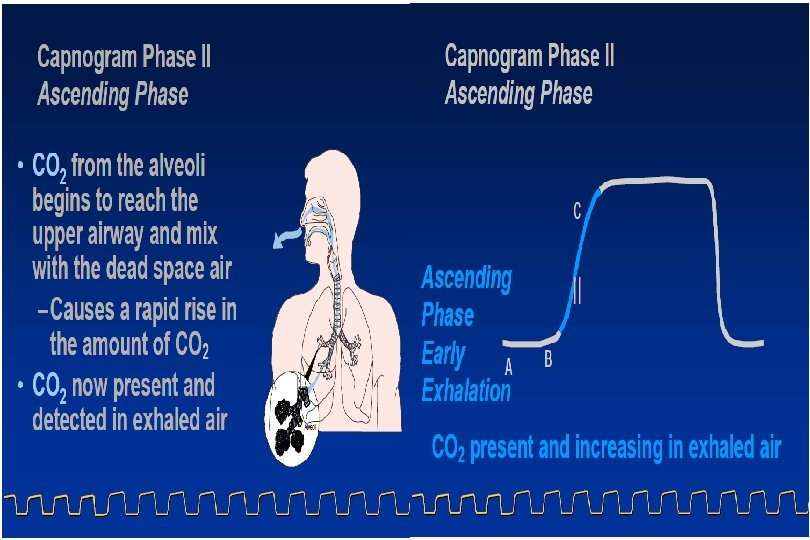
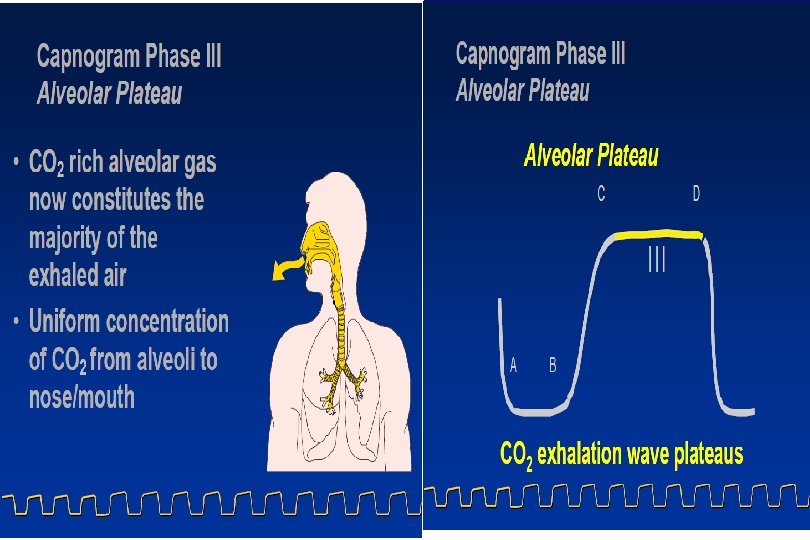
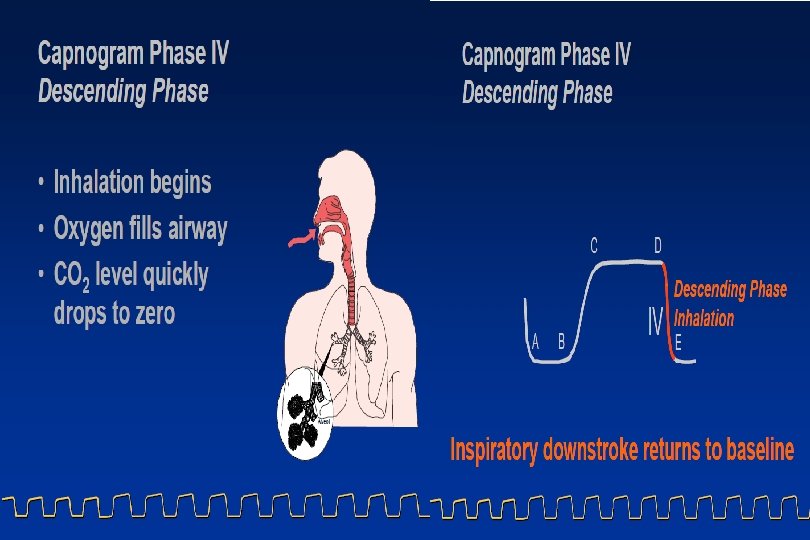
Capnogram Examples and Interpretations • The “normal” capnogram is a waveform which represents the varying CO 2 level throughout the breath cycle. • Waveform Characteristics: • A-B Baseline B-C Expiratory Upstroke • C-D Expiratory Plateau D End-Tidal • D-E Inspiration
 • Decrease")
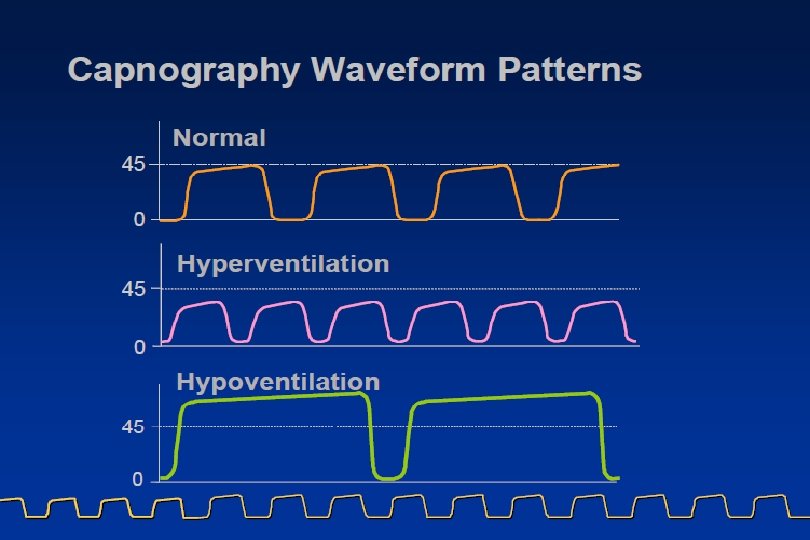
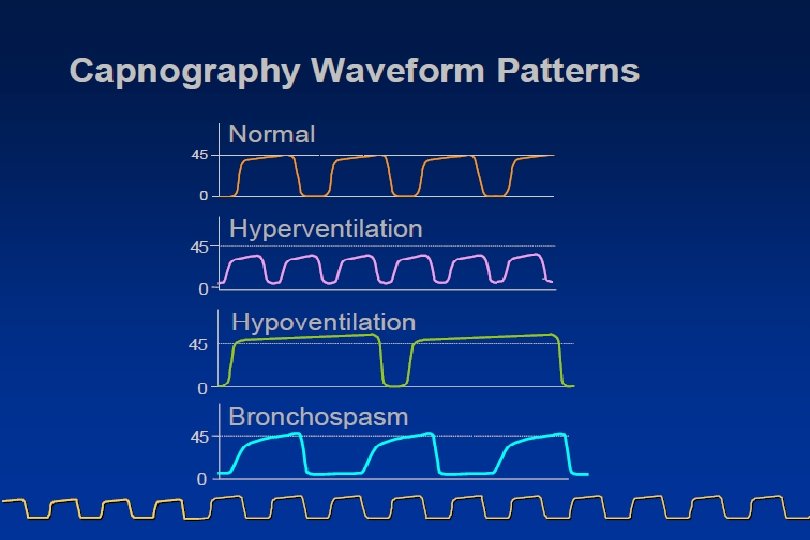
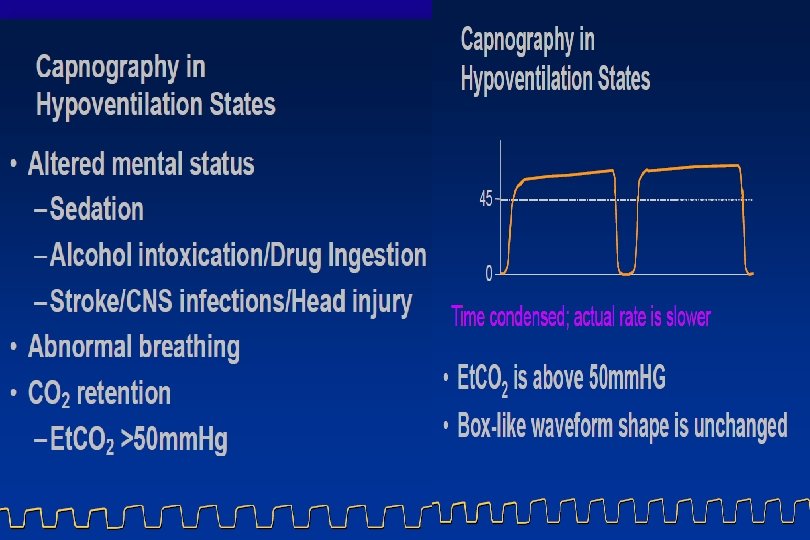
Increasing ETCO 2 Level Possible Causes: • Decrease in respiratory rate (hypoventilation) • Decrease in tidal volume (hypoventilation) • Increase in metabolic rate • Rapid rise in body temperature (malignant hyperthermia)
 • Increase")
Decreasing ETCO 2 Level Possible Causes: • Increase in respiratory rate (hyperventilation) • Increase in tidal volume (hyperventilation) • Decrease in metabolic rate • Fall in body temperature

Rebreathing • Elevation of the baseline indicates rebreathing (may also show a corresponding increase in ETCO 2 ). Possible Causes: • Faulty expiratory valve • Inadequate inspiratory flow • Insufficient expiratory time • Partial rebreathing circuits

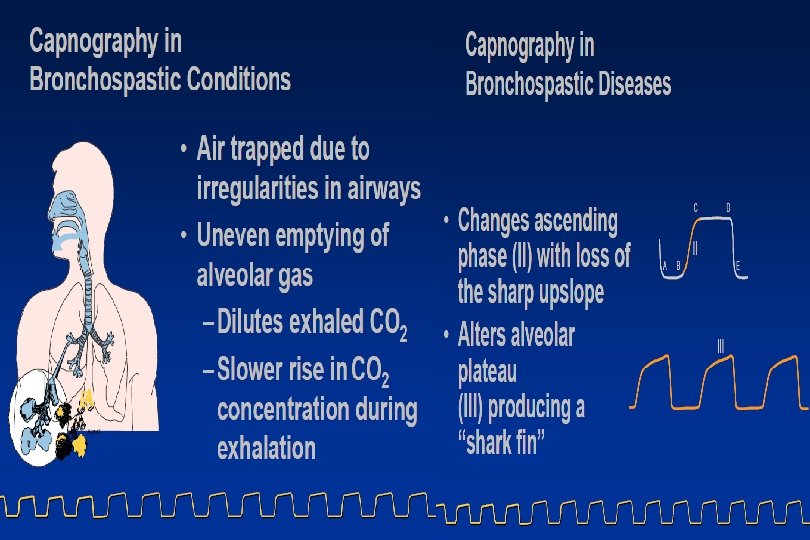
Obstruction in Breathing Circuit or Airway • Obstructed expiratory gas flow is noted as a change in the slope of the ascending limb of the capnogram (the expiratory plateau may be absent). Possible Causes: • Obstruction in the expiratory limb of the breathing circuit • Presence of a foreign body in the upper airway • Partially kinked or occluded artificial airway • Bronchospasm
 • Clefts are seen in the plateau portion of the")
Muscle Relaxants (curare cleft) • Clefts are seen in the plateau portion of the capnogram. They appear when the action of the muscle relaxant begins to subside and spontaneous ventilation returns. • Characteristics : Depth of the cleft is inversely proportional to the degree of drug activity • Position is fairly constant on the same patient but not necessarily present with every breath.
 Absorption")
Infrared (IR) Absorption
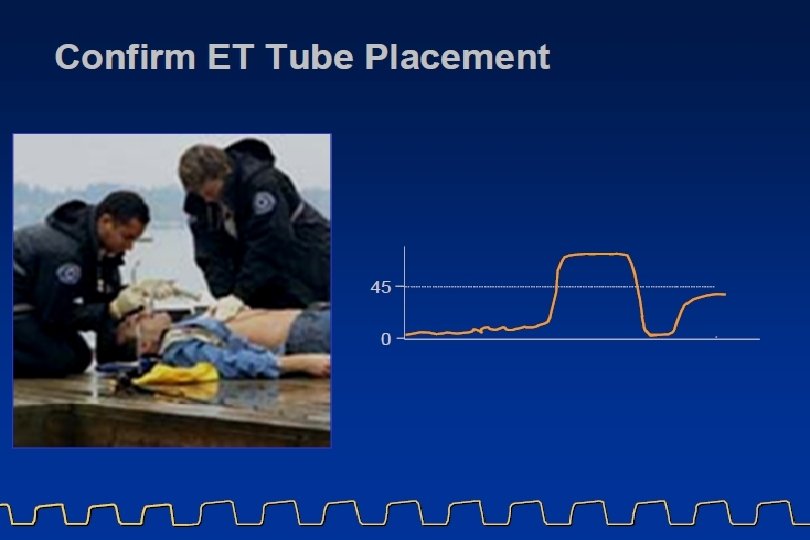

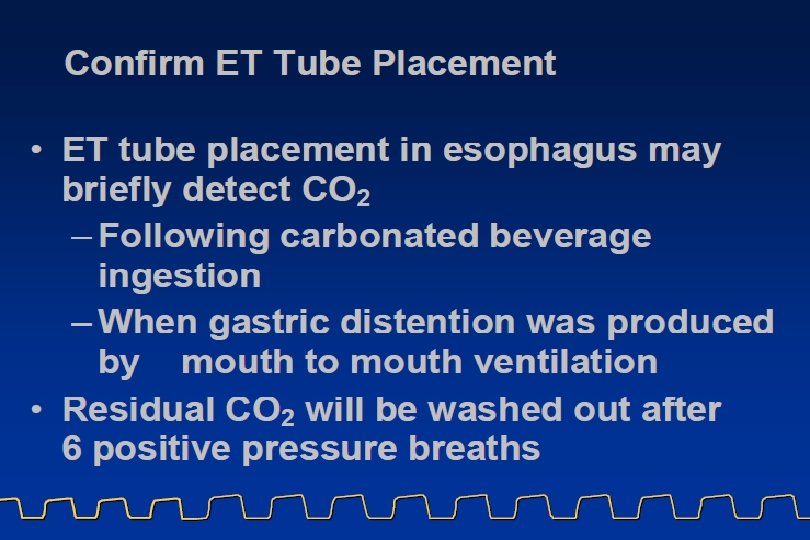
Endotracheal Tube in the Esophagus • A normal capnogram is the best available evidence that the ET tube is correctly positioned and that proper ventilation is occurring. • When the ET tube is placed in the esophagus, either no CO 2 is sensed or only small transient waveforms are present.

Inadequate Seal Around Endotracheal Tube • The downward slope of the plateau blends in with the descending limb. Possible Causes: • A leaky or deflated endotracheal or tracheostomy cuff • An artificial airway that is too small for the patient

Faulty Ventilator Exhalation Valve • Waveform Evaluation: Baseline elevated • Abnormal descending limb of capnogram • Allows patient to rebreathe exhaled gas

Cardiogenic Oscillations • Cardiogenic oscillations appear during the final phase of the alveolar plateau and during the descending limb. • They are caused by the heart beating against the lungs. • Characteristics: Rhythmic and synchronized to heart rate • May be observed in pediatric patients who are mechanically ventilated at low respiratory rates with prolonged expiratory times

• This capnogram shows a complete loss of waveform indicating no CO 2 present. Capnography allows for instantaneous recognition of this potentially fatal condition. Since this occurred suddenly, consider the following causes: • Dislodged ET Tube • Total obstruction of ET Tube • Respiratory arrest in the non-intubated patient • Equipment malfunction (If the patient is still breathing) Check all connections and sampling chambers.

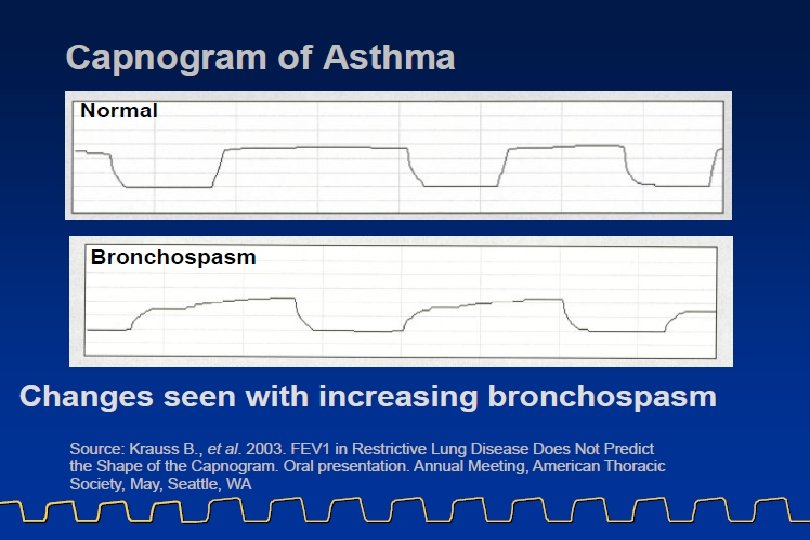
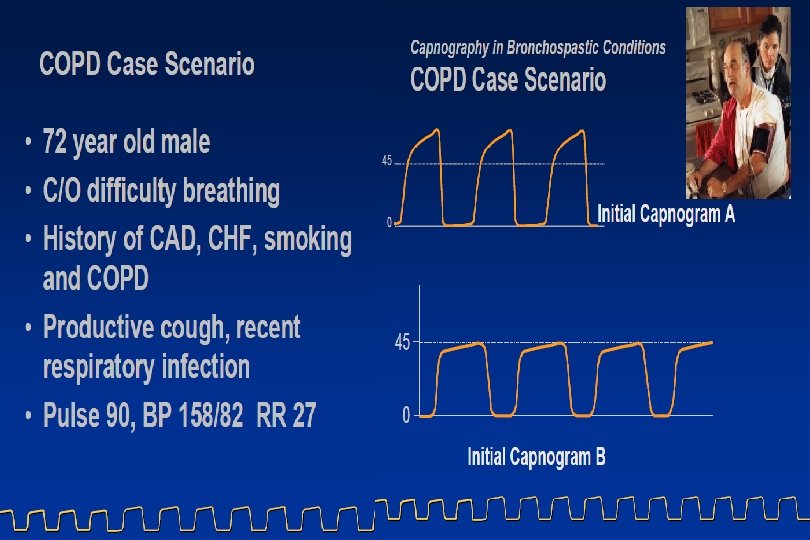
• This capnogram displays an abnormal loss of alveolar plateau meaning obstructed exhalation. Note the “Shark’s fin” pattern. This pattern is found in the following Bronchoconstriction • Asthma • COPD • Incomplete airway obstruction • Tube kinked or obstructed by mucous.

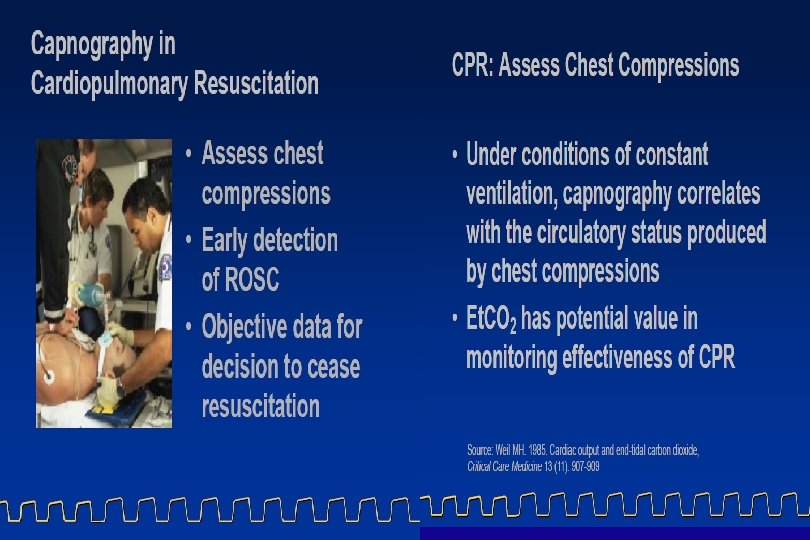
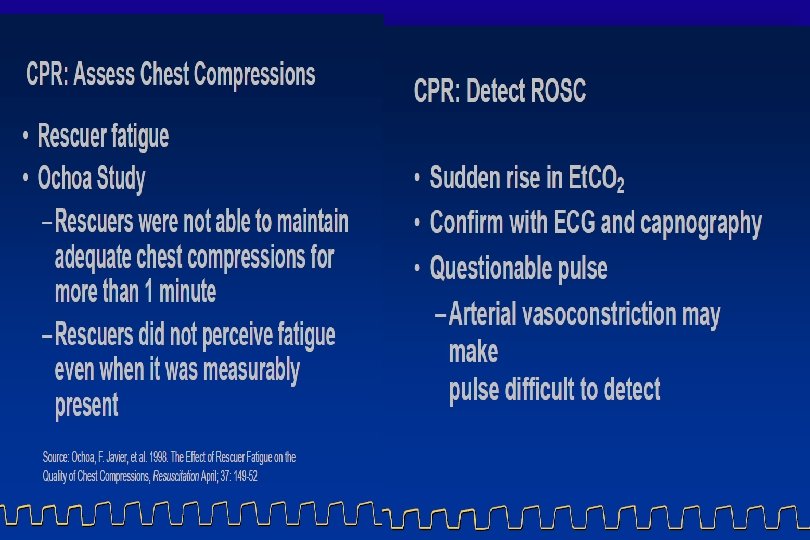
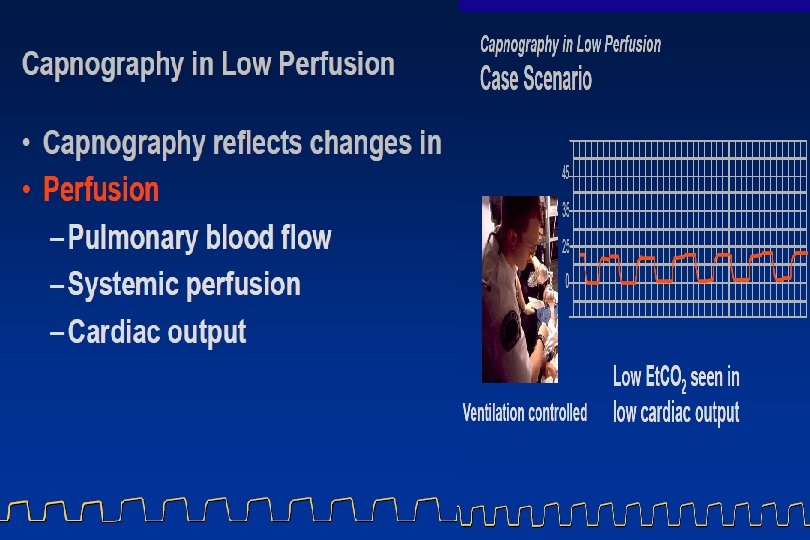
• The capnogram can indicate perfusion during CPR and effectiveness of resuscitation efforts. • Note the trough in the center of the capnogram. During this time, there was a change in personnel doing CPR. • The fatigue of the first rescuer was demonstrated when the second rescuer took over compressions.

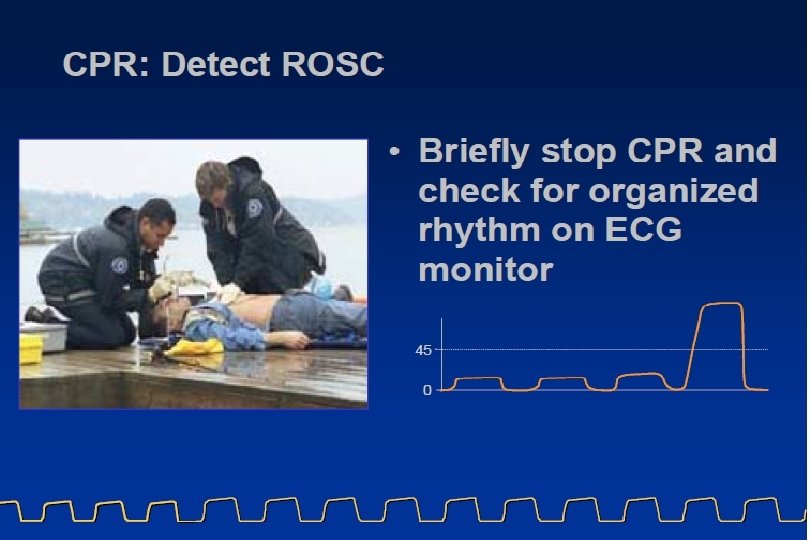
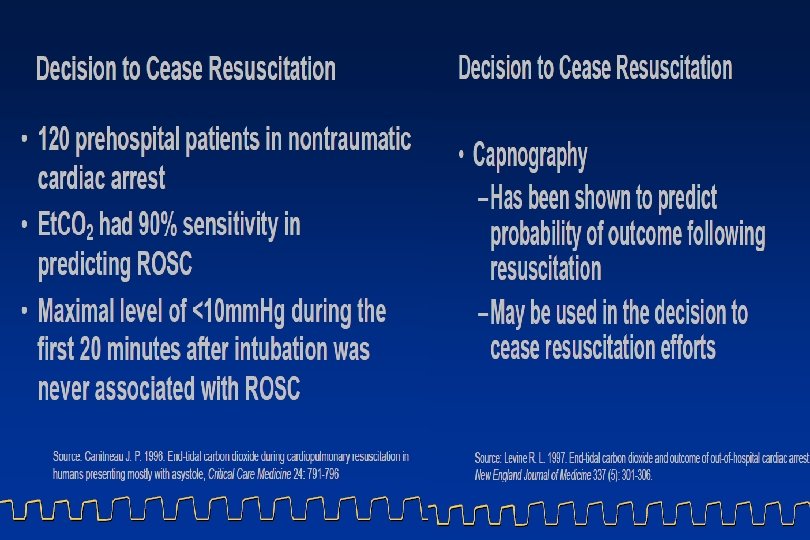
• This patient was defibrillated successfully with a return of spontaneous pulse. • Notice the dramatic change in the Et. CO 2 when pulses were restored. • Studies have shown that consistently low readings (less than 10 mm) during resuscitation reflect a poor outcome and futile resuscitation.

• This capnogram demonstrates an elevation to the baseline. This indicates incomplete inhalation and or exhalation. CO 2 does not get completely washed out on inhalation. Possible causes for this include: • Air trapping (as in asthma or COPD) • CO 2 rebreathing (ventilator circuit problem)

• Spontaneous breathing efforts may be evident on the CO 2 waveform display. • The patient on the top demonstrates poorer quality spontaneous breathing effort than the patient on the bottom.

Possible causes: 1. Cardiopulmonary arrest 2. Pulmonary embolism 3. Sudden hypotension, massive blood loss 4. Cardiopulmonary bypass
 2. Rising")
Possible causes: 1. Hypoventilation (due to underlying illness/injury or inadequate assisted ventilations) 2. Rising body temperature, increasing pain (Increasing Metabolism)
 2. Hyperthermia,")
Possible causes: 1. Hypoventilation (due to underlying illness/injury or inadequate assisted ventilations) 2. Hyperthermia, pain, shivering (Increase in Metabolism)

Possible causes: 1. Bronchospasm of asthma or COPD exacerbation 2. Incomplete obstuction / mucus plugging
 2. Hypothermia")
Possible Causes: 1. Hyperventilation (due to underlying illness/injury or excessive assisted ventilations) 2. Hypothermia (Decrease in Metabolism)

The end-tidal PCO 2 in polysomnography • The end-tidal PCO 2 , a more accurate description of the signal is exhaled PCO 2, but the phrase end-tidal PCO 2 monitoring is widely used. • Monitoring of exhaled PCO 2 is routinely performed during pediatric PSG, and the absence of signal deflections (no CO 2 exhaled) has been used to score apneas. • The side stream method is most commonly used and consists of gas suctioned via a nasal cannula to an external sensor at bedside. • Mouth breathing and occlusion of the nasal cannula impair the ability of end-tidal PCO 2 monitoring to detect apnea. • The magnitude of signal excursion depends entirely on the highest value of PCO 2 in the exhaled breath rather than the magnitude of tidal volume or flow.

The exhaled PCO 2 is the capnography signal. The presence of apnea is documented by (A) oronasal thermal flow and (B) capnography. Note that the capnography signal lags behind the flow signal. The event depicted is an obstructive apnea. Thoracoabdominal paradox (D) is noted during the event but not during unobstructed breathing (C).

Capnocheck® Sleep Capnograph / Oximeter • The gold standard method for documenting hypoventilation is the processing of an arterial sample for determination of Pa. CO 2. • Given the difficulty of drawing an arterial sample during sleep, the 2007 scoring manual states that finding an elevated Pa. CO 2 obtained immediately after waking would provide evidence of hypoventilation during sleep. • The ability to draw or process an arterial blood gas sample is rarely available in sleep centers. • Surrogate measures such as end-tidal PCO 2 (PETCO 2) and transcutaneous PCO 2 (PTCCO 2) are commonly used during PSG.

Monitoring of sleep hypoventilation • A 2007 scoring manual note for the hypoventilation rule in adults states that there is insufficient evidence to allow specification of sensors for direct or surrogate measures of Pa. CO 2. “both end-tidal CO 2 and transcutaneous CO 2 may be used as surrogate measures of Pa. CO 2 if there is demonstration of reliability and validity within laboratory practices. ” • The task force recommends that arterial PCO 2, transcutaneous PCO 2, or end-tidal PCO 2 be used for detecting hypoventilation during diagnostic study in both adults and children [Recommended] (Consensus). • During PAP titration in both adults and children, either arterial PCO 2 or transcutaneous PCO 2 is the recommended method to detect hypoventilation [Recommended] (Consensus).
")
Carbon dioxide transcutaneous pressure monitor (tc. PCO 2, with Sp. O 2)
 analysis was introduced in")
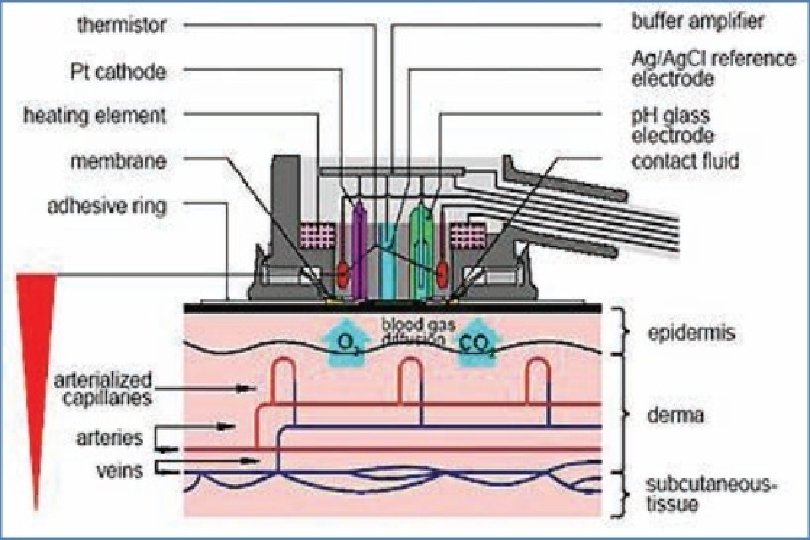
Transcutaneous Carbon Dioxide Monitoring • Transcutaneous carbon dioxide (CO 2) analysis was introduced in the early 1980 s using locally heated electrochemical sensors that were applied to the skin surface. Tc. CO 2 makes use of the fact that CO 2 gas diffuses through the body tissue and skin and can be detected by a sensor at the skin surface. • CO 2 is measured potentiometrically by determining the p. H of an electrolyte layer separated from the skin by a highly permeable membrane. As CO 2 diffuses through the membrane there is a change in the p. H of the electrolyte, CO 2 then reacts with water to form hydrogen and bicarbonate ions. • A change in p. H is proportional to the logarithm of PCO 2 change. The p. H is determined by measuring the potential between a miniaturized p. H glass electrode and a silver chloride reference electrode.

Transcutaneous Carbon Dioxide Monitoring • The sensor causes a local hyperaemia, which increases the blood supply in the dermal capillary bed below the sensor. This value corresponds well with the corresponding Pa. CO 2 value. The induced hyperaemia causes the recorded value to be higher than the arterial value for Pa. CO 2, thus the value is corrected. • The higher Tc. CO 2 value is due to two factors; firstly the increase in temperature raises local blood and tissue Pa. CO 2 by 4. 5%, and secondly the living epidermal cells produce CO 2 which contributes to the capillary CO 2 level. Skin metabolism increases the Tc. CO 2 by approximately 5 mm Hg. This causes an over estimation of the level of CO 2. • A potential complication of Tc. CO 2 monitoring is thermal skin injury.

Transcutaneous Carbon Dioxide Monitoring • Tc. CO 2 sensors were heated between 43 and 45 degrees Celsius. The latest generations of sensors are heated to 42 degrees Celsius and can be placed onto the skin continuously for periods of up to 8 hours, with minimal risk of thermal skin injury and without the need to be moved to another skin site. • A certain level of training is required to place the sensor and manage the device. • Large amount of materials are required for normal operation of the monitors e. g. membranes for the sensor. • Future sensors may utilize optical only sensors which do not require calibration or membrane changes.

Transcutaneous Carbon Dioxide Monitoring • Transcutaneous sensors are available as a single use Tc. CO 2 sensor or as a combined Sp. O 2/Tc. CO 2 sensor • Most reports describe Tc. CO 2 values as 1. 3 to 1. 4 times greater than Pa. CO 2 values. • Transcutaneous CO 2 monitors are widely used in neonatal ICUs. Until recently, these devices performed poorly in adults. • Recent technical modifications have produced transcutaneous CO 2 monitors that have performed well in adults with chronic illnesses.
 and transcutaneous partial pressure of")
Trends in the arterial oxygen saturation (Sp. O 2) and transcutaneous partial pressure of carbon dioxide (Tc. PCO 2) during the night. Note the simultaneous increase in transcutaneous PCO 2 and the decrease in Sp. O 2 during episodes of REM sleep.

Monitoring of sleep hypoventilation • PTCCO 2 is the preferred technology in patients with lung disease, significant mouth breathing , or those who are using supplemental oxygen or mask ventilation. • PTCCO 2 values can occasionally be quite spurious and clinical judgment is needed. • When readings do not match the clinical setting, a change in sensor site or recalibration may be needed. • PETCO 2 is preferred where breath-to-breath changes in Pa. CO 2 need to be detected. In this setting, the ability to detect an increase in PCO 2 associated with a respiratory event is clinically useful.

The CO 2 tracing is delayed relative to exhaled airflow in the side stream method
 during sleep. Note")
Documentation of an increased partial pressure of carbon dioxide (PCO 2) during sleep. Note the alveolar plateaus (black circles). PCO 2 = exhaled PCO 2 waveform tracing; PETCO 2 = most recent end-tidal reading; Sp. O 2 = pulse oximetry.

Monitoring of sleep hypoventilation • The PETCO 2 is not an accurate estimate of the Pa. CO 2 during mouth breathing or with low tidal volume and fast respiratory rates. • Some manufacturers make a sampling nasal cannula with a “mouth guide” to allow sampling of gas exhaled through the mouth. • To be considered accurate, a definite plateau in the exhaled PETCO 2 versus time waveform should be observed. • End-tidal PCO 2 measurements are often inaccurate during application of supplemental oxygen or during mask ventilation. The exhaled gas sample is diluted by supplemental oxygen flow or PAP device flow.

Monitoring of sleep hypoventilation • Some clinicians use a small nasal cannula under the mask to sample exhaled gas at the nares in order to minimize dilution during PAP titration. However, the accuracy of measurements using this approach has not been documented. • Transcutaneous CO 2 monitoring (PTCCO 2) is also used during PSG to estimate the Pa. CO 2, but the signal has a longer response time than the PETCO 2 to acute changes in ventilation. • In adults, one study using an earlobe sensor found that the PTCCO 2 lagged behind Pa. CO 2 by about 2 minutes.

Monitoring of sleep hypoventilation • Newer transcutaneous device technology has allowed more rapid response time and enabled the devices to work at a lower skin temperature. • The advantage of PTCCO 2 monitoring compared to PETCO 2 is that the accuracy of transcutaneous measurements is not degraded by mouth breathing, supplemental oxygen, or mask ventilation. • PTCCO 2 will not provide data for breath-bybreath changes, e. g. , changes in the first few breaths after an apnea.

- Slides: 95