Capital in the 21 st century Thomas Piketty


 society")


 society")


")
 society")


,")

 • Inequality in America")


- Slides: 65
Capital in the 21 st century Thomas Piketty Paris School of Economics Santiago de Chile, January 13 2015
• This presentation is based upon Capital in the 21 st century (Harvard University Press, March 2014) • This book studies the global dynamics of income and wealth distribution since 18 c in 20+ countries; I use historical data collected over the past 15 years with Atkinson, Saez, Postel-Vinay, Rosenthal, Alvaredo, Zucman, and 30+ others; I try to shift attention from rising income inequality to rising wealth inequality • The book includes four parts: Part 1. Income and capital Part 2. The dynamics of the capital/income ratio Part 3. The structure of inequalities Part 4. Regulating capital in the 21 st century • In this presentation I will present some results from Parts 2 & 3, focusing upon the long-run evolution of capital/income ratios and wealth concentration (all graphs and series are available on line: see http: //piketty. pse. ens. fr/capital 21 c )
This presentation: three points • 1. The return of a patrimonial (or wealth-based) society in the Old World (Europe, Japan). Wealth-income ratios seem to be returning to very high levels in low growth countries. Intuition: in a slow-growth society, wealth accumulated in the past can naturally become very important. In the very long run, this can be relevant for the entire world. • 2. The future of wealth concentration: with high r - g during 21 c (r = net-of-tax rate of return, g = growth rate), then wealth inequality might reach or surpass 19 c oligarchic levels; conversely, suitable institutions can allow to democratize wealth. • 3. Inequality in America ( « meritocratic extremism » ): is the New World developing a new inequality model that is based upon extreme labor income inequality more than upon wealth inequality? Is it more merit-based, or can it become the worst of all worlds?
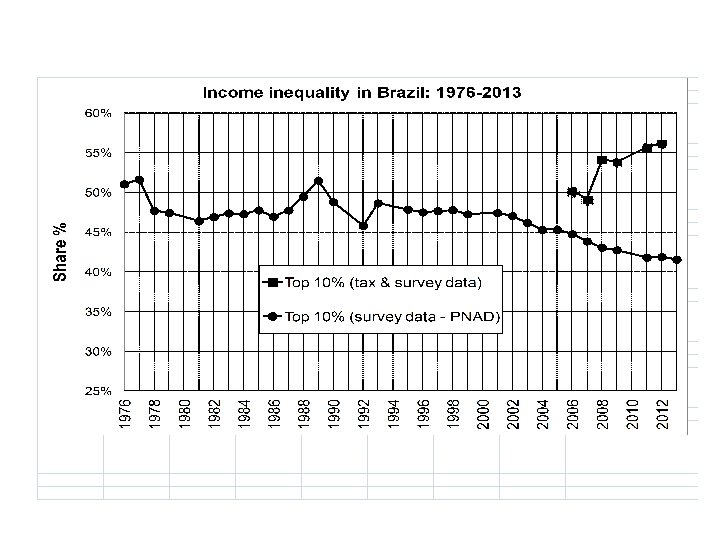
Chile vs Europe-US-Japan • Income inequality is known to be high in Chile, and across Latin America; but it is probably underestimated (pb with household surveys); recent study by Fairfield-Joratt suggests that top 1% share might be one of the highest in the world in Chile • Wealth inequality : probably very high as well, but we do not really know; income tax was created in 1924 in Chile, and inheritance tax was created in 1878; but unfortunately there has been limited use so far of historical income and inheritance tax statistics in Chile • Like other countries, Chile needs more transparency about income and wealth; using data from progressive tax on income, inheritance and wealth would be a powerful way to produce more information about how the different social groups are benefiting from growth, and in some cases to fight corruption
Top 1% income shares 2004 -2012: Chile vs U. S. 40 35 25 20 15 10 5 Chile-including retained profits plus adjustment for underreporting (Fairfield-Jorratt) US excluding capital gains 7/4/1905 12: 00 AM Chile-income as reported excluding capital gains (Fairfield-Jorratt) 7/3/1905 12: 00 AM 7/2/1905 12: 00 AM 7/1/1905 12: 00 AM 6/30/1905 12: 00 AM 6/29/1905 12: 00 AM 6/28/1905 12: 00 AM 6/27/1905 12: 00 AM 0 6/26/1905 12: 00 AM Share % 30
This presentation: three points • 1. The return of a patrimonial (or wealth-based) society in the Old World (Europe, Japan). Wealth-income ratios seem to be returning to very high levels in low growth countries. Intuition: in a slow-growth society, wealth accumulated in the past can naturally become very important. In the very long run, this can be relevant for the entire world. • 2. The future of wealth concentration: with high r - g during 21 c (r = net-of-tax rate of return, g = growth rate), then wealth inequality might reach or surpass 19 c oligarchic levels; conversely, suitable institutions can allow to democratize wealth. • 3. Inequality in America ( « meritocratic extremism » ): is the New World developing a new inequality model that is based upon extreme labor income inequality more than upon wealth inequality? Is it more merit-based, or can it become the worst of all worlds?
Figure S 5. 2. Private capital in rich countries: from the Japanese to the Spanish bubble 800% U. S. A Japan Germany France U. K. Italy Canada Australia Spain Value of private capital (% of national income) 700% 600% 500% 400% 300% 200% 1970 1975 1980 1985 1990 1995 2000 2005 Private capital almost reached 8 years of national income in Spain at the end of the 2000 s (ie. one more year than Japan in 1990). Sources and series: see piketty. pse. ens. fr/capital 21 c. 2010
Supplementary slides (long lecture version)
This presentation: three points • 1. The return of a patrimonial (or wealth-based) society in the Old World (Europe, Japan). Wealth-income ratios seem to be returning to very high levels in low growth countries. Intuition: in a slow-growth society, wealth accumulated in the past can naturally become very important. In the very long run, this can be relevant for the entire world. • 2. The future of wealth concentration: with high r - g during 21 c (r = net-of-tax rate of return, g = growth rate), then wealth inequality might reach or surpass 19 c oligarchic levels; conversely, suitable institutions can allow to democratize wealth. • 3. Inequality in America ( « meritocratic extremism » ): is the New World developing a new inequality model that is based upon extreme labor income inequality more than upon wealth inequality? Is it more merit-based, or can it become the worst of all worlds?
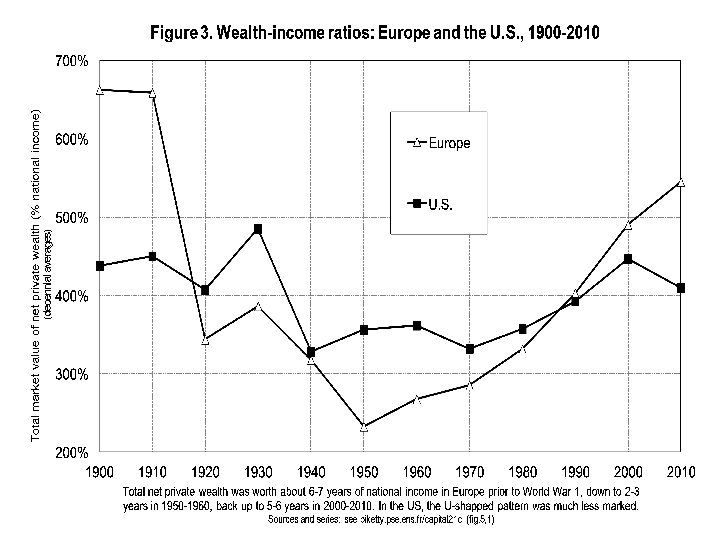
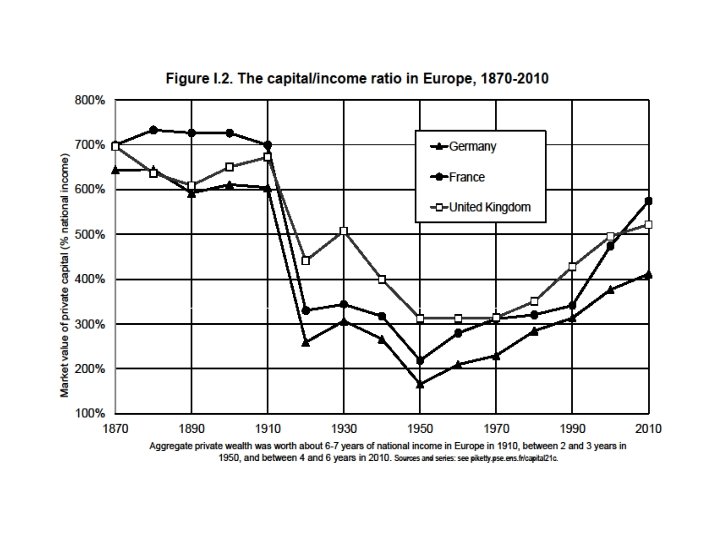
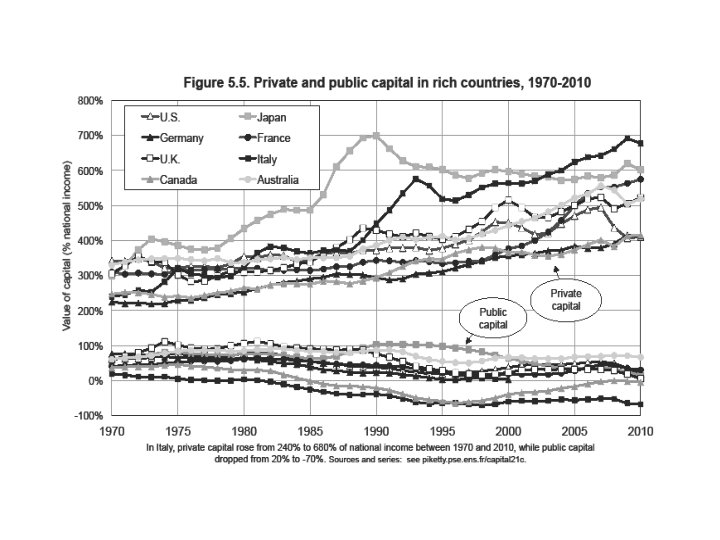
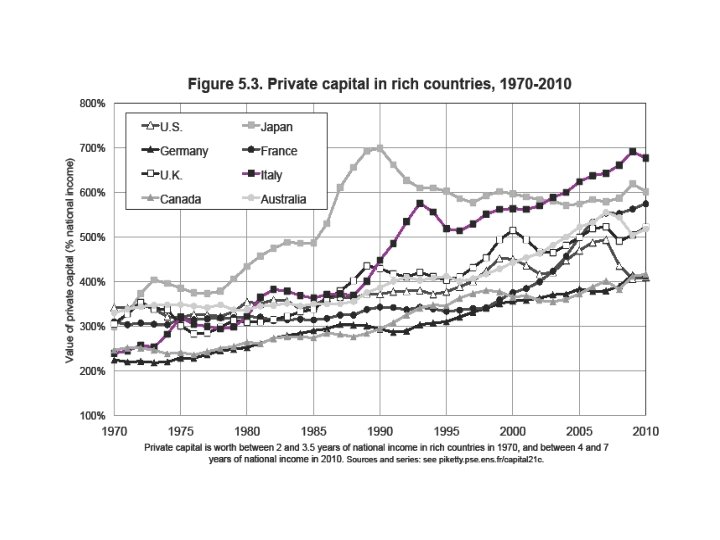
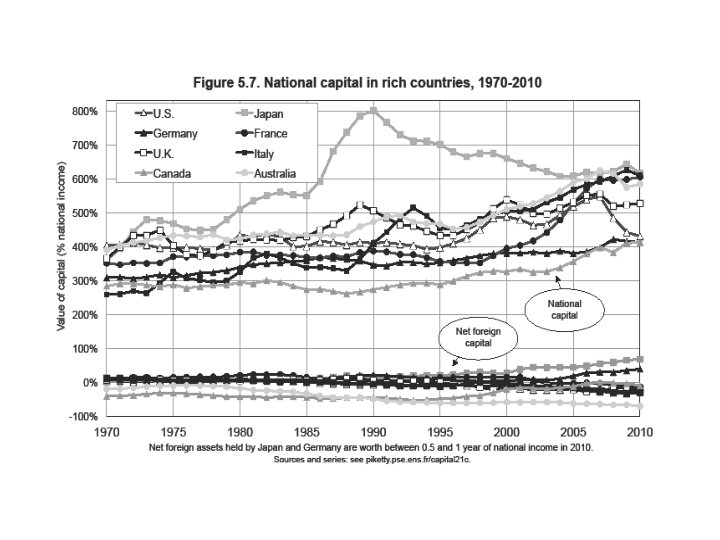
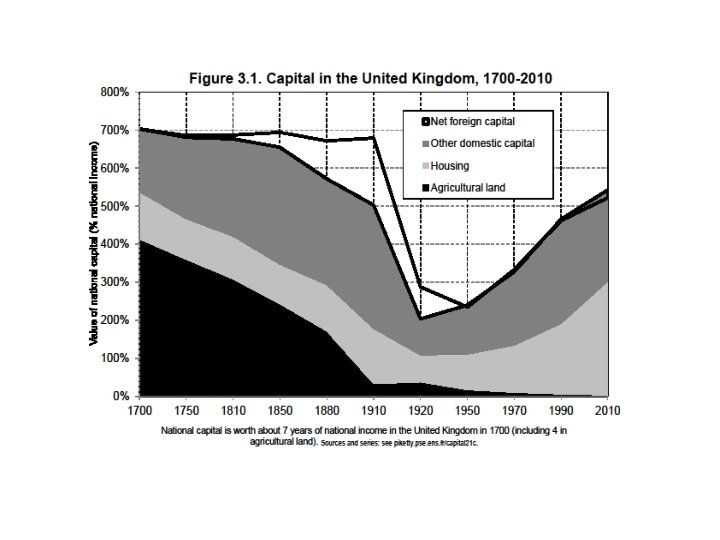
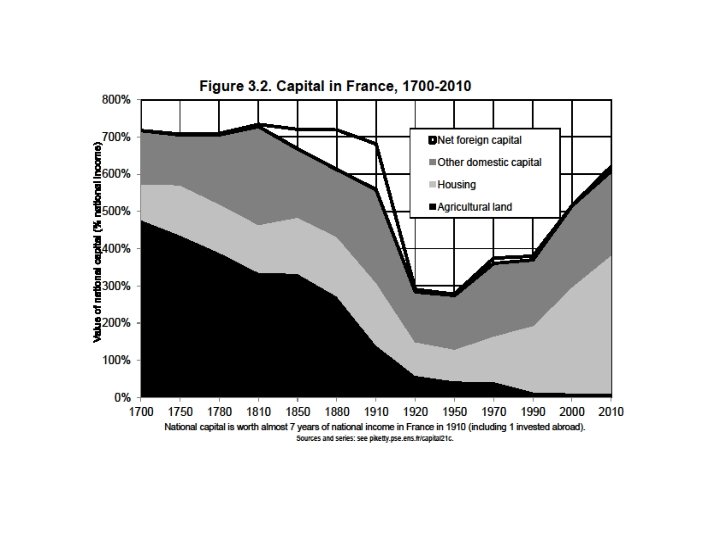
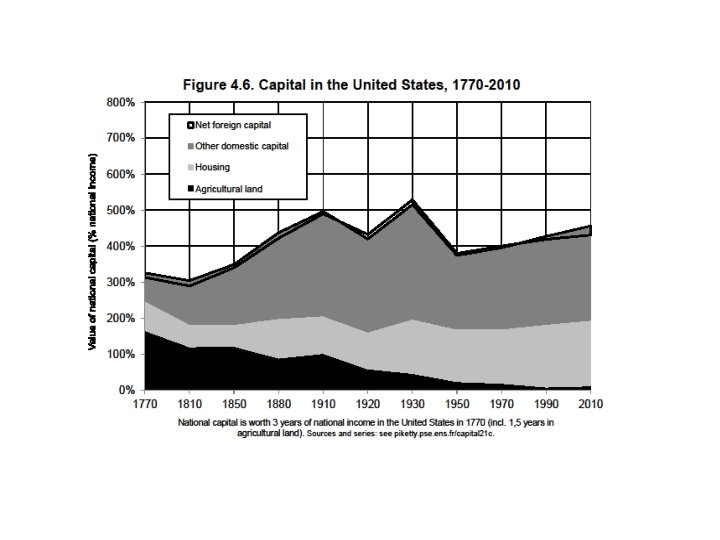
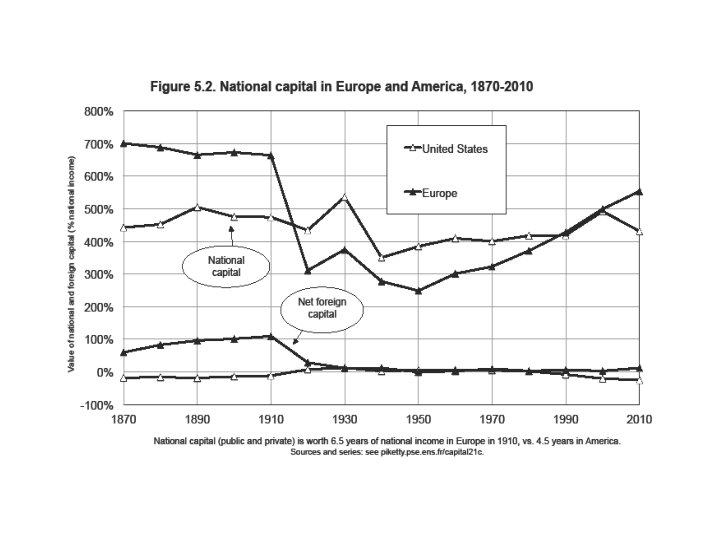
1. The return of a wealth-based society • Wealth = capital K = everything we own and that can be sold on a market (net of all debts) (excludes human K, except in slave societies) • In textbooks, wealth-income & capital-ouput ratios are supposed to be constant. But the so-called « Kaldor facts » actually rely on little historical evidence. • In fact, we observe in Europe & Japan a large recovery of β=K/Y in recent decades: β=200 -300% in 1950 -60 s → β=500 -600% in 2000 -10 s (i. e. average wealth K was about 2 -3 years of average income Y around 1950 -1960; it is about 5 -6 years in 2000 -2010) (with β≈600%, if Y≈30 000€ per capita, then K≈180 000€ per capita) (currently, K ≈ half real estate, half financial assets) Are we heading back to the β=600 -700% observed in the wealth-based societies of 18 c-19 c ? Or even more?
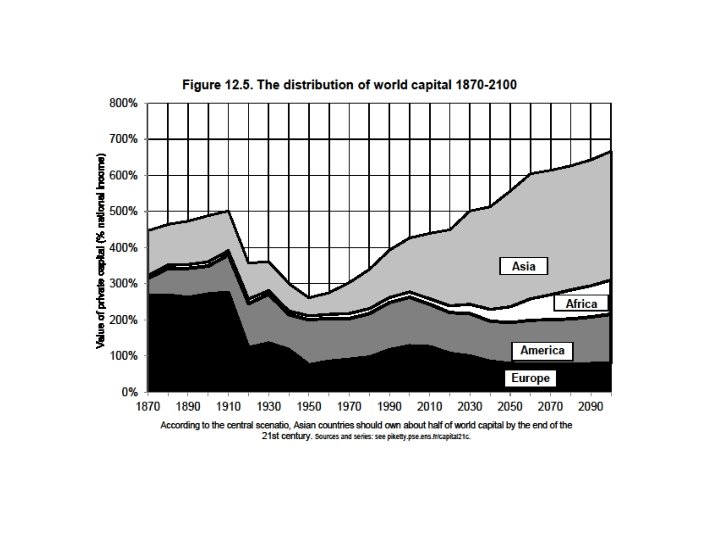
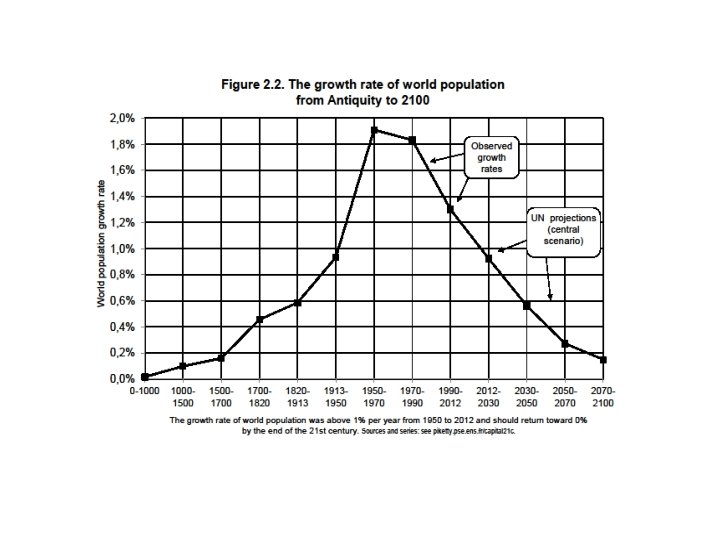
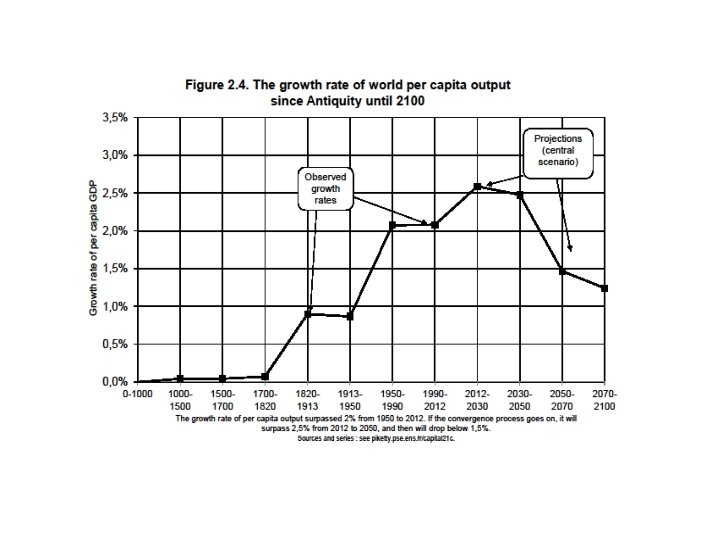
• The simplest way to think about this is the following: in the long-run, β=s/g with s = (net-of-depreciation) saving rate and g = economy’s growth rate (population + productivity) With s=10%, g=3%, β≈300%; but if s=10%, g=1, 5%, β≈600% = in slow-growth societies, the total stock of wealth accumulated in the past can naturally be very important → capital is back because low growth is back (in particular because population growth↓ 0) → in the long run, this can be relevant for the entire planet Note: β=s/g = pure stock-flow accounting identity; it is true whatever the combination of saving motives
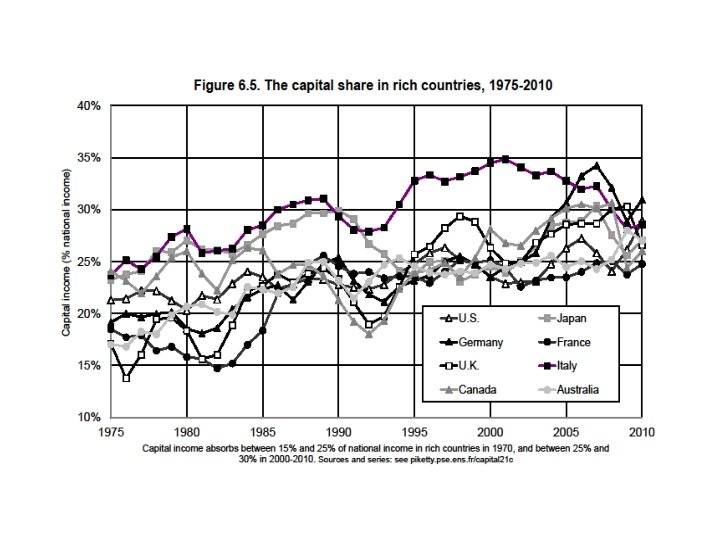
• Will the rise of capital income-ratio β also lead to a rise of the capital share α in national income? • If the capital stock equals β=6 years of income and the average return to capital is equal r=5% per year, then the share of capital income (rent, dividends, interest, profits, etc. ) in national income equals α = r x β = 30% • Technically, whether a rise in β also leads to a rise in capital share α = r β depends on the elasticity of substitution σ between capital K and labor L in the production function Y=F(K, L) • Intuition: σ measures the extent to which workers can be replaced by machines (e. g. Amazon’s drones) • Standard assumption: Cobb-Douglas production function (σ=1) = as the stock β↑, the return r↓ exactly in the same proportions, so that α = r x β remains unchanged, like by magic = a stable world where the capital-labor split is entirely set by technology • But if σ>1, then the return to capital r↓ falls less than the volume of capital β↑, so that the product α = r x β ↑ • Exactly what happened since the 1970 s-80 s: both the ratio β and the capital share α have increased
• With a large rise in β, one can get large rise in α with a production function F(K, L) that is just a little bit more substituable than in the standard Cobb-Douglas model (say if σ=1, 5 instead of 1) • Maybe it is natural to expect σ↑over the course of history: more and more diversified uses for capital; extreme case: pure robot-economy (σ=infinity) • Less extreme case: there are many possible uses for capital (machines can replace cashiers, drones can replace Amazon’s delivery workers, etc. ), so that the capital share α↑ continuously; there’s no natural corrective mechanism for this • The rise of β and α can be a good thing (we could all devote more time to culture, education, health…, rather than to our own subsistance), assuming one can answer the following question: who owns the robots?
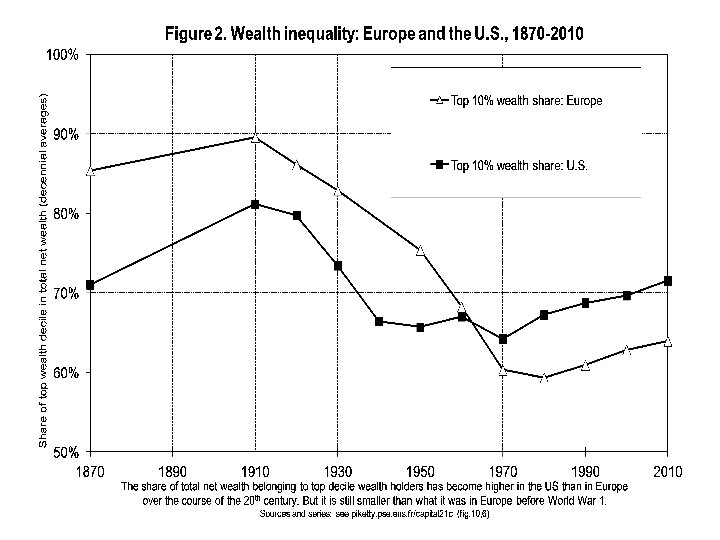
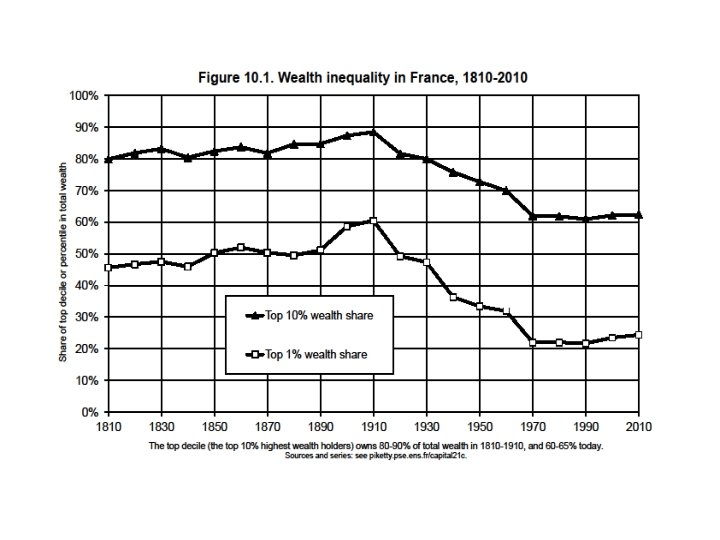
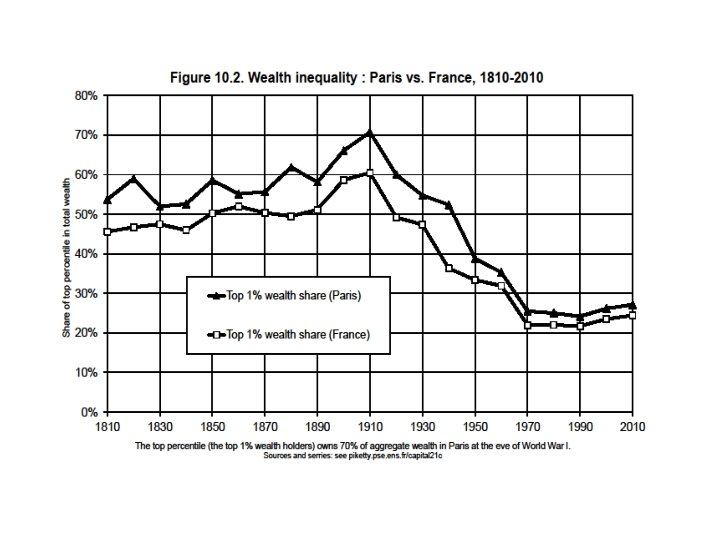
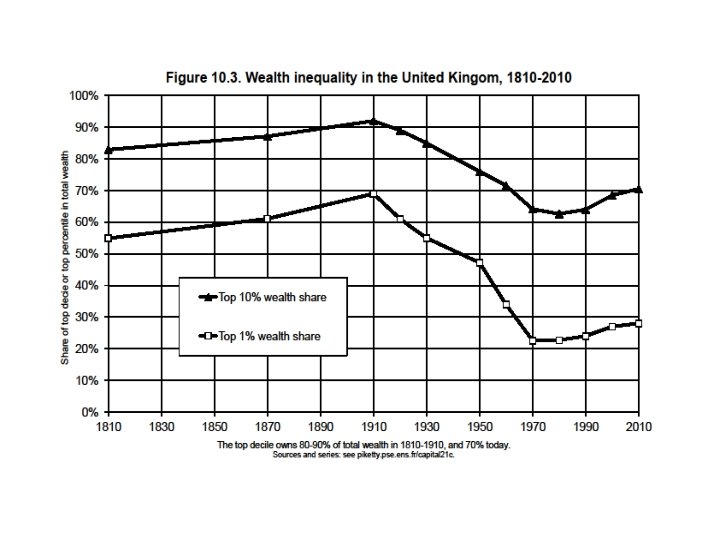
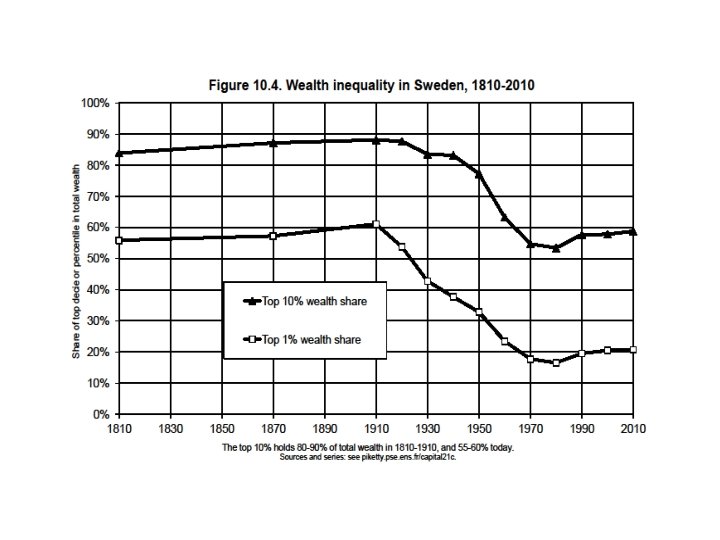
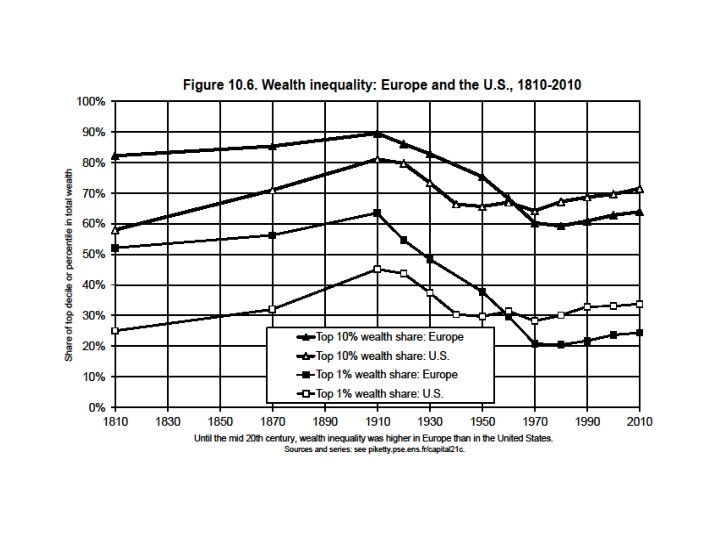
2. The future of wealth concentration • In all European countries (UK, France, Sweden…), wealth concentration was extremely high in 18 c-19 c & until WW 1: about 90% of aggregate wealth for top 10% wealth holders about 60% of aggregate wealth for top 1% wealth-holders = the classic patrimonial (wealth-based) society: a minority lives off its wealth, while the rest of the populaton works (Austen, Balzac) • Today wealth concentration is still very high, but less extreme: about 60 -70% for top 10%; about 20 -30% for top 1% the bottom 50% still owns almost nothing (<5%) but the middle 40% now owns 20 -30% of aggregate wealth = the rise of a patrimonial middle class • How did it happen, and will it last? Will the patrimonial middle class expend, or will it shrink?
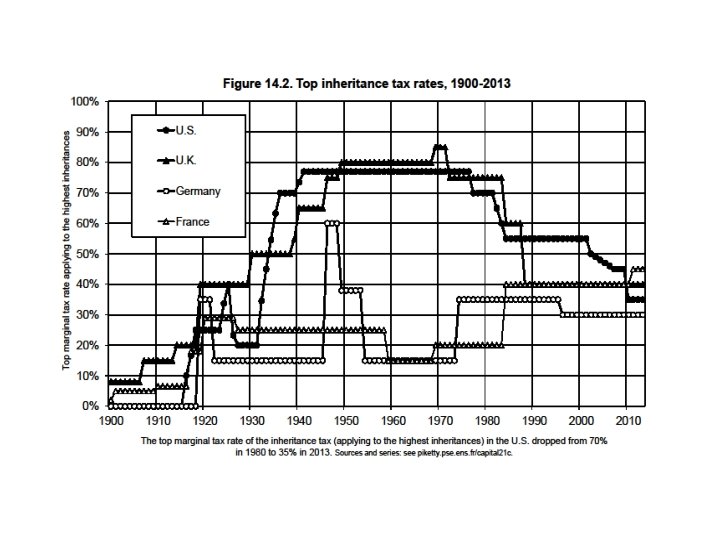
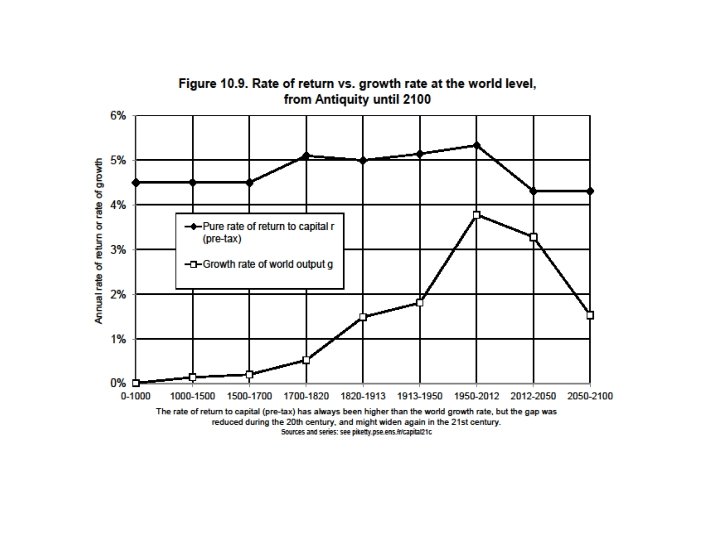
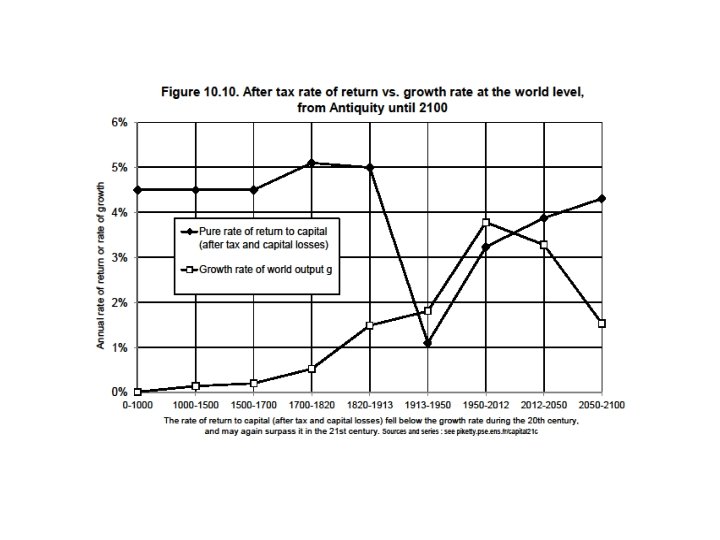
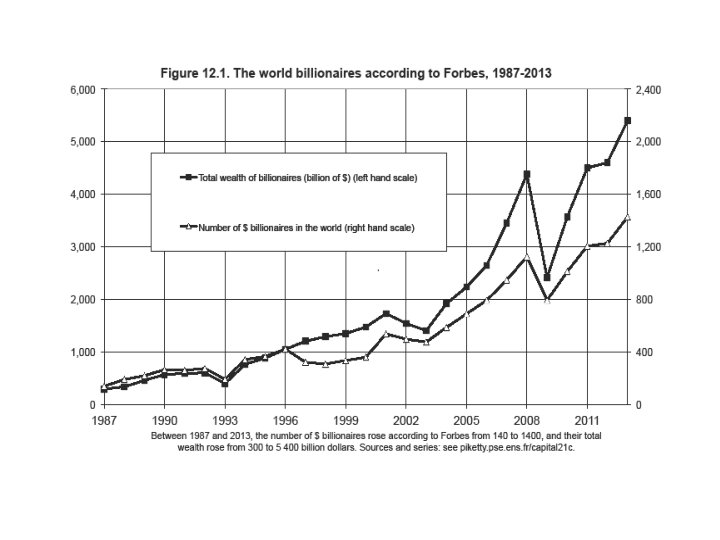
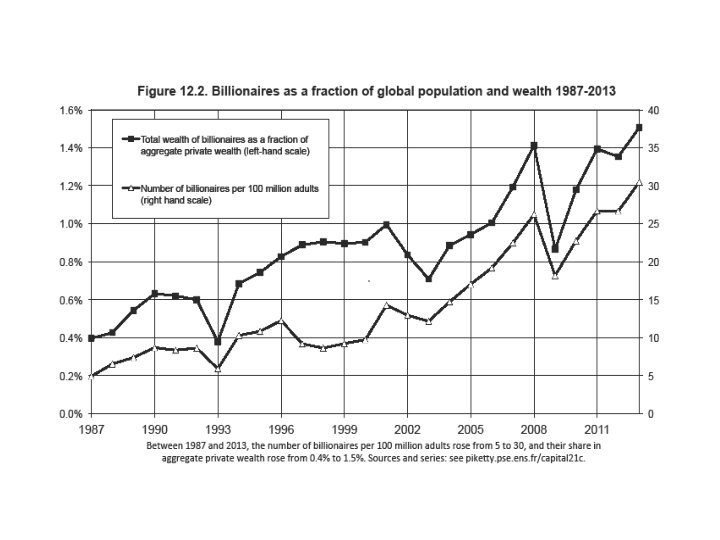
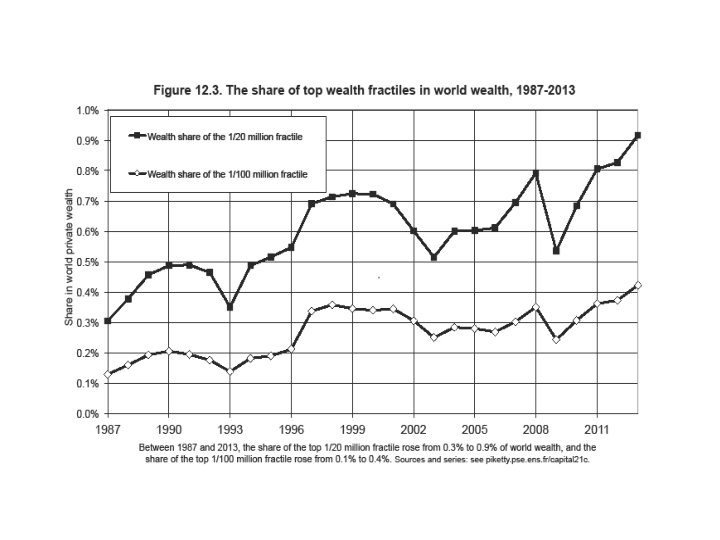
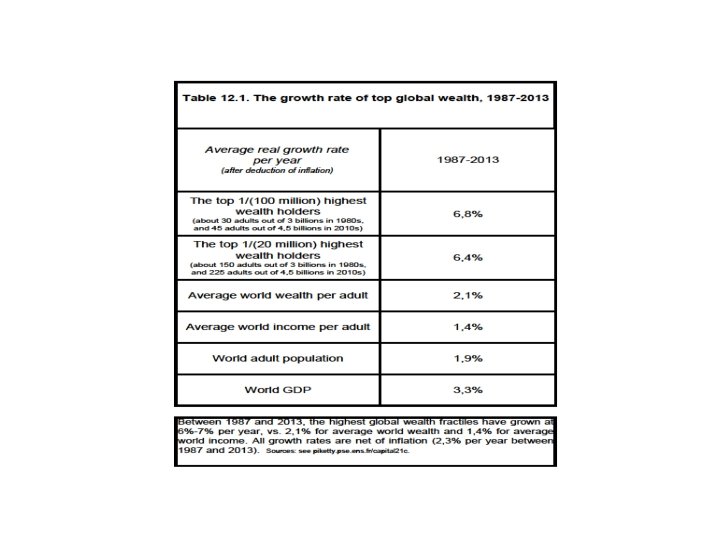
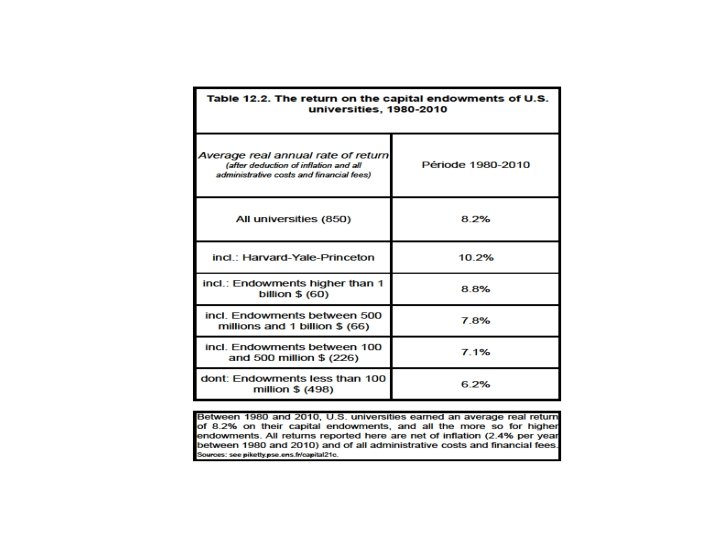
• Key finding: there was no decline in wealth concentration prior to World War shocks; was it just due to shocks? • Q. : Apart from shocks, what forces determine the long-run level of wealth concentration? • A. : In any dynamic, multiplicative wealth accumulation model with random individual shocks (tastes, demographic, returns, wages, . . ), the steady-state level of wealth concentration is an increasing function of r - g (with r = net-of-tax rate of return and g = growth rate) • With growth slowdown and rising tax competition to attract capital, r - g might well rise in the 21 c → back to 19 c levels • Future values of r also depend on technology (σ>1? ) • Under plausible assumptions, wealth concentration might reach or surpass 19 c record levels: see global wealth rankings
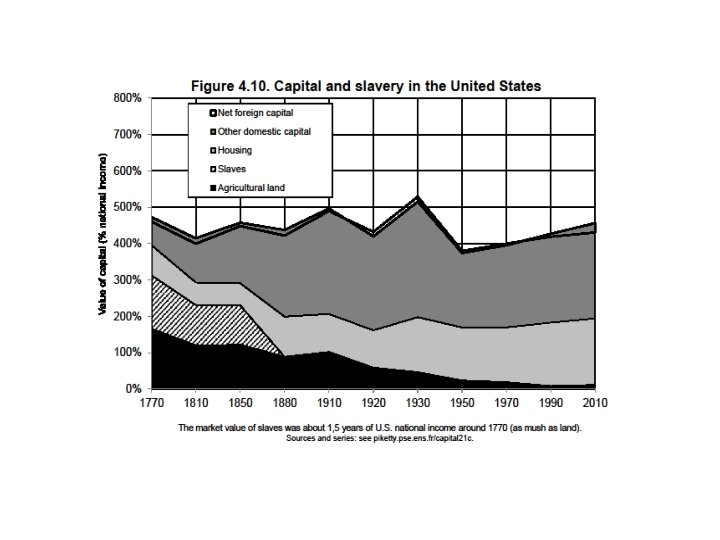
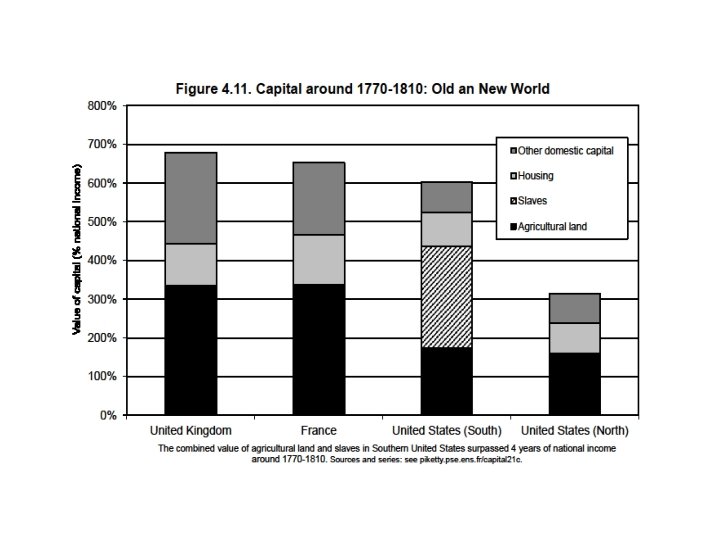
3. Inequality in America ( « meritocratic extremism » ) • Inequality in America = a different structure as in Europe: more egalitarian in some ways, more inegalitarian in some other dimensions • The New World in the 19 th century: the land of opportunity (capital accumulated in the past mattered much less than in Europe; perpetual demographic growth as a way to reduce the level of inherited wealth and wealth concentration)… and also the land of slavery • Northern US were in many ways more egalitarian than Old Europe; but Southern US were more inegalitarian • We still have the same ambiguous relationship of America with inequality today: in some ways more merit-based; in other ways more violent (prisons)
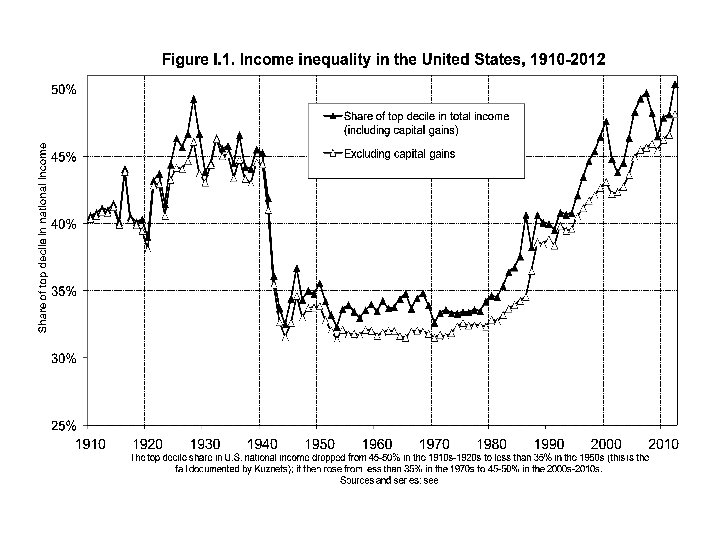
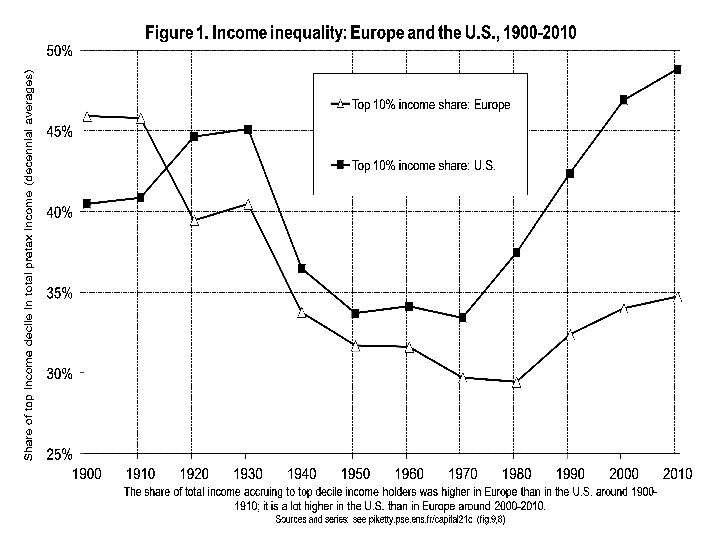
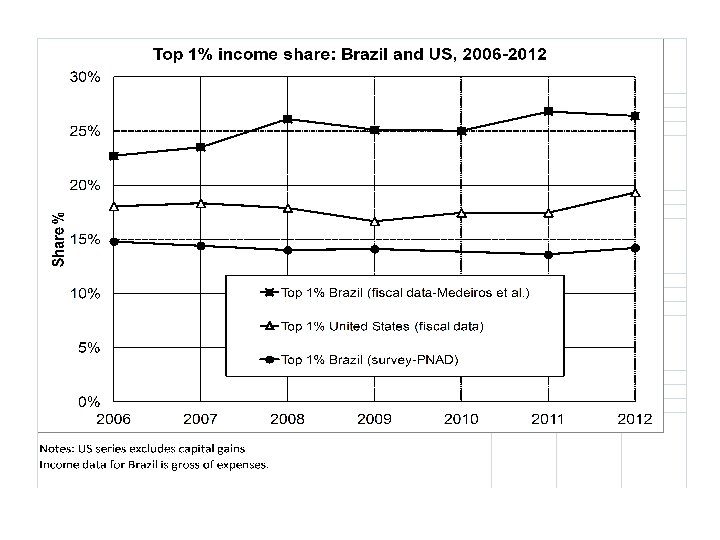
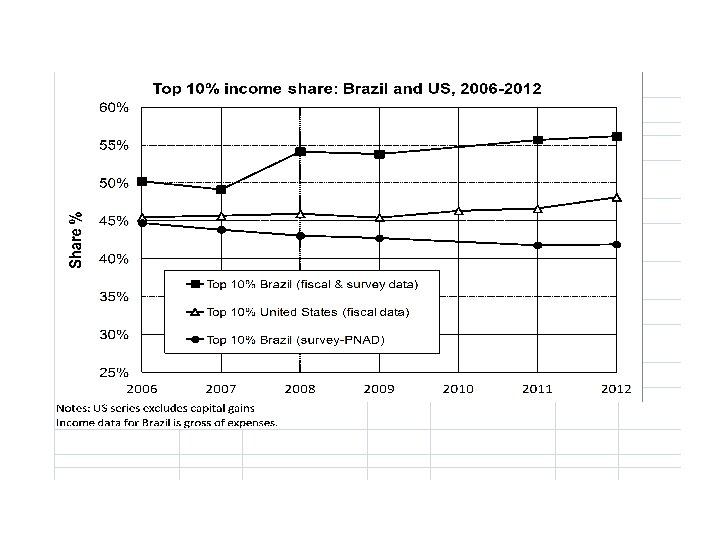
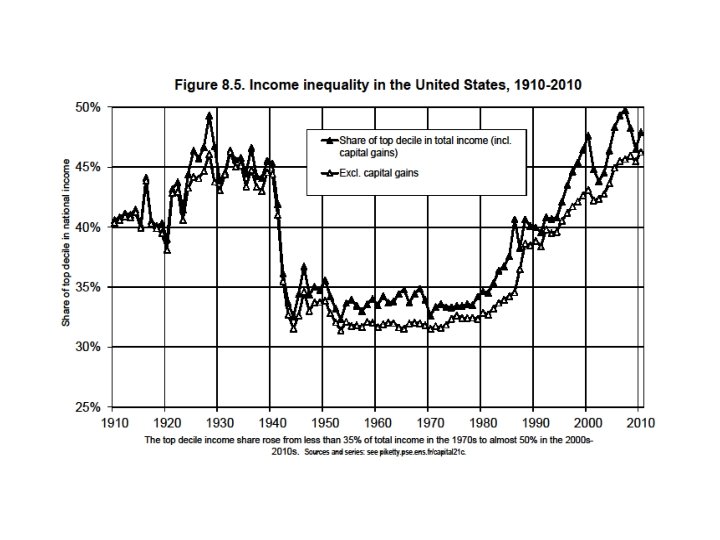
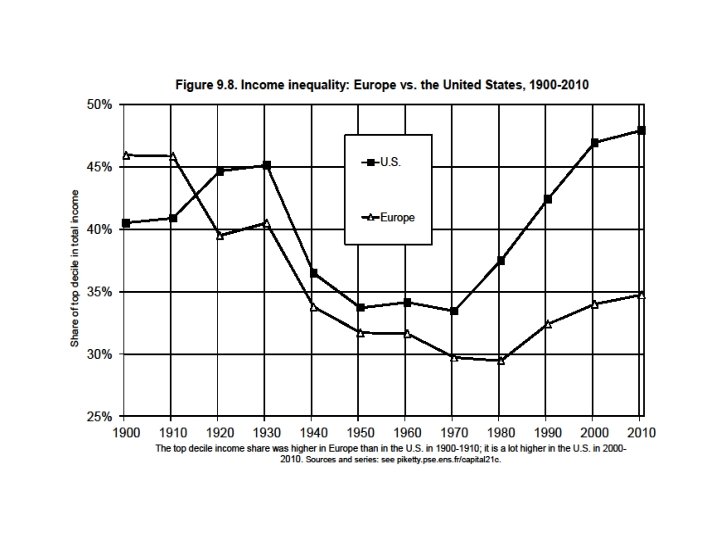
• The US distribution of income has become more unequal than in Europe over the course of the 20 th century; it is now as unequal as pre-WW 1 Europe • But the structure of inequality is different: US 2013 has less wealth inequality than Europe 1913, but higher inequality of labor income
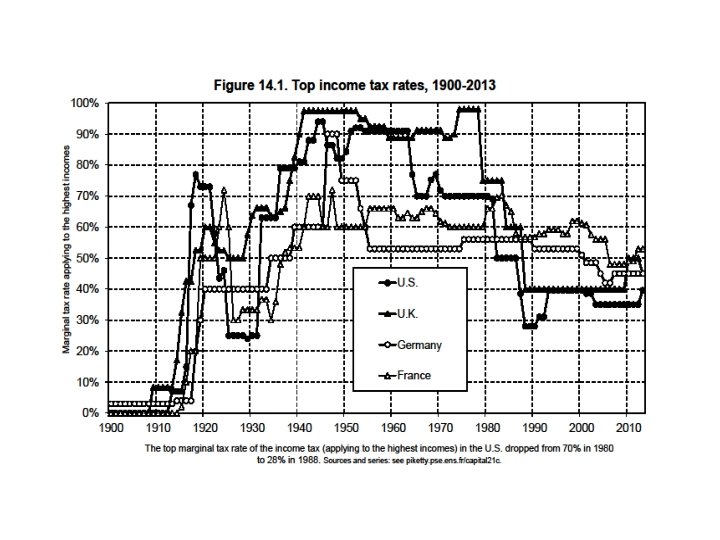
• Higher inequality of labor income in the US could reflect higher inequality in education investment; but it also reflects a huge rise of top executive compensation that it very hard to explain with education and productivity reasonning alone • In the US, this is sometime described as more merit-based: the rise of top labor incomes makes it possible to become rich with no inheritance (≈Napoleonic prefets) • Pb = this can be the worst of all worlds for those who are neither top income earners nor top successors: they are poor, and they are depicted as dump & undeserving (at least, nobody was trying to depict Ancien Regime inequality as fair) • It is unclear whether rise of top incomes has a lot to do with merit or productivity: sharp decline in top tax rates & rise of CEO bargaining power are more convincing explanations; chaotic US history of social norms regarding inequality
Conclusions • The history of income and wealth inequality is always political, chaotic and unpredictable; it involves national identities and sharp reversals; nobody can predict the reversals of the future • Marx: with g=0, β↑∞, r→ 0 : revolution, war • My conclusions are less apocalyptic: with g>0, at least we have a steady-state β=s/g • But with g>0 & small, this steady-state can be rather gloomy: it can involve a very large capital-income ratio β and capital share α, as well as extreme wealth concentration due to high r-g • This has nothing to do with a market imperfection: the more perfect the capital market, the higher r-g • The ideal solution: progressive wealth tax at the global scale, based upon automatic exchange of bank information • Other solutions involve authoritarian political & capital controls (China, Russia. . ), or perpetual population growth (US), or inflation, or some mixture of all