
Capacity I is the upper limit on the



- Slides: 29
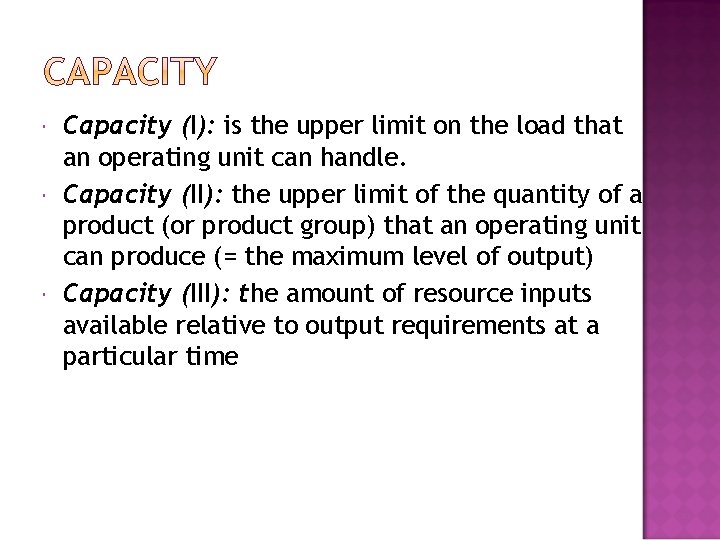
Capacity (I): is the upper limit on the load that an operating unit can handle. Capacity (II): the upper limit of the quantity of a product (or product group) that an operating unit can produce (= the maximum level of output) Capacity (III): the amount of resource inputs available relative to output requirements at a particular time
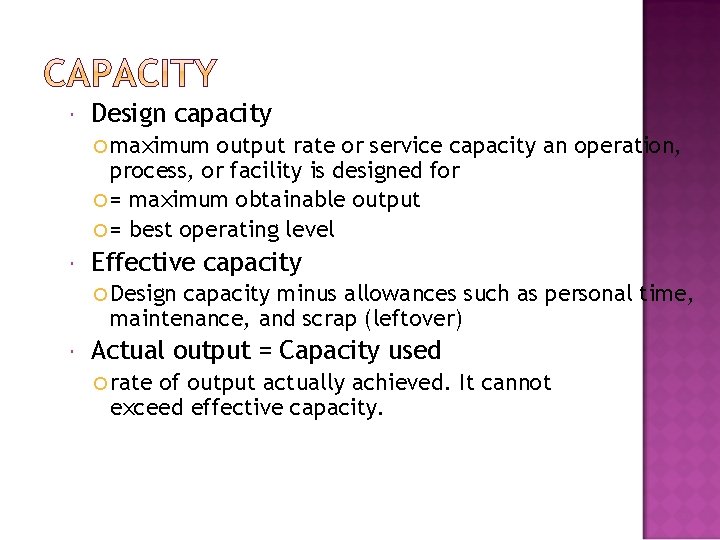
Design capacity maximum output rate or service capacity an operation, process, or facility is designed for = maximum obtainable output = best operating level Effective capacity Design capacity minus allowances such as personal time, maintenance, and scrap (leftover) Actual output = Capacity used rate of output actually achieved. It cannot exceed effective capacity.
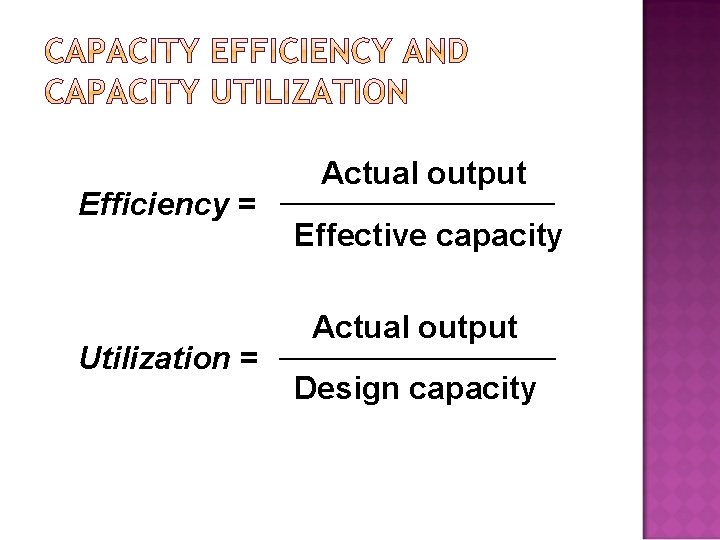
Efficiency = Utilization = Actual output Effective capacity Actual output Design capacity
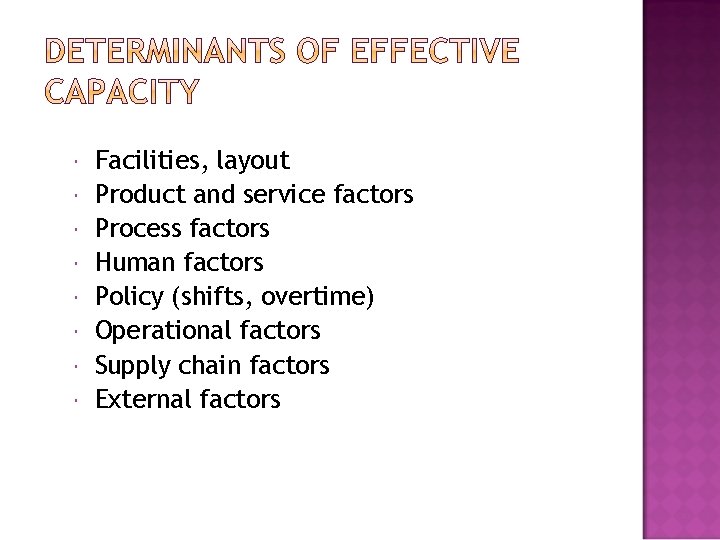
Facilities, layout Product and service factors Process factors Human factors Policy (shifts, overtime) Operational factors Supply chain factors External factors
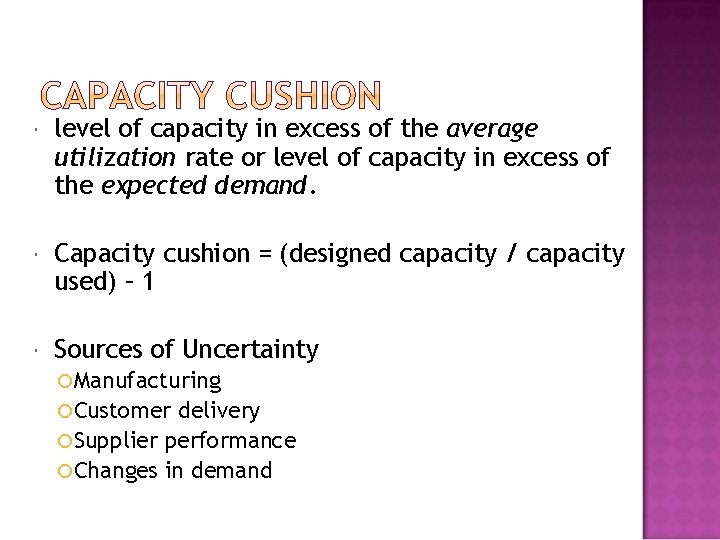
level of capacity in excess of the average utilization rate or level of capacity in excess of the expected demand. Capacity cushion = (designed capacity / capacity used) – 1 Sources of Uncertainty Manufacturing Customer delivery Supplier performance Changes in demand
1. Available capacity 2. Expertise 3. Quality considerations 4. Nature of demand 5. Cost 6. Risk
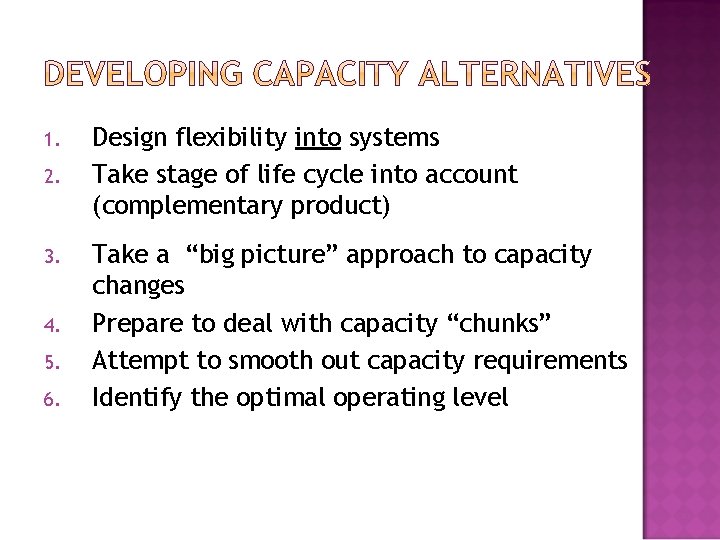
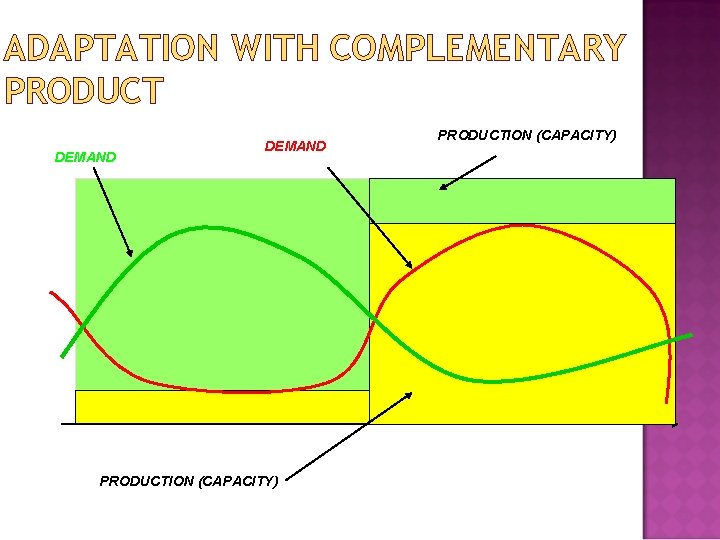
1. 2. 3. 4. 5. 6. Design flexibility into systems Take stage of life cycle into account (complementary product) Take a “big picture” approach to capacity changes Prepare to deal with capacity “chunks” Attempt to smooth out capacity requirements Identify the optimal operating level
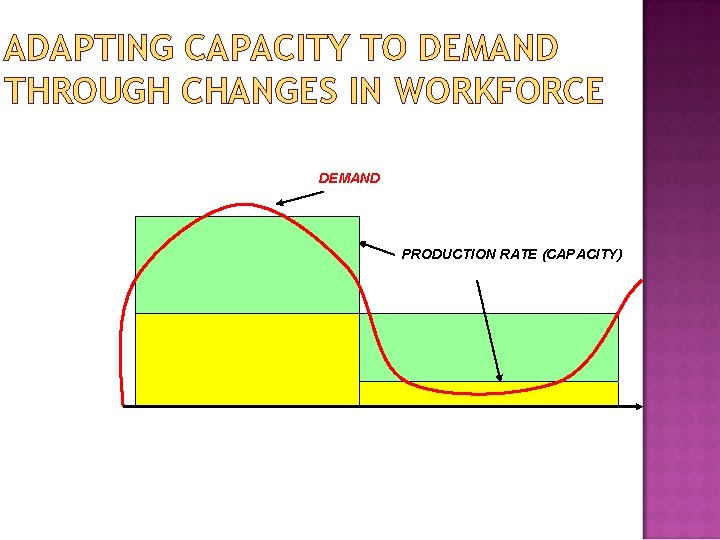
ADAPTING CAPACITY TO DEMAND THROUGH CHANGES IN WORKFORCE DEMAND PRODUCTION RATE (CAPACITY)
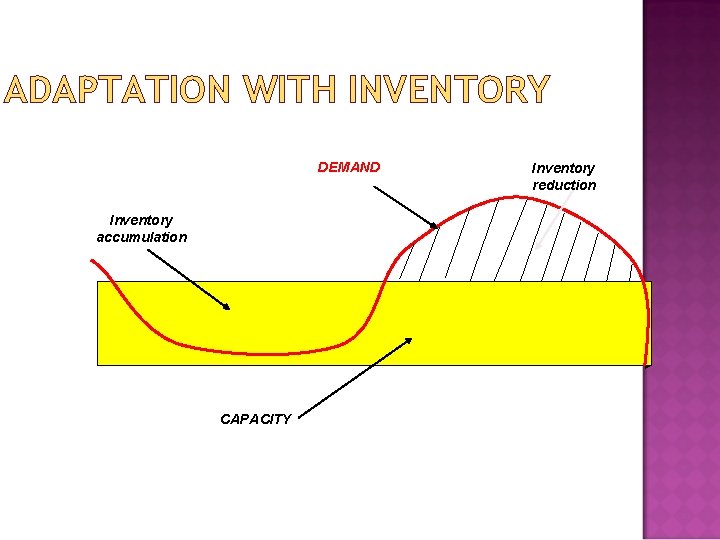
ADAPTATION WITH INVENTORY DEMAND Inventory accumulation CAPACITY Inventory reduction
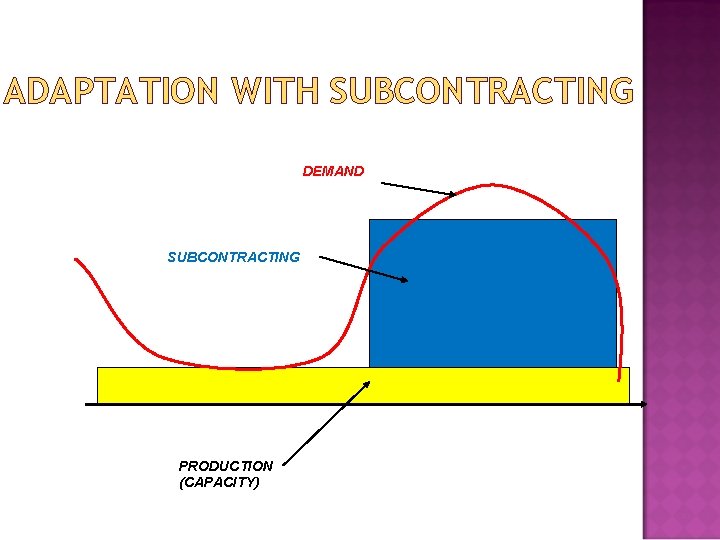
ADAPTATION WITH SUBCONTRACTING DEMAND SUBCONTRACTING PRODUCTION (CAPACITY)
ADAPTATION WITH COMPLEMENTARY PRODUCT DEMAND PRODUCTION (CAPACITY)
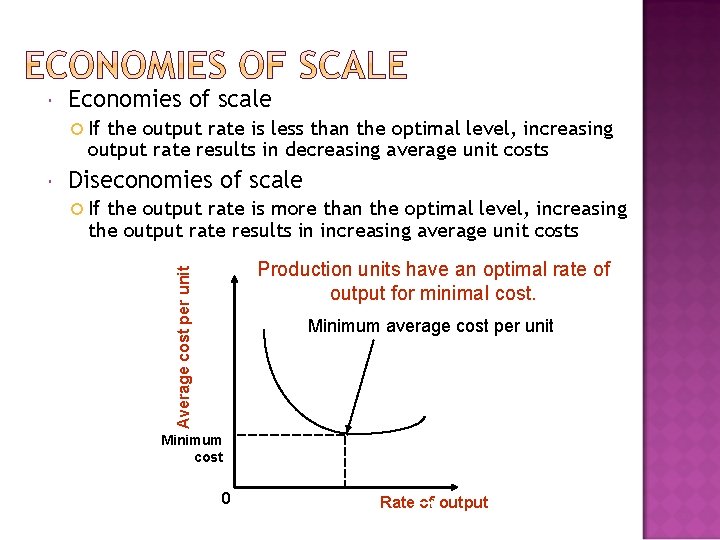
Economies of scale If the output rate is less than the optimal level, increasing output rate results in decreasing average unit costs Diseconomies of scale If the output rate is more than the optimal level, increasing the output rate results in increasing average unit costs Production units have an optimal rate of output for minimal cost. Average cost per unit Minimum average cost per unit Minimum cost 0 Rate of output
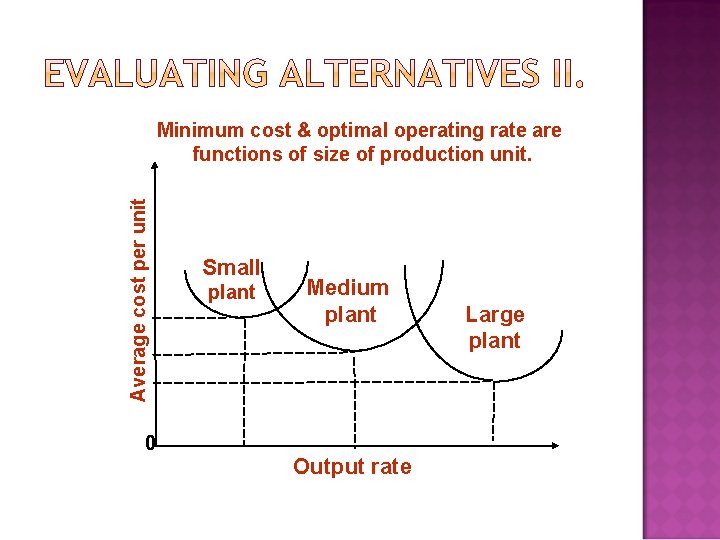
Average cost per unit Minimum cost & optimal operating rate are functions of size of production unit. 0 Small plant Medium plant Output rate Large plant
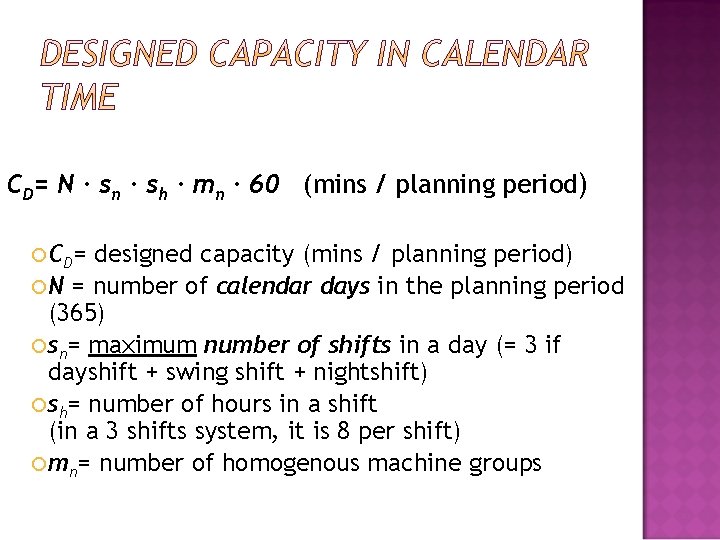
CD= N ∙ sn ∙ sh ∙ mn ∙ 60 (mins / planning period) C D = designed capacity (mins / planning period) N = number of calendar days in the planning period (365) sn= maximum number of shifts in a day (= 3 if dayshift + swing shift + nightshift) sh= number of hours in a shift (in a 3 shifts system, it is 8 per shift) mn= number of homogenous machine groups
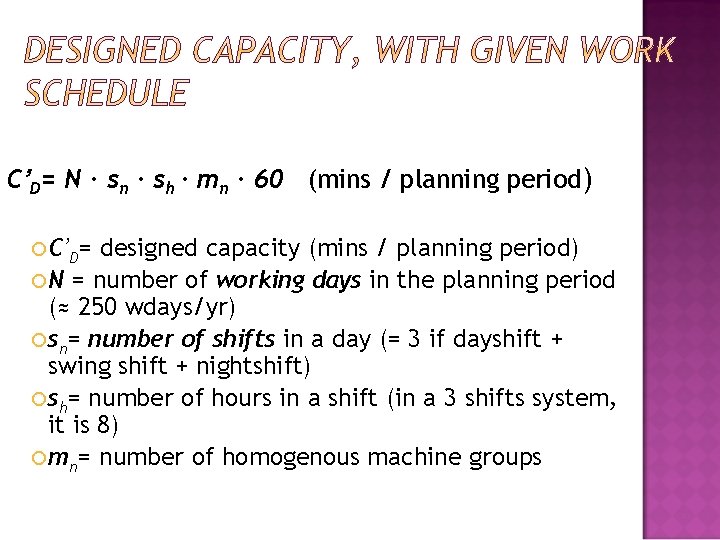
C’D= N ∙ sn ∙ sh ∙ mn ∙ 60 (mins / planning period) C’D= designed capacity (mins / planning period) N = number of working days in the planning period (≈ 250 wdays/yr) sn= number of shifts in a day (= 3 if dayshift + swing shift + nightshift) sh= number of hours in a shift (in a 3 shifts system, it is 8) mn= number of homogenous machine groups
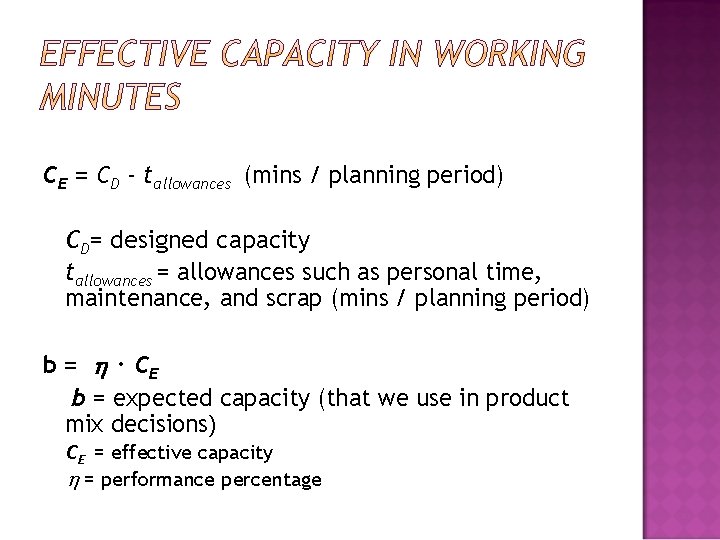
CE = CD - tallowances (mins / planning period) CD= designed capacity tallowances = allowances such as personal time, maintenance, and scrap (mins / planning period) b = ∙ CE b = expected capacity (that we use in product mix decisions) CE = effective capacity = performance percentage
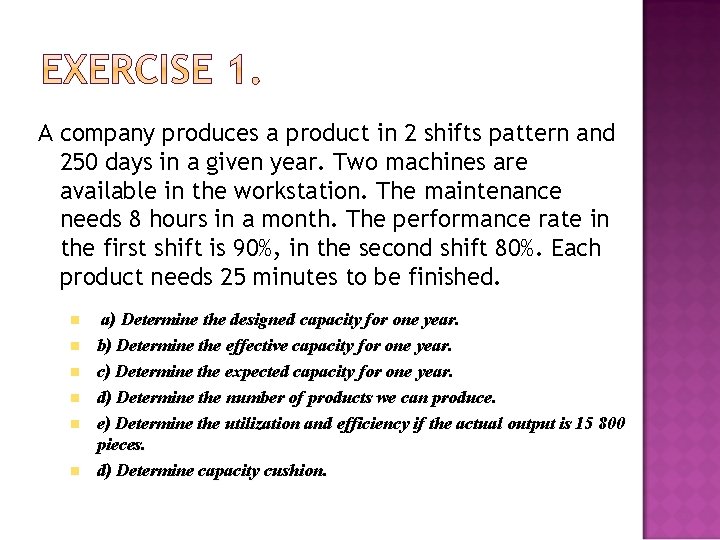
A company produces a product in 2 shifts pattern and 250 days in a given year. Two machines are available in the workstation. The maintenance needs 8 hours in a month. The performance rate in the first shift is 90%, in the second shift 80%. Each product needs 25 minutes to be finished. n n n a) Determine the designed capacity for one year. b) Determine the effective capacity for one year. c) Determine the expected capacity for one year. d) Determine the number of products we can produce. e) Determine the utilization and efficiency if the actual output is 15 800 pieces. d) Determine capacity cushion.
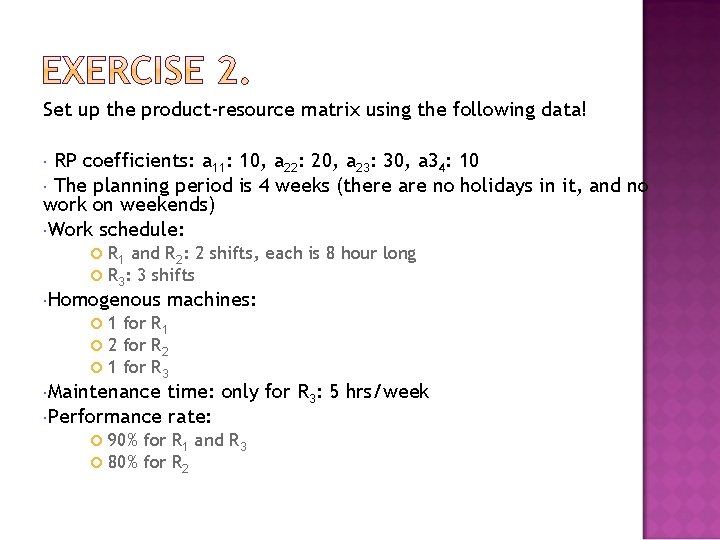
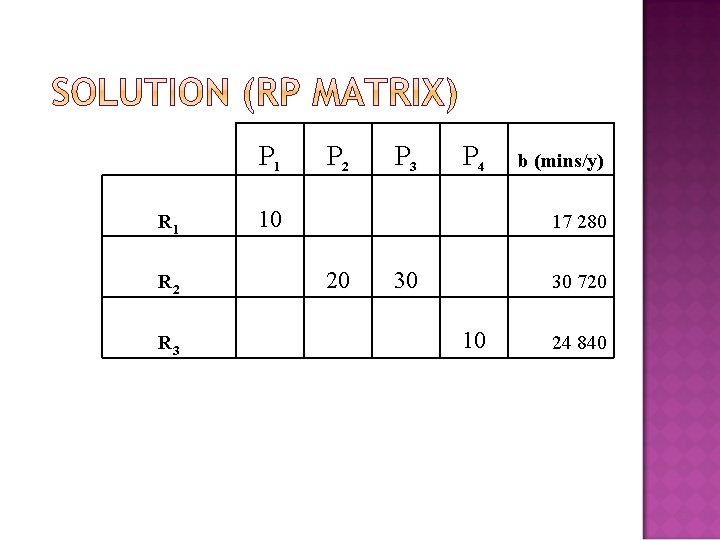
Set up the product-resource matrix using the following data! RP coefficients: a 11: 10, a 22: 20, a 23: 30, a 34: 10 The planning period is 4 weeks (there are no holidays in it, and no work on weekends) Work schedule: R 1 and R 2: 2 shifts, each is 8 hour long R 3: 3 shifts Homogenous machines: 1 for R 1 2 for R 2 1 for R 3 Maintenance time: only for R 3: 5 hrs/week Performance rate: 90% for R 1 and R 3 80% for R 2
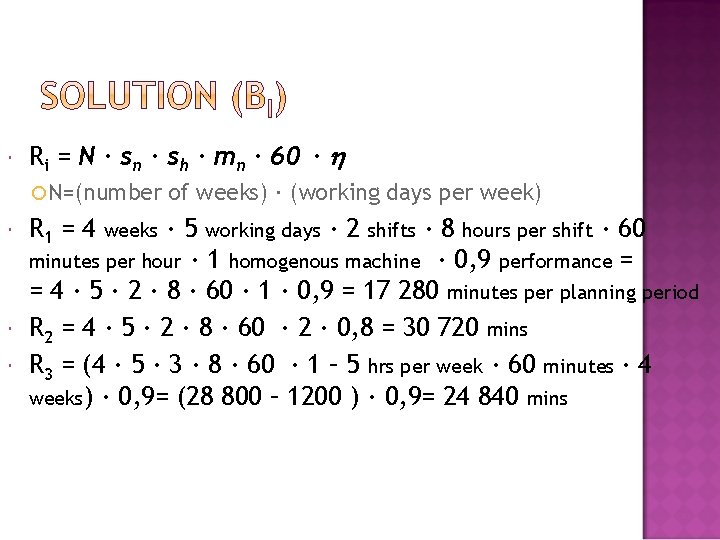
Ri = N ∙ sn ∙ sh ∙ mn ∙ 60 ∙ N=(number R 1 = 4 of weeks) ∙ (working days per week) ∙ 5 working days ∙ 2 shifts ∙ 8 hours per shift ∙ 60 minutes per hour ∙ 1 homogenous machine ∙ 0, 9 performance = = 4 ∙ 5 ∙ 2 ∙ 8 ∙ 60 ∙ 1 ∙ 0, 9 = 17 280 minutes per planning period R 2 = 4 ∙ 5 ∙ 2 ∙ 8 ∙ 60 ∙ 2 ∙ 0, 8 = 30 720 mins R 3 = (4 ∙ 5 ∙ 3 ∙ 8 ∙ 60 ∙ 1 – 5 hrs per week ∙ 60 minutes ∙ 4 weeks) ∙ 0, 9= (28 800 – 1200 ) ∙ 0, 9= 24 840 mins weeks
P 1 R 1 10 R 2 R 3 P 2 P 3 P 4 b (mins/y) 17 280 20 30 30 720 10 24 840
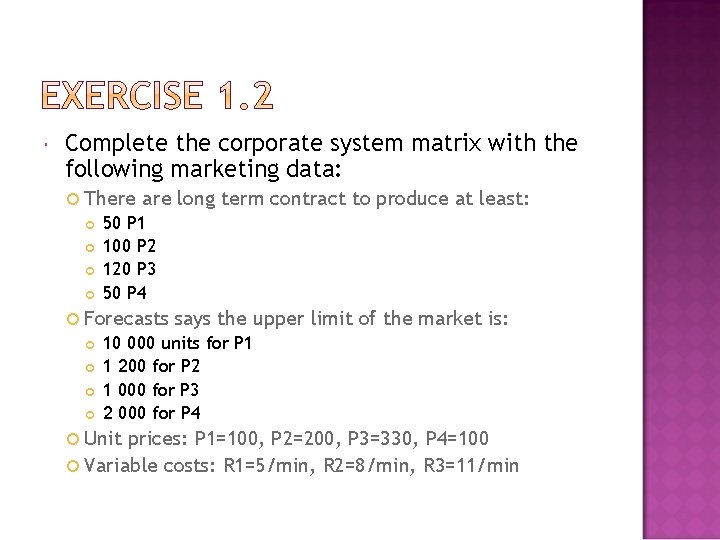
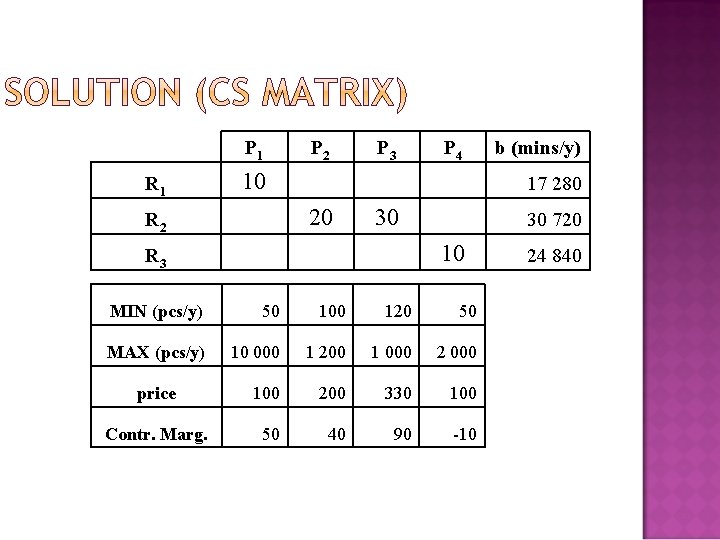
Complete the corporate system matrix with the following marketing data: There are long term contract to produce at least: 50 P 1 100 P 2 120 P 3 50 P 4 Forecasts says the upper limit of the market is: 10 000 units for P 1 1 200 for P 2 1 000 for P 3 2 000 for P 4 Unit prices: P 1=100, P 2=200, P 3=330, P 4=100 Variable costs: R 1=5/min, R 2=8/min, R 3=11/min
P 1 R 1 10 P 2 P 4 b (mins/y) 17 280 20 R 2 P 3 30 30 720 10 R 3 MIN (pcs/y) 50 100 120 50 MAX (pcs/y) 10 000 1 200 1 000 2 000 price 100 200 330 100 Contr. Marg. 50 40 90 -10 24 840
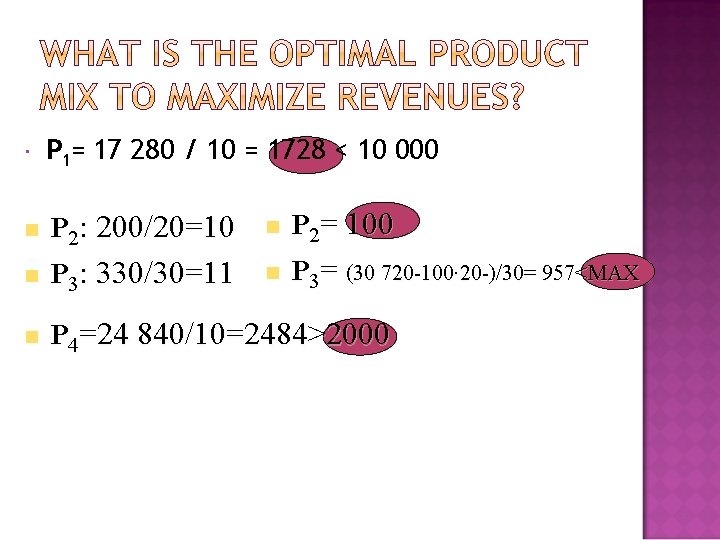
P 1= 17 280 / 10 = 1728 < 10 000 n P 2: 200/20=10 n P 2= 100 n P 3: 330/30=11 n P 3= (30 720 -100∙ 20 -)/30= 957<MAX n P 4=24 840/10=2484>2000
The only difference is in P 4 because of its negative contribution margin. P 4=50
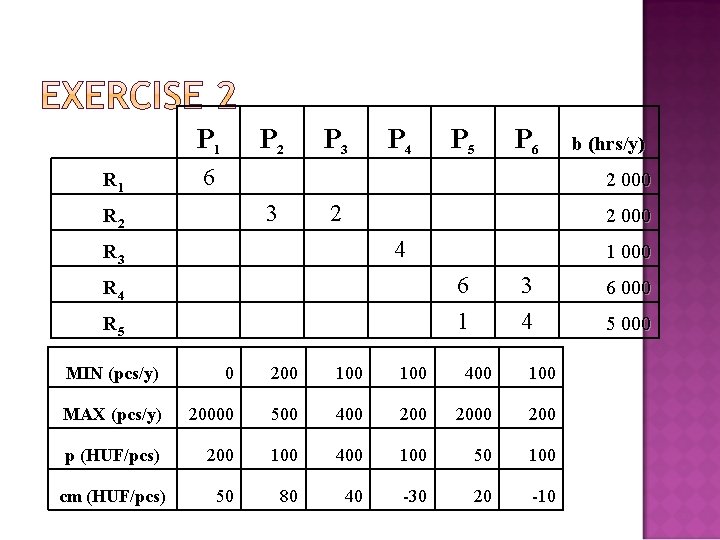
P 1 P 2 P 3 P 4 P 5 P 6 R 1 6 3 2 000 4 6 1 3 4 1 000 R 2 R 3 R 4 R 5 b (hrs/y) 2 000 MIN (pcs/y) 0 200 100 400 100 MAX (pcs/y) 20000 500 400 2000 200 p (HUF/pcs) 200 100 400 100 50 100 cm (HUF/pcs) 50 80 40 -30 20 -10 6 000 5 000
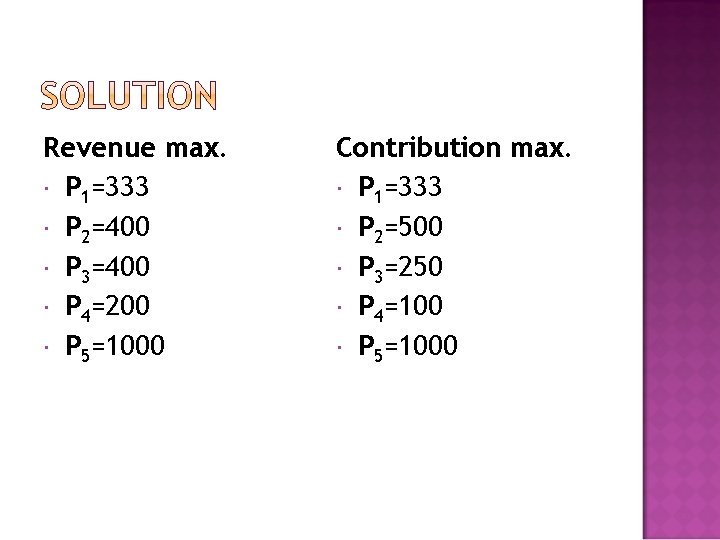
Revenue max. P 1=333 P 2=400 P 3=400 P 4=200 P 5=1000 Contribution max. P 1=333 P 2=500 P 3=250 P 4=100 P 5=1000