Cancer Surveillance data of Rare Epithelial Breast cancers

Cancer Surveillance data of Rare Epithelial Breast cancers in females-A Report from Population Based Cancer Registries in India. Dr Shakuntala TS, Dr Meesha Chaturvedi, Sathish Kumar K, Priyanka Das, Sudarshan KL, Teena Sajan, Vinodh Nallasamy, Anish John and Dr Prashant Mathur

Background • Rare Breast cancer is a divergent group of diseases which presents with varied clinical presentations, morphological characteristics and clinical management. • This study aims to identify the various rare breast tumors based on morphological characteristics through the Population Based Registries and Hospital Based Registries for the period of 1982 -2014 in India. • This will help in classifying them according to their relevant features regarding rare cancers.
 and Hospital Based")
Methods • The data from five Population Based Cancer Registries (PBCRs) and Hospital Based Registries(HBCRs) under National Cancer Registry Programme (NCRP) in India was used to identify the rare epithelial tumors based on the morphological subtypes. • The analysis was done for a collective period of 1982 -2014 from the following PBCRs- Bangalore (1982 -2012), Bhopal (1988 -2013), Chennai (1982 -2013), Mumbai (19822012) and Delhi (1988 -2012) and the various HBCRs, data was stratified based on morphologies, using the codes from International Classification of Diseases for Oncology, 3 rd Edition (ICD-O-3). • The Crude Rate and Age Adjusted Incidence Rates (AAR per 1, 000 population) was calculated using in-house developed PBCRDM 2. 1 software. • The HBCR Data was analyzed to determine the correlation between the Clinical Extent of the Disease and the Treatment Patterns that are Followed respectively.

Data from 5 PBCRs registered under NCRPNCDIR was analyzed for the period of 19822014 Incidence of <6 per year per lakh population was identified and the selected PHMs for the 4 Major types of Breast tumors was used for further analysis CR & AAR was Calculated for the 4 Major types of Breast tumors and for the respective registries • • • Bangalore (1982 -2012) Bhopal (1988 -2013) Chennai (1982 -2013) Mumbai (1982 -2012) Delhi (1988 -2012) Rare tumors of Breast: • Mammary Pagets • Special types of Adenocarcinoma • Metaplastic Carcinoma • Salivary Gland Type Tumors of Breast

Data from various HBCRs registered under NCRP-NCDIR was analyzed for the period of 1982 -2014 Incidence of <6 per year per lakh population was identified and the selected PHMs for the 4 Major types of Breast tumors was used for further analysis Proportion for Clinical Extent of the disease and Treatment Patterns Followed were compared Rare tumors of Breast: • Mammary Pagets • Special types of Adenocarcinoma • Metaplastic Carcinoma • Salivary Gland Type Tumors of Breast

Results 1. Mammary Paget’s disease of breast Morphology Code Description 8540 8541 Paget disease, mammary Paget disease of breast Paget disease and infiltrating duct carcinoma of breast 8543 Paget disease and intraductal carcinoma of breast

1. Mammary Paget’s disease of breast Age Group 0 -4 5 -9 10 -14 15 -19 20 -24 25 -29 30 -34 35 -39 40 -44 45 -49 50 -54 55 -59 60 -64 65 -69 70 -74 75+ Unk. Total Numbers 0 0 1 6 9 15 15 31 31 33 31 32 10 17 Population 29104170 31743089 32366412 31603553 35525375 35137553 27705195 25760300 19306697 16812869 12916895 9713700 8738503 5874518 4143632 4954811 ASPR 0. 0000 0. 0028 0. 0171 0. 0325 0. 0582 0. 0777 0. 1844 0. 2400 0. 3397 0. 3548 0. 5447 0. 2413 0. 3431 231 331407272 AAR 0. 0697 0. 090568024

2. Special types of adenocarcinoma of breast Morphology Code 8050 8201 8211 8260 8290 8314 8315 8401 8480 8481 8502 8510 Description Papillary carcinoma, NOS Ductal carcinoma, cribriform type Tubular adenocarcinoma Papillary adenocarcinoma, NOS Oxyphilic adenocarcinoma Lipid-rich carcinoma Glycogen-rich carcinoma Apocrine adenocarcinoma Mucinous adenocarcinoma Mucin-producing adenocarcinoma Secretory carcinoma of breast Juvenile carcinoma of breast Medullary carcinoma, NOS

2. Special types of Adenocarcinomas Age Group Numbers 0 -4 0 5 -9 1 10 -14 0 15 -19 2 20 -24 19 25 -29 67 30 -34 134 35 -39 234 40 -44 273 45 -49 344 50 -54 294 55 -59 296 60 -64 330 65 -69 267 70 -74 225 75+ 254 Unk. Total 2740 Population 29104170 31743089 32366412 31603553 35525375 35137553 27705195 25760300 19306697 16812869 12916895 9713700 8738503 5874518 4143632 4954811 ASPR 0. 0000 0. 0032 0. 0000 0. 0063 0. 0535 0. 1907 0. 4837 0. 9084 1. 4140 2. 0461 2. 2761 3. 0472 3. 7764 4. 5451 5. 4300 5. 1263 331407272 AAR 0. 8268 1. 0457723512

3. Metaplastic carcinoma of breast Morphology Code 8070 8560 8571 8572 8575 Description Squamous cell carcinoma, NOS Adenosquamous carcinoma Mixed adenocarcinoma and squamous cell carcinoma Mixed adenocarcinoma and epidermoid carcinoma Adenocarcinoma with cartilaginous and osseous metaplasia Adenocarcinoma with spindle cell metaplasia Metaplastic carcinoma, NOS

3. Metaplastic carcinoma of breast Age Group 0 -4 5 -9 10 -14 15 -19 20 -24 25 -29 30 -34 35 -39 40 -44 45 -49 50 -54 55 -59 60 -64 65 -69 70 -74 75+ Unk. Total Numbers 0 0 2 11 18 26 36 39 44 27 30 28 12 19 Population 29104170 31743089 32366412 31603553 35525375 35137553 27705195 25760300 19306697 16812869 12916895 9713700 8738503 5874518 4143632 4954811 ASPR 0. 0000 0. 0056 0. 0313 0. 0650 0. 1009 0. 1865 0. 2320 0. 3406 0. 2780 0. 3433 0. 4766 0. 2896 0. 3835 292 331407272 AAR 0. 0881 0. 1076575621

4. Salivary gland type tumours of breast Morphology Code Description 8200 8430 8550 8982 Adenoid cystic carcinoma Mucoepidermoid carcinoma Acinar cell adenocarcinoma Myoepithelial carcinoma

4. Salivary gland type tumours of breast Age Group Numbers 0 -4 5 -9 10 -14 15 -19 20 -24 25 -29 30 -34 35 -39 40 -44 45 -49 50 -54 55 -59 60 -64 65 -69 70 -74 75+ Unk. Total Population ASPR 0 0 0 1 1 4 7 2 4 4 10 10 2 1 29104170 31743089 32366412 31603553 35525375 35137553 27705195 25760300 19306697 16812869 12916895 9713700 8738503 5874518 4143632 4954811 0. 0000 0. 0028 0. 0036 0. 0155 0. 0363 0. 0119 0. 0310 0. 0412 0. 1144 0. 1702 0. 0483 0. 0202 46 331407272 0. 0139 AAR 0. 0185138063

CR and AARs Sub - Types CR Paget’s 0. 7 Adenocarcinoma 0. 83 Carcinoma 0. 09 Salivary 0. 14 CR & AAR 0. 091 1. 05 0. 11 0. 02 Obs 231 2740 292 46 Proportion & Observed Numbers

PBCR Registry Data 1. Bangalore PBCR Age Group Numbers Population 0 -4 0 7007836 5 -9 0 7605369 10 -14 0 7614744 15 -19 0 7596681 20 -24 6 9029573 25 -29 24 9214839 30 -34 40 6731675 35 -39 70 6192218 40 -44 81 4285650 45 -49 110 3781722 50 -54 105 2906040 55 -59 90 2097118 60 -64 102 1982612 65 -69 76 1267956 70 -74 55 895195 75+ 57 1113469 Unk. Total 816 79322697 AAR ASPR 0. 0000 0. 0664 0. 2604 0. 5942 1. 1305 1. 8900 2. 9087 3. 6132 4. 2916 5. 1447 5. 9939 6. 1439 5. 1191 1. 0287 1. 38

2. Mumbai PBCR Age Group 0 -4 5 -9 10 -14 15 -19 20 -24 25 -29 30 -34 35 -39 40 -44 45 -49 50 -54 55 -59 60 -64 65 -69 70 -74 75+ Unk. Total Numbers Population ASPR 0 1 8 25 61 112 129 162 149 156 162 111 169 13505660 14685150 14992670 14175950 15768230 15585410 12821680 11895910 9182885 7954977 6091128 4576206 3943625 2734124 1880884 2261560 0. 0000 0. 0068 0. 0000 0. 0071 0. 0507 0. 1604 0. 4758 0. 9415 1. 4048 2. 0365 2. 4462 3. 4089 4. 2093 5. 9251 5. 9015 7. 4727 1412 152056049 0. 9286 AAR 1. 18199441298

3. Chennai PBCR Age Group Numbers Population ASPR 0 -4 0 5042722 0. 0000 5 -9 0 5555310 0. 0000 10 -14 0 5885709 0. 0000 15 -19 1 6132795 0. 0163 20 -24 5 6918905 0. 0723 25 -29 24 6814597 0. 3522 30 -34 35 5329578 0. 6567 35 -39 54 5110895 1. 0566 40 -44 55 3912970 1. 4056 45 -49 65 3472319 1. 8719 50 -54 57 2771621 2. 0566 55 -59 54 2160533 2. 4994 60 -64 54 1965780 2. 7470 65 -69 41 1318515 3. 1096 70 -74 33 965195 3. 4190 75+ 34 1120844 3. 0334 Unk. Total 512 64478288 0. 7941 AAR 0. 86989069879

4. Bhopal PBCR Age Group Numbers Population 0 -4 5 -9 10 -14 15 -19 20 -24 25 -29 30 -34 35 -39 40 -44 45 -49 50 -54 55 -59 60 -64 65 -69 70 -74 75+ Unk. Total ASPR 0 0 0 5 8 7 13 6 8 10 9 4 6 1813691 1990429 1982083 1898569 1957621 1811200 1451997 1318147 994565 828472 593305 454409 437418 286495 208046 238035 0. 0000 0. 3444 0. 6069 0. 7038 1. 5692 1. 0113 1. 7605 2. 2861 3. 1414 1. 9227 2. 5206 76 18264482 0. 4161 AAR 0. 58899403604

5. Delhi PBCR Age Group Numbers Population 0 -4 5 -9 10 -14 15 -19 20 -24 25 -29 30 -34 35 -39 40 -44 45 -49 50 -54 55 -59 60 -64 65 -69 70 -74 75+ Unk. Total ASPR 0 0 4 12 21 34 58 61 56 51 65 47 41 25 1734261 1906831 1891206 1799558 1851046 1711507 1370265 1243130 930627 775379 554801 425434 409068 267428 194312 220903 0. 0000 0. 2161 0. 7011 1. 5326 2. 7350 6. 2324 7. 8671 10. 0937 11. 9878 15. 8898 17. 5748 21. 1001 11. 3172 475 17285756 2. 7479 AAR 3. 97077911206

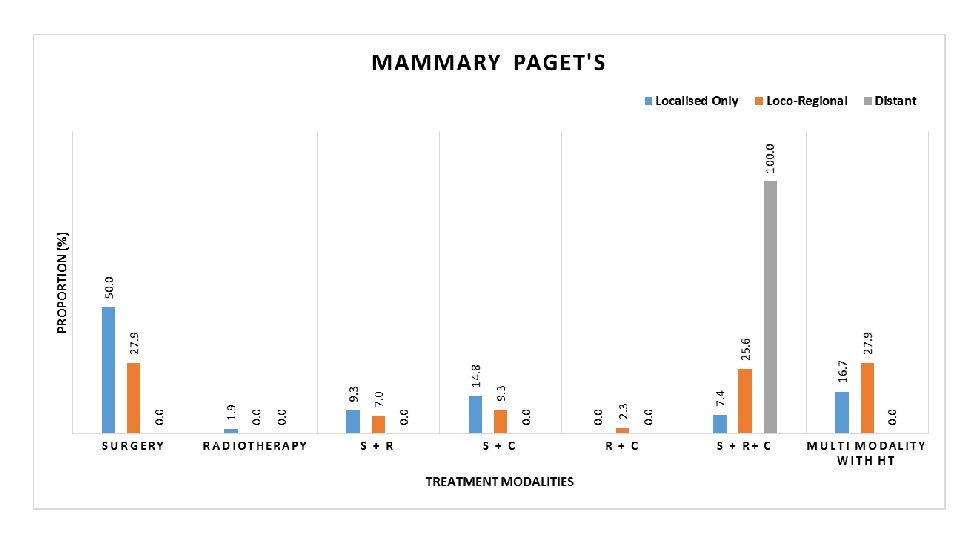
HBCRs Data- Comparison between Clinical Extent of Disease & Treatment 1. Mammary Paget’s

2. Special Types of Adenocarcinoma
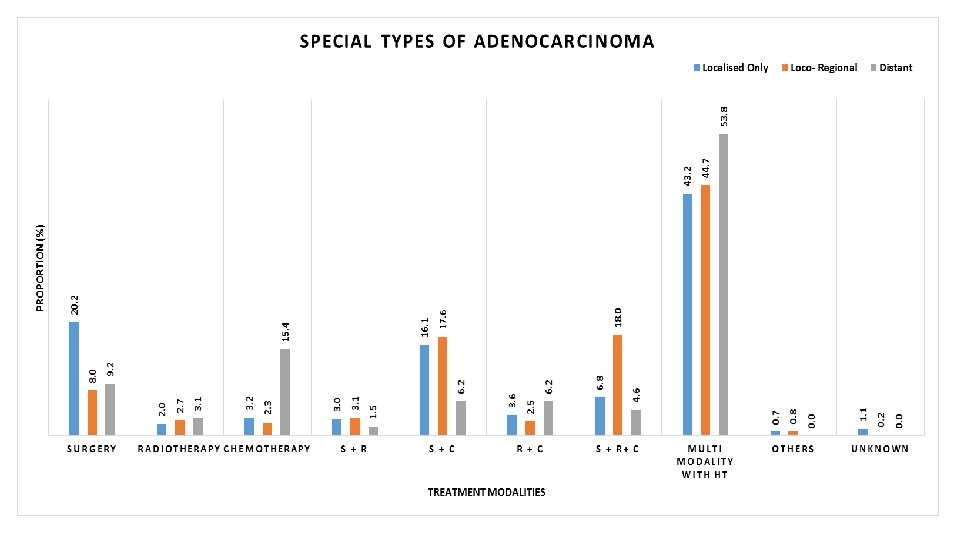

3. Special Types of Adenocarcinoma

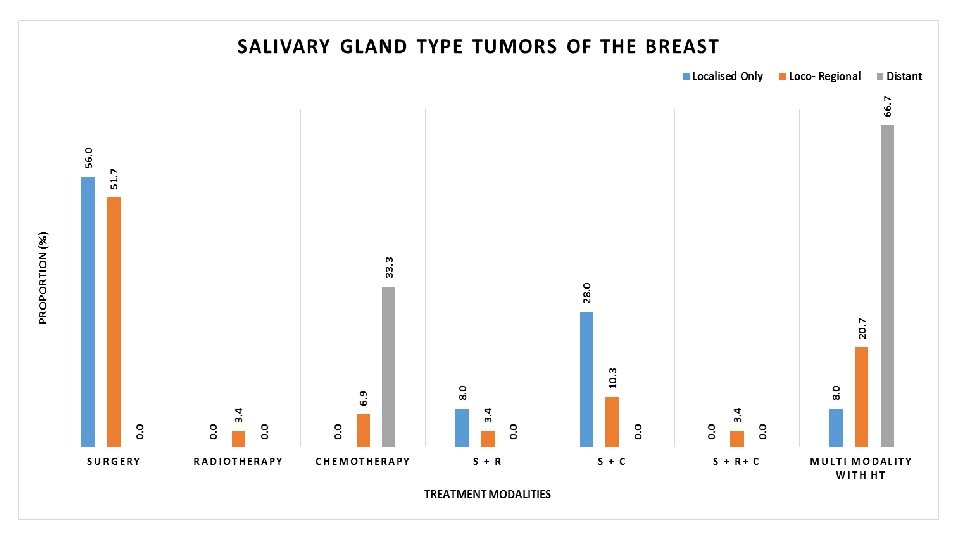
4. Salivary Gland Type Tumors of the Breast

Summary • The PBCR registries data was analyzed for 4 Broad Categories which includes 20 Subtypes and was classified as Rare Epithelial tumors of the Breast. • A total of 3, 309 cases have been reported from the various registries between 1982 - 2014. • The number of observed cases and AARs were • • for Mammary Paget’s disease of Breast (231 & 0. 09), for Special types of Adenocarcinoma of Breast (2740 & 1. 05), for Metaplastic Carcinoma of Breast (292 & 0. 11) and for Salivary gland type tumors of the breast (46 & 0. 02) respectively. • Based on the 5 registries the Observed Numbers and AAR were • • • Bangalore PBCR (816 & 1. 34), Mumbai PBCR (1412 & 1. 18), Chennai PBCR (512 & 0. 86), Bhopal PBCR (76 & 0. 59), Delhi PBCR (4575 & 3. 97)

Conclusion • The present study gives an insight on the indication of type and treatment of rare breast cancer in India, the data was done in Comparison with Rarecare Net for the European population and had similar epidemiological information. • We are proposing on creating a repository for such cases where the data from India will be pooled in as rare tumors. • This exercise will give the necessary information to further understand the sub classification, behaviors and rarity of the tumors in Indian scenario. • The same approach for classification of rare tumors could be utilized for various other sites and a National Repository can be established.

Thank you

IARC data • Number of New Cases and Deaths per 100, 000: The number of new cases of female breast cancer was 127. 5 per 100, 000 women per year. The number of deaths was 20. 6 per 100, 000 women per year. These rates are age-adjusted and based on 2012 -2016 cases and deaths. • Lifetime Risk of Developing Cancer: Approximately 12. 8 percent of women will be diagnosed with female breast cancer at some point during their lifetime, based on 2014 -2016 data. • Prevalence of This Cancer: In 2016, there were an estimated 3, 477, 866 women living with female breast cancer in the United States.
 • 89. 9%")
IARC data • Percent Surviving 5 Years (2009 -2015) • 89. 9%

• Estimated New Cases in 2019 : 268, 600 • % of All New Cancer Cases : 15. 2% • Estimated Deaths in 2019 : 41, 760 • % of All Cancer Deaths: 6. 9%

New Cases, Deaths and 5 -Year Relative Survival • New cases come from SEER 9 Incidence. Deaths come from U. S. Mortality. 1975 -2016, All Races, Females. Rates are Age-Adjusted. Modeled trend lines were calculated from the underlying rates using the Joinpoint Trend Analysis Software. • 1980198519901995200020052010 Year 19752016020406080100 Perce nt Surviving 0100 • SEER 9 5 -Year Relative Survival Percent from 1975 -2011, All Races, Females. Modeled trend lines were calculated from the underlying rates using the Joinpoint Survival Model Software.

• Changes Over Time • Keeping track of the number of new cases, deaths, and survival over time (trends) can help scientists understand whether progress is being made and where additional research is needed to address challenges, such as improving screening or finding better treatments. • Using statistical models for analysis, rates for new female breast cancer cases have been rising on average 0. 3% each year over the last 10 years. Death rates have been falling on average 1. 8% each year over 2007 -2016. 5 -year survival trends are shown below.

• There are four main female breast cancer subtypes, including the following in order of prevalence: • HR+/HER 2 - ("Luminal A") • HR-/HER 2 - ("Triple Negative") • HR+/HER 2+ ("Luminal B") • HR-/HER 2+ ("HER 2 -enriched") • HR stands for hormone receptor. HR+ means that tumor cells have receptors for the hormones estrogen or progesterone, which can promote the growth of HR+ tumors. HER 2 stands for human epidermal growth factor receptor. HER 2+ means that tumor cells make high levels of a protein called HER 2/neu, which has been shown to be associated with certain aggressive types of breast cancer.

At a Glance • When all subtypes are combined, female breast cancer is fairly common. In 2019, it is estimated that there were 268, 600 new cases of female breast cancer. • The breast cancer subtype HR+/HER 2 - is the most common subtype with an age-adjusted rate of 85. 8 new cases per 100, 000 women, based on 2012 -2016 cases. • This is a rate more than six times higher than the triple-negative breast cancer rate of 13. 0 and the HR+/HER 2+ breast cancer rate of 12. 9, and over 15 times higher than HR-/HER 2+ breast cancer rate of 5. 4.

Rate of New Breast Cases per 100, 000 Women, SEER 21 2012 -2016 Subtype New Cases HR+/HER 2 - 85. 8 HR-/HER 2 - 13. 0 HR+/HER 2+ 12. 9 HR-/HER 2+ 5. 4 Unknown 10. 4 Total 127. 5

Percent of Female Breast Cases by Cancer Subtype Percent of Cases HR+/HER 2 - 67. 2999519828973% HR-/HER 2 - 10. 1850545849258% HR+/HER 2+ 10. 1258002804483% HR-/HER 2+ 4. 25532305859692% Unknown 8. 13387009313172%

• Who Gets This Cancer? • Female breast cancer overall is most common in middle-aged and older women. Although rare, men can develop breast cancer as well. The number of new cases of female breast cancer, with all subtypes combined, was 127. 5 per 100, 000 women per year based on 2012 -2016 cases. • The distribution of breast cancer subtypes among the female population varies by age, race, ethnicity, stage, and more. Compared with women with HR+/HER 2− subtype (the most common subtype), those diagnosed with the other three subtypes were somewhat more likely to be younger, belong to minority groups, and be diagnosed with cancer at a later stage. (Howlader 2018)

Race / Ethnici ty HR+/H ER 2 - Rate HRHR+/H /HER 2 - ER 2+ Rate HRUnkno /HER 2+ wn Rate of New Female Breast Cancer Subtypes per 100, 000 by Race White 90. 2 12. 1 13. 0 5. 1 10. 1 Black 70. 2 22. 3 13. 0 6. 6 11. 9 White. Black. AI/ANªAPIᵇHispanic. Race 0102030405060708090100 Rate of New Cases 0100 Americ an Indian 51. 7 / Alaska Native 7. 5 8. 3 4. 8 7. 2 Asian or Pacific 66. 3 Islande r 8. 4 11. 6 5. 9 7. 9 Hispani 62. 2 c 10. 4 10. 6 4. 8 9. 2 • HR+/HER 2 - Rate • HR-/HER 2 - Rate • HR+/HER 2+ Rate • HR-/HER 2+ Rate • Unknown Rate SEER 21 2012 -2016, a American Indian / Alaska Native, b Asian or Pacific Islander White women have the highest rate of new cases of HR+/HER 2− breast cancer. Black women have the highest rate of new cases of HR−/HER 2− breast cancer, also known as the triple-negative subtype.
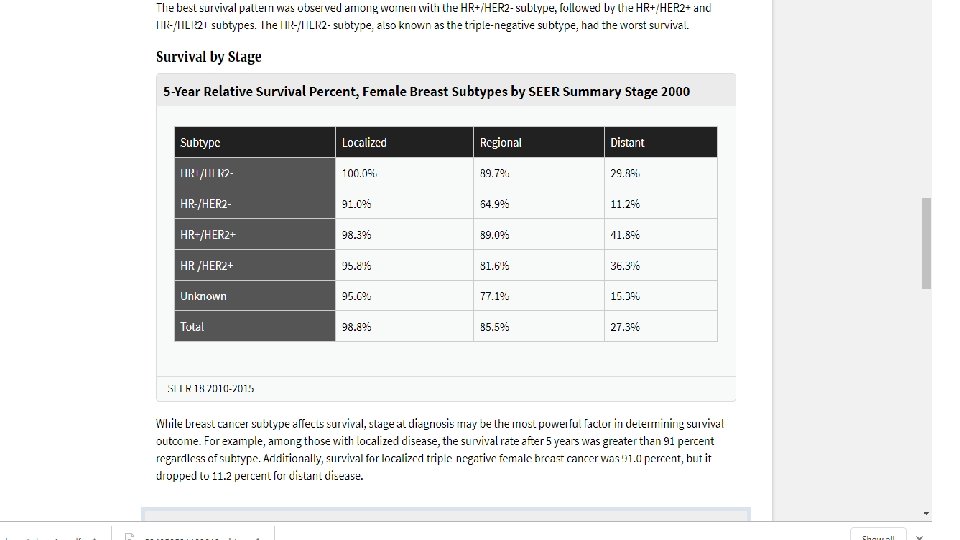

• While breast cancer subtype affects survival, stage at diagnosis may be the most powerful factor in determining survival outcome. • For example, among those with • localized disease, the survival rate after 5 years was greater than 91 percent regardless of subtype. • Additionally, • survival for localized triple-negative female breast cancer was 91. 0 percent, • but it dropped to 11. 2 percent for distant disease.

HBCR Data Mammary Paget’s

Special Types of Adenocarcinoma

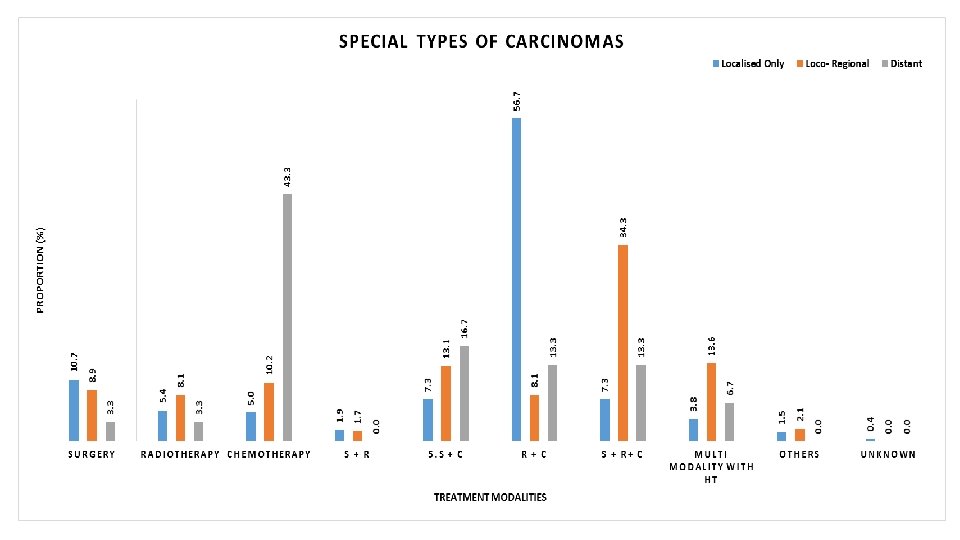
Special Types of Carcinoma

Salivary Gland Type Tumors of the Breast
- Slides: 47