Cancer Epidemiology and Cancer Prevention Epidemiology 242 December

Cancer Epidemiology and Cancer Prevention Epidemiology 242 December 2, 2009
 US Site China World Males Females Stomach 7.")
Age Standardized Incidence Rates (/100, 000) US Site China World Males Females Stomach 7. 2 3. 3 41. 4 19. 2 22. 0 10. 3 Lung 61. 9 36. 1 42. 4 19. 0 35. 5 12. 1 Liver 5. 5 2. 0 37. 9 14. 2 15. 7 5. 8 Esophagus 4. 9 1. 3 27. 4 12. 0 11. 5 4. 7 Colon/Rectum 44. 6 33. 1 13. 6 9. 2 20. 1 14. 6 ─ 101. 1 ─ 18. 7 ─ 37. 5 Leukemia 11. 2 7. 4 5. 7 4. 1 5. 9 4. 1 Pancreas 8. 3 6. 3 3. 9 2. 6 4. 6 3. 3 Cervix 0 7. 7 0 6. 8 0 16. 2 Brain 6. 5 4. 5 3. 9 2. 8 3. 7 2. 6 124. 8 0 1. 6 0 25. 3 0 Breast Prostate Source: GLOBOCAN 2002
")
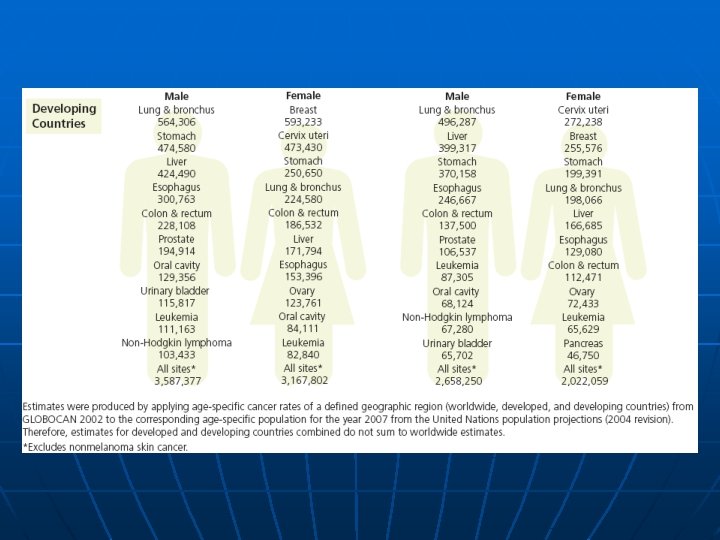
The Major Cancers n n n n Lung (ICD-10 C 33 and C 34) Breast (female, C 50) Colon/rectum (C 18 -C 20) Stomach (C 16) Prostate (C 61) Liver (C 22) Cervix uteri (C 53) Esophagus (C 15)

2009 Estimated US Cancer Cases* n. Men n. Women 766, 130 713, 220 n Prostate 25% n 27% Breast n Lung & bronchus 15% n 14% Lung & bronchus n Colon & rectum 10% n Urinary bladder 7% n n Melanoma of skin 5% n Non-Hodgkin lymphoma 5% n n 6% Colon & rectum Uterine corpus 4% Non-Hodgkin lymphoma 4% Melanoma of skin 4% Thyroid n Kidney & renal pelvis 5% n n Leukemia 3% n 3% Kidney & renal pelvis n Oral cavity 3% n 3% Ovary n Pancreas 3% n 3% Pancreas n All Other Sites 19% n 22% All Other Sites n*Excludes basal and squamous cell skin cancers and in situ carcinomas except urinary bladder. n. Source: American Cancer Society, 2009.

2009 Estimated US Cancer Deaths* n Lung & bronchus 30% n Prostate 9% n Colon & rectum n n. Women 292, 540 269, 800 n 26% Lung & bronchus n 15% Breast 9% n 9% Pancreas 6% n Leukemia 4% n Liver & intrahepatic 4% bile duct n Esophagus 4% n Urinary bladder 3% n n. Men Non-Hodgkin lymphoma n n 6% Pancreas 5% Ovary 4% Non-Hodgkin lymphoma 3% Leukemia 3% Uterine corpus n 2% Liver & intrahepatic bile duct 2% Brain/ONS n 3% n Kidney & renal pelvis 3% n n All other sites n 25% n. ONS=Other nervous system. n. Source: American Cancer Society, 2009. Colon & rectum All other sites

Cigarette Smoking and Cancer Risk

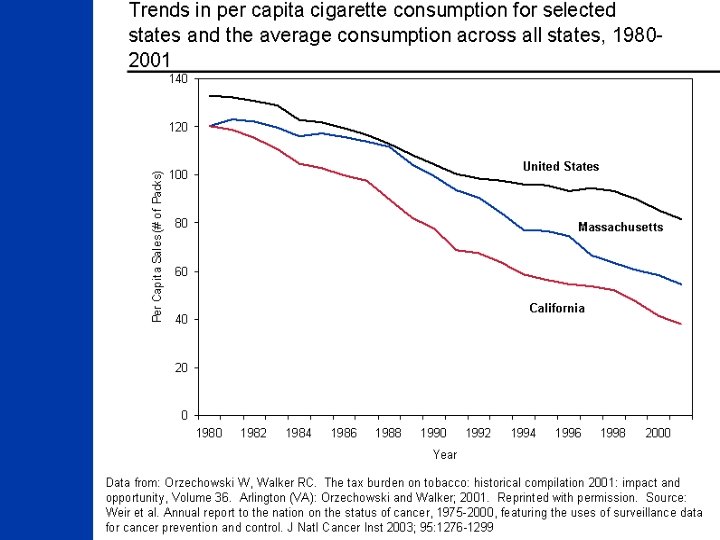
Adult Per Capita Cigarette Consumption and Major Smoking and Health Events – United States, 1900 -2001 1 st World Conference on Smoking and Health 1 st Surgeon General’s Report Broadcast Ad Ban 1 st Great American Smoke-out End of WW II OTC Nicotine Medications Master Settlement Agreement Fairness Doctrine Messages on TV and Radio 1 st Smoking-Cancer Concern Non-Smokers Rights Movement Begins Surgeon General’s Report on ETS Federal Cigarette Tax Doubles Great Depression Source: United States Department of Agriculture

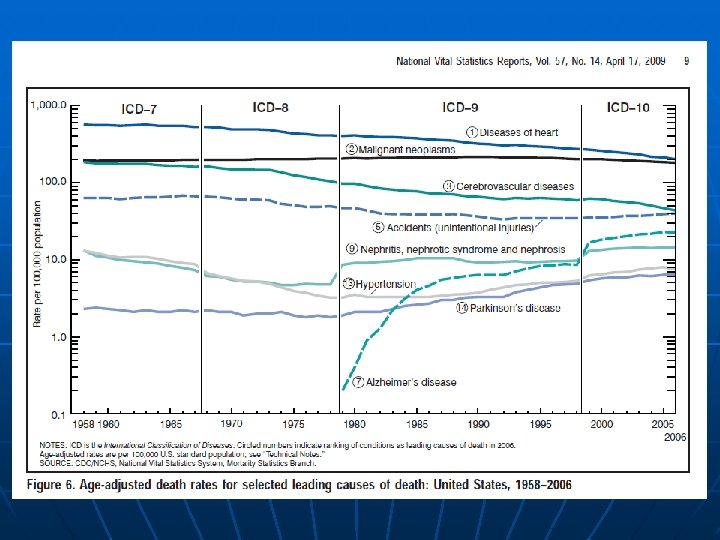
Tobacco Use in the US, 1900 -2005 n. Per capita cigarette consumption n. Male lung cancer death rate n. Female lung cancer death rate n*Age-adjusted to 2000 US standard population. n. Source: Death rates: US Mortality Data, 1960 -2005, US Mortality Volumes, 1930 -1959, National Center for Health Statistics, Centers for Disease Control and Prevention, 2006. Cigarette consumption: US Department of Agriculture, 1900 -2007.

Trends in cigarette smoking* among adults aged >18 years, by sex - United States, 1955 -2002 Men Women 24. 5% 18. 8% *Before 1992, current smokers were defined as persons who reported having smoked >100 cigarettes and who currently smoked. Since 1992, current smokers were defined as persons who reported having smoked >100 cigarettes during their lifetime and who reported now smoking every day or some days. Source: 1955 Current Population Survey; 1965 -2002 National Health Interview Survey; 2002 estimates for first quarter only

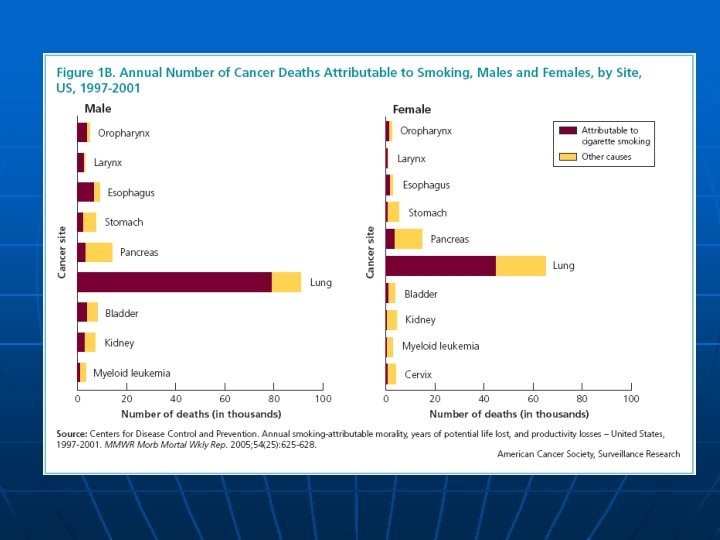
Smoking and Other Cancers n n n n Head and neck cancers (oral, laryngeal and pharyngeal cancers) Esophageal cancer Stomach cancer Pancreatic Cancer Bladder cancer Cervical cancer Liver cancer

Environmental Tobacco Smoke n n 3, 000 nonsmoking Americans die of lung cancer 300, 000 children suffer from lower respiratory tract infections.
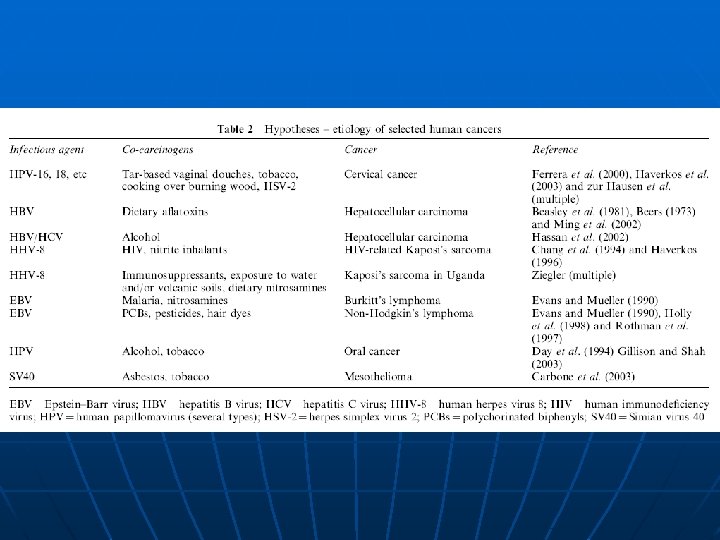

Major Infection-Associated Malignancies In 2002, 17. 8% of the global cancer burden (1. 9 million cases) were infection-attributable Malignancy (infection) n Stomach cancer (Helicobactor pylori) n Cervical cancer (human papillomavirus) n Liver cancer (hepatitis B and C viruses) n Burkitt’s lymphoma and nasopharyngeal cancer (Epstein-Barr virus) n Kaposi sarcoma and Non-Hodgkin lymphoma (HIV/HHV-8) n Bladder and colon cancer (schistosomiasis) n Adult T-cell leukemia/lymphoma (human T-cell lymphotropic virus type I)

Mechanisms of Infection-Induced Malignancy Chronic Inflammation and Carcinogenesis n Chronic host-pathogen interaction Immunosuppression n Chronic inflammation Oxidative Stress DNA damage and mutations Cell injury Cell division n Infection inducing Cell proliferation Production of Oncogenic Proteins Genomic Instability from Viral Genomic Integration

Cancers attributable to infections worldwide, 2002 n. Source: Parkin, 2006

9 Possible Mechanisms How Alcohol Intake Increase Cancer Risk According to Blot et al (1992) 1. Contain congeners and other contaminants that may be carcinogenic 2. Generated metabolites that are carcinogenic to humans 3. Act as solvent, increasing penetration of other carcinogens into target tissue 4. Reduce intake and bioavailability of nutrition 5. Inhibit the detoxification of carcinogenic compounds 6. Catalyze the metabolic activation of some compounds into carcinogens 7. Affect hormonal status 8. Increase cellular exposure to oxidants 9. Suppress immune function 31

What is “a Drink”? n n Despite the differences in concentration, the average intake of ethanol per drink is approximately constant across beverage types. A standard drink is: • One 12 -ounce bottle of beer* or wine cooler • One 5 -ounce glass of wine • 1. 5 ounces of 80 -proof+ distilled spirits. n* Different beers have different alcohol content. Malt liquor has a higher alcohol content than most other brewed beverages. n + 80 -proof== 40% ABV (alcohol by volume) 32


Cancer Prevention
: 5269 -84")
n. S Lippman, Cancer Res. 2009 Jul 1; 69(13): 5269 -84

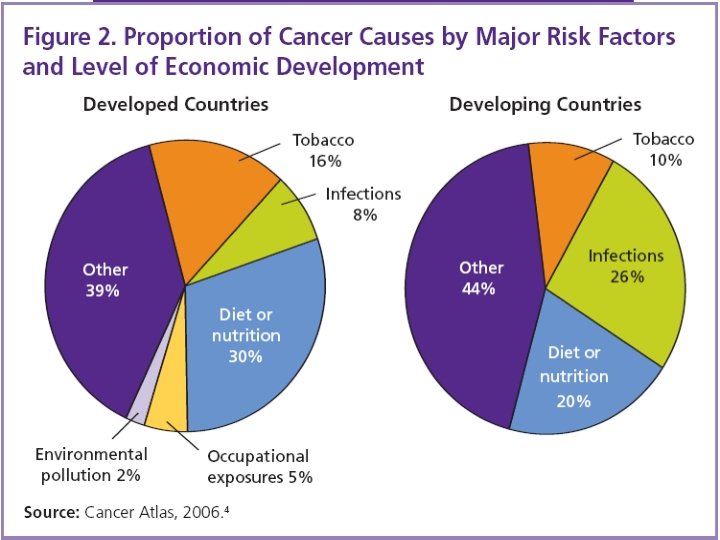
Known risk factors n n n Smoking causes most cancers in smokers. Among non-smokers, most cancers are of unknown cause. Infection causes most cancers in the lowest-income countries.

Avoidable Known Cancer Risks USA

Proven Cancer Prevention Strategies Compelling non-RCT Evidence n Risk Factor Avoidance Smoking prevention/cessation counseling Worker exposure reduction (asbestos, etc. ) n Immunization Hepatitis B HPV n Screening Cervical PAP testing

Proven Cancer Prevention Strategies RCT Evidence n Screening Mammography with Clinical Breast Exam Fecal Occult Blood Test (colorectal cancer)

BRIDGING THE GAP BETWEEN CANCER TREATMENT AND PREVENTION n n(William WN, et al, Nat Rev Drug Discov. 2009 Mar; 8(3): 213 -25. )

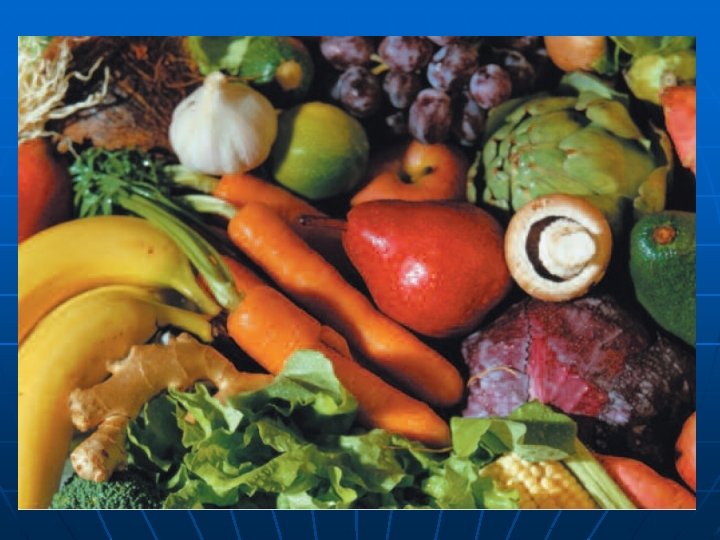
Widely-Accepted Prevention Strategies Insufficient or Negative Evidence n n n n Oral cancer screening examination PSA testing for prostate cancer Lung cancer screening with CT or Xray Dietary change: More vegetables and fruits Dietary change: Less fat Dietary antioxidant supplements Weight loss and exercise

How Many Cancer Deaths/Yr Could we Prevent Now? n Tobacco Control n Screening n Infection Control

How Many Cancer Deaths/Yr Could we Prevent Now? Tobacco-Caused Cancers – 1. 15 million deaths Lung 75% of 1, 300, 000 deaths Oropharynx 40% of 320, 000 deaths Other sites 15% of 350, 000 deaths

How Many Cancer Deaths/Yr Could we Prevent Now? Screen-detectable cancers – 660, 000 deaths Colorectal 50% of 620, 000 deaths Cervix 90% of 230, 000 deaths Breast 30% of 475, 000 deaths

How Many Cancer Deaths/Yr Could we Prevent Now? Infection-related Cancers – 750, 000 deaths Liver (immunization) deaths 40% of 600, 000 Stomach (antibiotics) deaths 60%? of 850, 000 [Cervix (immunization)] 50% of 230, 000 deaths]

How Many Cancer Deaths/Year Could we Prevent Now? n n n Tobacco programs 1, 115, 000 at low cost Infection Control 750, 000 at low/moderate cost Screening cost 660, 000 at low/very high Total deaths preventable: about 2. 5 Million of the 7. 5 million deaths/year from cancer worldwide
- Slides: 50