Canadian Oil and Gas Presented by Raphael Stephanie

Canadian Oil and Gas Presented by: Raphael Stephanie Beatrix Vincent

Agenda 1. Canadian Oil and Gas Industry 2. Imperial Oil 3. Suncor Energy 4. Encana

Canadian Oil and Gas Industry Analysis Table of Contents Industry Overview Industry Analysis Sensitivity Analysis Trend Analysis Market Analysis Recommended Strategy By: Raphael Kan
")
Industry Overview National Economic Importance: • Energy Sector contribute 5. 6% ($62. 8 billion) to Canadian GDP in 2003 • Canadian Oil and Gas Industry accounts for 38% ($23. 8 billion) of the Energy Sector contribution • In 2003, new capital investment in energy related industries represented 18. 6% of total Canadian investment • Combined, Toronto Stock Exchange and TSX Venture Exchange have 413 Oil and Gas Companies with a total value of over $299 billion. • The Oil and Gas Industry itself accounts for more than 18% of the TSX total market capitalization

Industry Overview Key Stats - Oil • • Total production of 3. 1 million barrels per day in 2004 – Seventh largest in the world – 99% of its export goes to U. S (largest source of oil for US) 179 billion barrels of proven reserve in 2005 – Second largest in the world – Able to produce at current rates for the next 150 -200 years

Industry Overview Type of Crude Oil produced in Canada • Light crude oil: liquid petroleum with a gravity of 28°API or higher • Heavy crude oil: liquid petroleum with a gravity below 28°API • Bitumen: petroleum in semi-solid or solid form that is found in bituminous sands. It is so heavy (gravity below 12°API) and viscous that it will not flow unless heated or diluted. • Synthetic crude oil: a product similar to a high-quality light crude oil. It is made by refining or upgrading heavy oil or bitumen. • Condensates: hydrocarbons recovered from a natural gas reservoir. • Pentanes: hydrocarbons containing molecules of 5 carbon atoms and 12 hydrogen atoms.

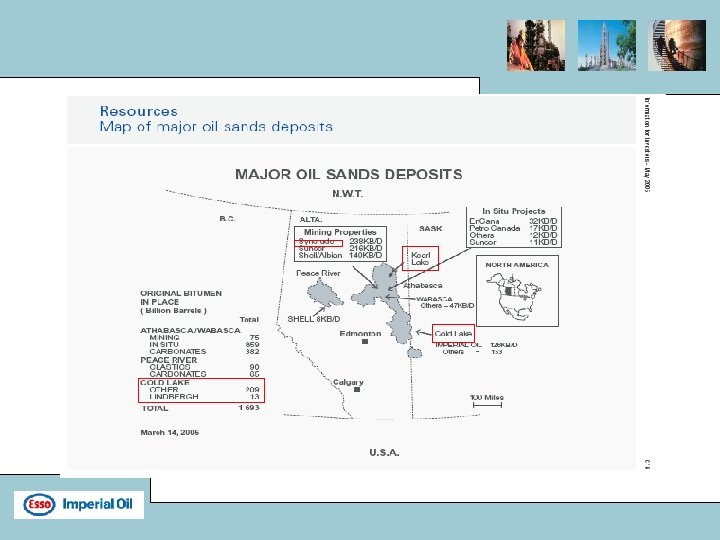
Industry Overview Sources of Canadian Oil Production: • Offshore: Off the Atlantic coast of Newfoundland • Conventional Oil: Western Canada Sedimentary Basin • Oil Sands: Northern Alberta and Canadian Arctic

Industry Overview Conventional vs Oil Sands: Conventional Oil – Petroleum found in liquid form, flowing naturally or capable of being pumped without further processing or dilution – Cheaper to produce Oil Sands Synthetic Crude Oil – Oil Sands is a thick mixture of sands, bitumen, mineral rich clays and water – Synthetic crude oil is extracted from oil sands and it is often sold at a premium because of its high quality – More costly to produce – No drilling risk for the near surface oil sands

Industry Overview Synthetic Crude Production Process: Ore Preparation • • Strip-Mining – The pick and shovel method used to recover oil sands that are near surface – 600, 000 barrels per day 1. 2 m barrels per day in 2010 In Situ – Includes various methods used to recover deeply buried bitumen deposits, including steam injection, solvent injection and firefloods – 380, 000 barrels per day 700, 000 barrels per day in 2010 – More than 80% of the Oil Sands reserve require this method Extraction – Separates Bitumen from other molecules Upgrading – Processes Bitumen into Synthetic Crude Oil and Vacuum Gas Oil

Industry Overview Key Stats – Natural Gas • • Total production of 6. 6 trillion cubic feet in 2002 – Third largest in the world – Almost all of its export goes to U. S. 56. 1 trillion cubic feet of proven gas reserve in 2005 – Only ranked 19 th in the world – At current rates, production will deplete in 8. 6 years

Industry Overview Sources of Canadian Natural Gas Production: • Western Canadian Sedimentary Basin • Atlantic Coast • Arctic

Industry Overview Industry Components • Upstream – Exploration and Production • Midstream – Pipeline, Transportation and Storage • Downstream – Refining, Marketing and Retailing
 ROE")
Industry Analysis Top 15 players by market capitalization Company Name Market Cap ($Mil) ROE ROA Net Inc ($m) Type of firm En. Cana Corp 49, 128 28. 36 17. 17 4572. 5 Oil and Gas Producer Imperial Oil 37, 798 32. 75 22. 98 2033. 0 Integrated Suncor Energy 31, 118 24. 93 15. 45 1100. 0 Integrated Shell Canada 30, 932 21. 32 18. 63 1286. 0 Integrated Canadian Natural Resources 30, 115 21. 08 13. 06 1405. 0 Oil and Gas Producer Husky Energy 24, 598 16. 24 11. 48 1006. 0 Integrated Petro-Canada 23, 056 21. 52 20. 6 1757. 0 Integrated Talisman Energy 20, 677 13. 89 9. 87 663. 0 Oil and Gas Producer Nexen 13, 730 32. 09 12. 97 793. 0 Oil and Gas Producer Precision Drilling 6, 740 12. 17 12. 61 247. 4 Oil and Gas Field Services Western Oil Sands Inc 4, 626 3. 83 5. 14 19. 5 Ensign Energy Services 3, 024 19. 59 16. 07 118. 8 OPTI Canada Inc 2, 945 0. 08 0. 67 0. 6 Integrated (Oil Sand only) Trican Well Service 2, 763 30. 9 31. 81 59 Oil and Gas Field Services Paramount Resources 2, 181 7. 35 7. 89 41. 2 TSX Capped Energy Average TSX Composite Average 12. 94 10. 59 11. 28 7. 89 Oil and Gas Producer (Oil Sand only) Oil and Gas Field Services Oil and Gas Producer

Industry Analysis The Canadian Advantage • Canada is the world leader of – Enhanced recovery techniques for mature reservoirs – Cold climate and offshore production – Gas processing, sulphur extraction and heavy oil upgrading – Oil Sands reserve – Development of Oil Sand projects • Integrated with the world’s largest market for energy consumption, making it less costly to bring the products to market. • Strong interest from China, the largest market for energy consumption in the future. • Attractive crown royalty rate for oil sand projects

Industry Analysis Risks and Constraints • Tighter environmental regulation • Kyoto Protocol • Limited proven natural gas reserve • Long run viability of oil sands project – It is estimated that crude price has to be above $25 a barrel for oil sand projects to be profitable because of the high production costs Factors that would determine the viability include: – Invention of new drilling and refining technology – Presence of alternative source of energy – Oil production level of major producers such as OPEC and Russia

Sensitivity Analysis Regress TSX Capped Energy Index with Crude Oil Spot Price between 2001 to 2005 • R Square = 0. 9116 • Slope Coefficient = 4. 3328 (A dollar change in crude price 4. 3328 change in the Energy Index or 1. 4467% change in the Energy Index as of Nov 7, 2005) Scattered Plots Strong correlation

Trend Analysis Factors that would affect energy prices • Short term supply and demand • Rate of investment in the long term • Sentiments • Accidents such as • Bad weather • Halting transport of oil from producers • Labour disputes (strikes) • War • Natural disaster • Taxes - Crude price now represents less than a quarter of the price of oil products in many countries. Thus, taxes have significant influence over the price of oil products

Trend Analysis - Oil Global Oil Supply Million barrels per day • Upward trend since 1985

Trend Analysis - Oil Global Oil Demand & Forecast • Expected to grow by more than 50% in the next 20 years • More than 50% are consumed by the transportation sector

Trend Analysis - Oil Global Oil Demand & Forecast • Emerging Asia, especially China is expected to more than double its demand in the next 20 years.

Trend Analysis - Gas Global Natural Gas Demand Forecast • Expected to grow at a slightly higher rate than crude oil demand

Market Analysis Correlation between Oil and Natural Gas Prices

Market Analysis Historical Oil Price Analysis • Even at the current $60 level, the impact on consumers is not as big as in the early 80 s during the Iran and Iraq war Iran & Iraq war War on “terrorism” OPEC 10% Quota Increase Asian Economic Crisis Gulf War Iranian revolution Series of OPEC cuts

Market Analysis Comparison of TSX Capped Energy Index against TSX Composite and S&P 500 from 2001~2005 TSX Capped Energy Index Outperform by more than 100% TSX Composite Index S&P 500

Market Analysis Market Outlook • Prices of petroleum products and natural gas will remain high due to tight international supplies and hurricane induced short term supply losses • Many fund managers still favour the energy sector though some has started shifting assets to the consumer staple sector based on the sector rotation model • Very few analysts and industry executives believe that the crude price will ever fall back to the level of $30 per barrel

Recommended Strategy Selection Criteria For Long Term Investment One should look for: • Larger companies with strong financial resources • Companies that have good track records of positive relationships with all stakeholders • Companies that have strong presence in oil sands but are relatively diversified • Companies that already demonstrate superior cost structure and lower production costs.

Imperial Oil by Stephanie Zhang

Background • History – – – Founded in 1880, Ontario. 6% of total Canadian primary energy supply Head Office: Calgary in 2005 Stock trading symbol: IMO Stock Exchanges: TSX, AMEX. • Current price: $87. 29. Rating: AAA – 69. 9% shares, Exxon Mobil Corporation

Corporate Profile Largest integrated in Canada -market cap: C$40 billion -2004 -EAT $2. 1 billion; ROCE 28% Largest producers of crude oil and natural gas -360, 000 oil-equivalent barrels a day Largest petroleum producers -ESSO Largest chemical producers

Imperial Management • CEO: Tim J. Hearn • Business Strategy – Increase long-term shareholder’s value – Invest in attractive growth opportunities

Management Performance

Investment Strategy

Imperial Performance

Imperial Performance
 • Conventional Oil and")
Business Segments • Three product segments: – Natural Resources (Upstream) • Conventional Oil and Gas • Oil sands operation – Petroleum Products (Downstream) • Refining, distributing and marketing – Chemicals

Natural Resources • Conventional oil and gas – Nine conventional oil and gas sites – The Mackenzie gas project • Oil sands operation – Cold Lake – Syncrude – Drilling lease at Kearl

Mackenzie gas project • Development of Canadian onshore gas resources in 2004 – 1220 -kilometre natural gas pipeline system • Co-venture with – Conoco. Phillips, Shell Canada, Exxon. Mobil Canada and the Aboriginal Pipeline Group. • Total project investment is estimated at $7 billion. • Halted in 2004.

Oil sands operation • Cold lake – Wholly owned, 1960’s. – largest thermal heavy-oil recovery operations in the world. • Syncrude – largest oil-sands project in the world, 1975 – 60, 000 barrels a day for Imperial. • Drilling lease at Kearl

Cold Lake

Cold Lake

Syncrude Joint Venture

Kearl • Mining project with Exxon. Mobil Canada at Fort Mc. Murrary, in 2004. • Imperial Oil (70%) and Exxon. Mobil Canada (30%) • Estimated cost 4. 5 – 6. 5 billion • 300, 000 barrels per day over 40 years

Mackenzie gas project

Financial Performance of Natural Resources Segment

Petroleum Products Segment • The largest producer and marketer of petroleum products in Canada. • 1916 Gasoline Station • 2005 A network of 1, 978 Esso service stations across Canada. -Four refineries in Canada.

Imperial Refining Centers

Challenges in Petroleum Market • Intense competition • Surplus capacity • Environmental legislation and low return on investment

Financial Performance of Petroleum Segment

Chemicals Segment • The Chemicals segment manages the technology, manufacturing, marketing and distribution of petrochemicals, and markets its products both domestically and internationally. Imperial is one of the largest chemical manufacturers and marketers based in Canada.

Chemicals Segment Map

Chemicals • The largest market share in domestic solvents in Canada • The largest market share in North America for polyethylene used in rotational molding • Two main products: – polyethylene and benzene

Financial Performance of Chemicals Segment Polyethylene and Benzene

Business Segments

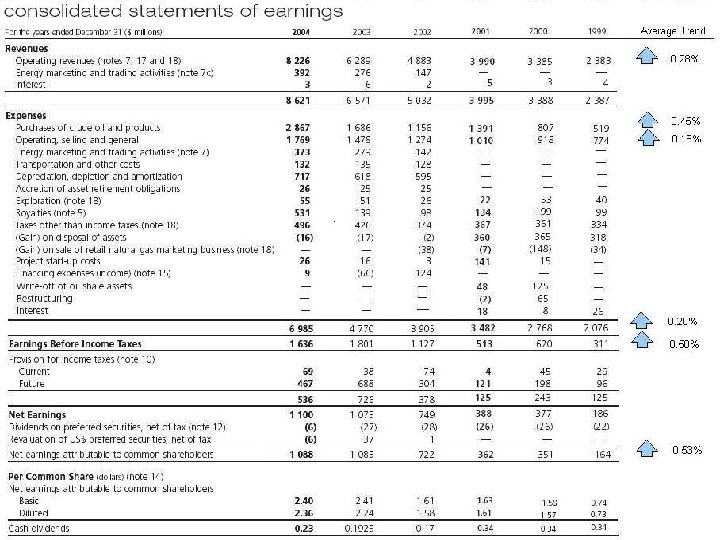
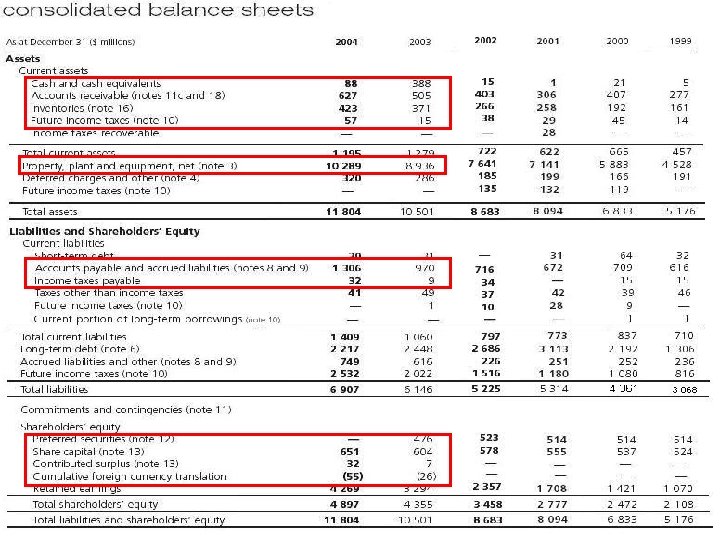
Financial Statement Analysis • • Income statement Cash flow statement Balance sheet Statement of shareholder’s equity

Quarterly Cash Flow

Imperial Key Statistics

Value Drivers

Risks

Stock Price

Fisher’s 4 D • Functional Factors: – Leader in the industry • People Factors – Management with long-term view • Essential Business Characteristics: – – Price sensitive market Diversified products and services Integrated oil and gas company No hedge • Stock Value – High P/E – Persistent return

Recommendation Price sensitive Uncertain commodity price Volatile markets + Leader in the market Sustainable growth Disciplined business strategy Outperform major indices BUY

Suncor Energy by Beatrix Wiriahardja

Agenda • Company Background • Management Team • Integrated Stategy • • Oil Sands Natural Gas Refining and Marketing – Canada Refining and Marketing – US • Analysis on Suncor’s Consolidated Financial Statements • Stock Information as of Nov 4, 2005 • Recommendation

About Suncor • An integrated energy company • Strategically focused on developing one of the world’s largest petroleum resource basins – Canada’s Athabasca oils sands • Pioneering the industry in 1967 and became a publicly traded company in 1992 • The core oil sands business is supported by conventional natural gas production in Western Canada and downstream refining, marketing and retail businesses in Ontario and Colorado • Significant progress since 1992: – – – Daily oil sands production has more than tripled One of the lowest cost producers in North America Growth in market capitalization ($1 billion to more than $19 billion at the end of 2004)

Corporate Committee • • • Richard George – President & CEO since 1991 Kenneth Alley – Senior VP & CFO since 2003 (join Suncor in 1984) Mike Ashar – Executive VP, Refining and Marketing since 2003 (join Suncor in 1987) David Byler – Executive VP, Natural Gas & Renewable Energy since 2000 (join Suncor in 1979) Terrence Hopwood – Senior VP & General Council since 2002 (join Suncor in 1988) Sue Lee – Senior VP, HR & Communications since 1996 Kevin Nabholz – Senior VP, Major projects since 2002 (join Suncor in 1986) Steven Williams – Executive VP Oil Sands since 2003 (join Suncor in 2002) Thomas Ryley – Executive VP, Energy Marketing & Refining (join Suncor in 1983)

Employees’ Benefits

Integrated Strategy • 4 major business divisions: 1. Oil Sands 2. Natural Gas and Renewable Energy – produce in Western Canada 3. Energy Marketing and Refining – Ontario 4. Refining and Marketing – Colorado With a high quality resource base that it is estimated to contain the raw materials to produce a potential 11 billion barrels of conventional crude oil, Suncor doesn’t need to look for new oil reservoirs. Instead it can focus on developing the technology and expertise to produce higher value crude oil products, increase production and improve operational flexibility.

Integrated Strategy

Oil Sands • Located near Fort Mc. Murray, Alberta • Recovers bitumen through mining and in-situ development and upgrades it into refinery feedstock, diesel fuel and by products. • The foundation of Suncor’s growth strategy and represents the most significant portion of the company’s assets. • Suncor pioneered the world’s first commercially successful oil sands operation in 1967 and today, with total production nearing the one billion barrel mark and enough reserves to sustain production for the next 50 years, the company remains a leader in oil sands development.

Oil Sands

Subsequent Event • A fire on January 4, 2005, caused significant damage to Oil Sands Upgrader 2, reducing upgraded crude oil production capacity from base operations to about 110, 000 bpd. • Repair work is under way and Oil Sands expect to return to full production capacity of 225, 000 bpd in the third quarter of 2005. • To mitigate the impact of reduced production during the recovery period, Oil Sands plans to bring forward as many maintenance projects as possible, including all, or significant portions of, a maintenance shutdown previously planned for the fall.

Outlook & Risk/Success Factors • Outlook: – Continues to work towards an operational target of ½ million barrels per day • Risk/ Success Factors: – Final amount and timing of the settlement and payment of insurance proceeds related to fire damage – Additional maintenance schedules related to returning Oil Sands to full production – Ability to finance Oil Sands growth in a volatile commodity pricing environment – The ability to complete future projects both on time and on budget – Potential changes in the demand for refinery feedstock and diesel fuel – Volatility in crude oil and natural gas prices and exchange factors and the light/heavy and sweet/sour crude oil differentials – Relationship with trade unions

Natural Gas • Primarily produces conventional natural gas in Western Canada • Serves as a price hedge that provides the company with a degree of protection from volatile market prices of natural gas purchased for internal consumption. • To ensure natural gas production keeps pace with companywide natural gas purchases, NG is targeting production increases of 3% to 5% per year.

Natural Gas Production

Outlook & Risk/Success Factors • Outlook: – • Continues to work towards an operational target of increasing production by 3% to 5% per year to keep pace with the company’s growing internal natural gas demands. Risk/Success Factors Affecting Performance: 1. Consistently and competitively finding and developing reserves that can be brought on stream economically. 2. The impact of market demand for land services on capital and operating costs. 3. Risks and uncertainties associated with obtaining regulatory approval for exploration and development activities in Canada and the United States.
")
Marketing and Refining - Cad • Operates a 70, 000 barrel per day (bpd) capacity refinery in Sarnia, Ontario • Markets refined products to industrial, wholesale and commercial customers primarily in Ontario and Quebec • Markets products to retail customers in Ontario through its Sunoco -branded and joint-venture operated service networks • Encompasses third-party energy marketing and trading activities, as well as providing marketing services for the sale of crude oil and natural gas from the Oil Sands and NG operations.

Outlook & Risk/Success Factors • Outlook: – Construction on a diesel desulphurization project at the Sarnia refinery to meet current and anticipated federal sulphur regulations. – Construction of a planned ethanol plant is expected to begin in 2005 and be completed by 2006, subject to regulatory approvals. This facility is expected to produce ethanol at a for blending into Sunoco-branded and Suncor jointventure retail gasolines. – As a result of the fire incident, M&R may be required to purchase additional synthetic crude oil feedstock to meet demand, resulting in higher purchased product costs. • Risk/Success Factors Affecting Performance: – Fluctuations in demand supply for refined products, margin and price volatility. – The risk of cost overruns for the execution of capital projects. – Numerous risks and uncertainties that could affect construction schedules of the diesel desulphurization project.

Refining and Marketing - US • Downstream assets based in Denver, Colorado (acquired in August 2003) – This acquisition is part of an integration strategy aimed at improving access to the North American energy markets through acquisitions, long-term contracts and possible joint-ventures. • Operates a 60, 000 barrel per day (bpd) capacity refinery • Markets refined products to customers primarily in Colorado, including retail marketing through 43 Phillips 66 -branded retail stations in the Denver area.

Outlook & Risk/Success Factors • Outlook: – Approximately $260 m on new capital project – Spend $29 million by 2006 to meet existing obligations between the refinery and the United States Environmental Protection Agency and the State of Colorado. – 42 -day scheduled maintenance is planned for pipeline and refinery equipment. – R&M’s existing four-year contract with the local Paper, Allied-Industrial Chemical and Energy Workers International Union, which applies to hourly wage employees at the refinery, will expire in January 2006. • Risk/Success Factors Affecting Performance: – Fluctuations in demand for refined products, margin and price volatility and market competitiveness – The risks associated with the execution of the fuels desulphurization project – Numerous risks and uncertainties can affect construction schedules – A weaker Canadian dollar would result in a higher funding requirement for U. S. capital programs.

Consolidated Financial Statements

2004 - Promised and Delivered • Reduce lost-time injury frequencies. • Increase oil sands production to an average of 225, 000 to 230, 000 bpd. • Increase natural gas production volumes to 190 to 195 million cubic feet per day (mmcf/d). • Maintain base oil sands cash operating costs at an annual average of $10. 75 to $11. 75 per barrel. • Build for future oil sands growth and advance operations through use of improved technology. • Advance downstream integration plans. Maintain a strong balance sheet. • Continue to pursue energy efficiencies, greenhouse gas offsets and new renewable energy projects.

Risk/ Success Factors • • Commodity prices Exchange rates Environmental regulations Stakeholder support for growth plans Extreme winter weather Regional labour issues Each business segment Risk/Success factors

Sensitivity Analysis

Income Statements
 The increase resulted")
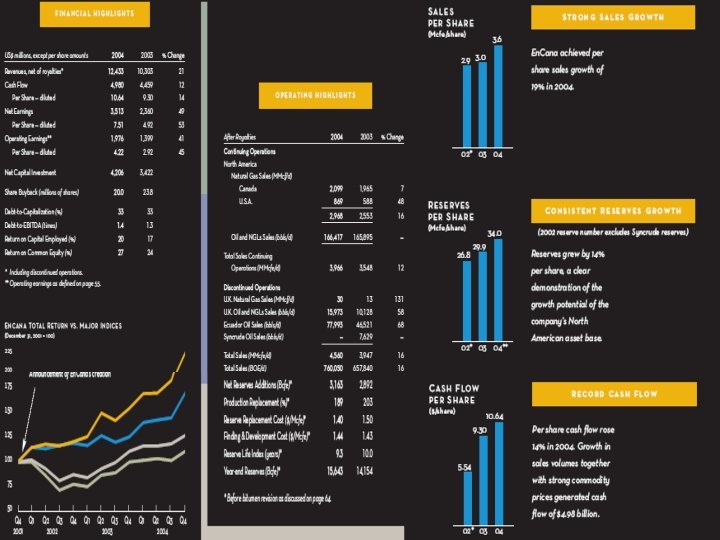
Revenues • • Revenues INCREASE: $2050 millions (31% increase from 2003) The increase resulted primarily from: – Higher average commodity price (offset by a 7% increase in the average CDN$/ US$ exchange rate) increased revenue by $1. 2 billion – Increase crude oil production increased revenue by approx $220 million – Higher refined product wholesale and retail prices, increase in sales volumes, one full year of operations of the Refining and Marketing division increased revenue by approx $890 million • These increased is partially offset by hedging losses reduced revenue by approx $380 million

Expenses • Purchases of crude oil and crude oil products INCREASE – – • Higher benchmark crude oil feedstock prices, Higher volume and refined products feedstock required as a result of 1 full year of operations for R&M Operating, Selling and General INCREASE – – The effects of 12 months of operations at R&M - US Higher operating expense higher energy costs Higher cost for obtaining certification under the Sarbanes-Oxley Act, and higher stock-based compensation expense Increased maintenance activities • Royalty expense INCREASE by $139 million • Financing expense INCREASE – Lower foreign exchange gains on the Suncor’s US$ denominated long-term debt

Net Income • Revenue increased by 31%, Expenses increased by 46% Earnings Before Income Taxes decreased by 9% • Income Tax expense DECREASED – Changes in tax rates (from 40% to 33%) • Net Income, EPS Constant • Cash Dividend INCREASE by 19%

Consolidated Net Income

Net Income Analysis

Balance Sheet Statements

Analysis of Balance Sheet • Increased in AR - due to higher sales volumes and higher price • Increased in Property, Plant and Equipment – due to company’s expansion • Increased in AP and accrued liabilities related to increased capital spending in the fourth quarter and higher accrued royalties payable • Decreased in Preferred Shares - On March 15, 2004, the company redeemed all of its then outstanding 9. 05% and 9. 125% preferred securities for total cash consideration of $493 million

Derivative Financial Instruments • Commodity Hedging Activities – To hedge against the potential adverse impact of changing market prices due to variations in underlying commodity indices – Suncor did not enter into any new arrangements in 2004. The strength of the its financial position, combined with stable operating costs and a growing production base, reduces the company’s risk to crude oil price volatility. – Prior to the suspension of the hedging program, Suncor had entered contracts to fix the price on 36, 000 barrels of crude oil per day at an average price of US$23 per barrel, which resulted in decreased in net earnings by $397 million. • Financial Hedging – Risk management strategy to manage exposure to interest rate fluctuations – The interest rate swap contracts involve an exchange of floating rate and fixed rate interest payments between the company and investment grade counterparties • Energy Trading Activities – Energy trading activities focus on the commodities the company produces. – To gain market information and earn trading revenues

Cash Flow Statements

Statement of Cash Flow

Cash Flow from Operations

Cash Flow Analysis

Cash Flow to Cap Ex
")
Return on Capital Employed (ROCE)

Return on Capital Employed

Capital Employed

Return on Capital Employed

5 Years Financial Summary

Financial Performance

5 Years Indicators

5 Years Financial Summary

Financial Ratios

Financial Ratios

Stock Information

Fundamental Data

Stock Info as of Nov 4, 2005

Total Return on Investment • Suncor’s return to shareholders has outperformed the TSX Integrated Oils and the S&P 500. • An investment of $100 in Suncor on December 31, 1992 – the year it became publicly traded – would have grown to more than $2, 538 by the end of 2004

Fisher Approach 1. Functional Factors: • • 2. People Factors: • • 3. Experienced managers and directors Maintain a steady core of expertise – all projects are managed by Suncor’s internal engineering, procurement and construction management Essential Business Characteristics: • • 4. High quality resource base - estimated to contain the raw materials to produce a potential 11 billion barrels of conventional crude oil One of the lowest cost producers in North America Strong competitive position Integrated Company Value of the Stock: • • 9% below the 52 week high and 43% above the 52 week low High PE ratio

Recommendations BUY

ENCANA by Vincent Prasetio

Encana’s Agenda • • • History and Background Current Event Management Company overview Core Business Unit Corporate Value Drivers Reserves Risk Management Financial Statement Analysis

History and Background • In 2002, merger agreement was reached between two energy company: – Alberta Energy (AEC) – Pan. Canadian Energy (PCE) • Alberta Energy is created by the government of Alberta in 1975 – By 1993 Alberta government sold the entire ownership to make AEC as the public owned company – By 1995, AEC put its growth strategy on oil and gas after selling off all other resource investment. – By 2001, AEC has become the largest natural gas producer and also largest independent operator of gas storage.

History and Background • Pan. Canadian was created by Canadian Pacific and gas company in 1958 – Pan. Canadian roots go back to the construction of the nation first transcontinental railways – Canadian Pacific Railways made natural gas discovery in 1883 and later create Canadian Pacific and gas company in 1958 which later create Pan. Canadian in 1973 – In 2000, Pan. Canadian launches one of the continent largest CO 2 miscible flood project at Weybury, Saskatchewan • In 2002, Gwyn Morgan and David O’Brien announced the merger agreement between AEC and Pan. Canadian. – Each AEC Share was converted to 1. 472 Pan. Canadian Share. – On April 8, Encana begin trading on the TSX and NYSE under the symbol ECA. Its enterprise value now is around 52 billion.

History and Background http: //www. encana. com/whoweare/history/index. html

Current event • Encana to sell its Natural gas liquid business for US 586 million • Encana CEO step down at year end; COO Randy Eresman continue to succeed • Encana third quarter cash flow reaches US 1. 93 billion or $2. 20 per share up 51 % • Speculations of takeover rumor by Royal Dutch Shell

Management Team • Gwyn Morgan, President and CEO – In 1994, he was appointed as the president and CEO of Alberta Energy Company – Has joined AEC for over 35 years and has a lot of experience in oil and gas exploration, production and pipeline – Responsible for establishing Encana as the high performance benchmark – Will step down as CEO in 2006 and continue work as the executive vice-chairman • Randy Eresman, VP and COO – Key Architect of the company North American’s resource play strategy – Has over 25 years of career experience with Encana and AEC – Will step up and taking the role as the new CEO in 2006 • Brian Ferguson, VP for corporate development – has 21 years of experience in the oil industry – Key in providing expert of business development and communication advice on company major transactions and event • John D Watson, VP and CFO – Directly responsible for capital market, and financial risk management – One of the architect behind the merger that forms Encana – Has over 30 years of experience in financial experience

Company Overview • Mission Energy for People • Vision En. Cana will be the world's High Performance Benchmark independent oil and gas company. • Constitutional Meritocracy En. Cana is a company where shared principles guide our behaviour and merit determines our reward • Our Shared Principle Strong Character, Ethical Behaviour, high performance, great expectation, Dynamic and discipline.
 Focus its company operation on Resource Play compared")
Company Overview • Business Strategy: 1) Focus its company operation on Resource Play compared to the vast majority that is in search of new conventional field.

Company Overview. Business Strategy

Company Overview– Business Strategy 2. Divesture of conventional asset and International operation other than North America Asset to be divestured in 2005: - Gulf of Mexico 2. 1 billion (closed) - Canadian conventional 326 million (closed) - Ecuador 1. 42 billion will close at Q 4 2005 - Natural Gas Liquid Business Targeted for Q 4 of 2005 - Gas Storage Business Targeted for Q 1 of 2006

Company Overview— Business Strategy 3 Acquisition • Acquisition Tom Brown Inc to strengthen the asset position for $2. 7 billion to increase Net Asset Value of share • This acquisition align with the resource play strategy • Tom Brown Inc appear to be undervalued by the appraisal compared to the potential resource calculated by unconventional way

Company Overview— Business Strategy • Acquisition and Capital Investment • Since 2002: • Has invested 6. 3 billion in key resource development • Invested 4. 3 billion in property and corporate acquisition

Company Overview— Business Strategy 4 Improve Technology Current Technology - CO 2 Miscible Flood Ex : Weyburn Project - Coalbed Methane
 - GL-Dhows allow to separate gas and")
Company Overview— Business Strategy 4. Technology (continued) - GL-Dhows allow to separate gas and liquid; oil and water - SAGD
 • Midstream and")
Core Business Units • Upstream (Natural gas, Crude Oil and NGL) • Midstream and marketing( Natural gas storage, natural gas liquids extraction and power generation • Corporate

Upstream operation • Upstream income increase by 30% compared to increase of 87% from 2002 to 2003 • North Amercian Production and mineral taxes for produced gas increased 76% in 2004 compared to 2003 primarily due to increased in natural gas prices and volumes in US and higher effective tax rate on production growth in Colorado

Midstream and Market Optimization • Revenues and purchased products expense in this sector increased in 2004 compared to 2003 result due to increases in commodity prices • operating cash flow increase 68 million in 2004 as a result of improved margin from natural gas liquids and gas storage optimization

Corporate • Revenues happen to be losses since there is unrealized mark to market losses related to financial and commodity contract • While the interest expense increase drastically because of higher outstanding debt level during the purchase of TBI

CAPEX Summaries • The CAPEX is increasing by 22% compared to 24 % from 2002 to 2003. • The increasing CAPEX in upstream and acquisition is offset by disposition some of the asset

Corporate Value Drivers • Increase production capacity from existing assets. • Reduce operating costs of existing assets through economies of scale and by upgrading process technologies. • Increase reserves (asset base) by pursuing new developments.

Reserves Resource Play • 10 Key Resource Play

Proved Reserves

Reserves Resource Play 1. Greater Sierra

Reserves Resource Play 2. Cutbank Ridge

Reserves Resource Play • Coalbed Methane

Reserves Resource Play 4. Shallow Gas

Reserves Resource Play 5. Jonah

Reserves Resource Play 6. Piceance

Reserves Resource Play 7. Fort Worth 8. East Texas

Reserves Resource Play 9. Foster Creek

Reserves Resource Play 10. Pelican Lake
 •")
Risk Management • Financial (commodity price, foreign exchange, interest rate & credit risks) • Operational • Environmental, health, safety and security • Reputational

Risk Management – Commodity Price Risk • Lock in near term ROI • Downside protection for Cash flow • Combination of fixed price swaps & put options

Stock Information • Stock is traded in NYSE and TSX • Its symbol is ECA and ECA-T for TSX
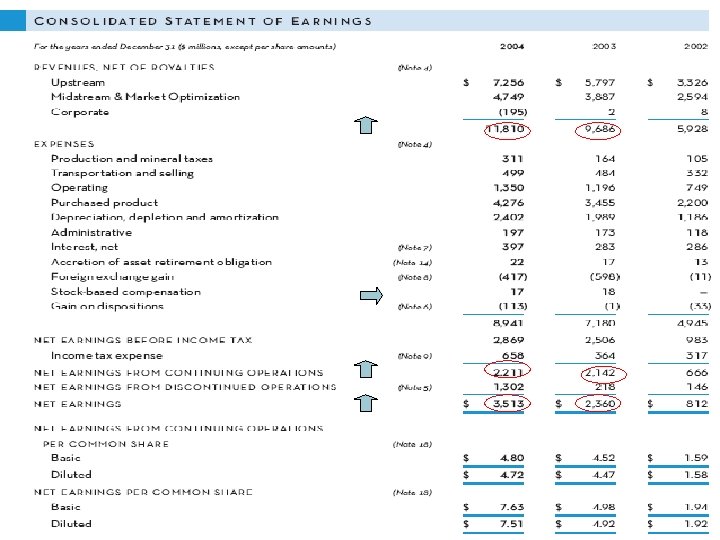

Analysis of Income Statement • Net Earning from Continued Operation is increase by 3% to 2. 2 from 2. 1 • Its large net income in 2004 is basically earned from the discontinued operation income 1. 3 billion compared to 0. 2 billion in 2003 • Maintain a steady based stock compensation 17 million and planning to reduce the number of stock based compensation
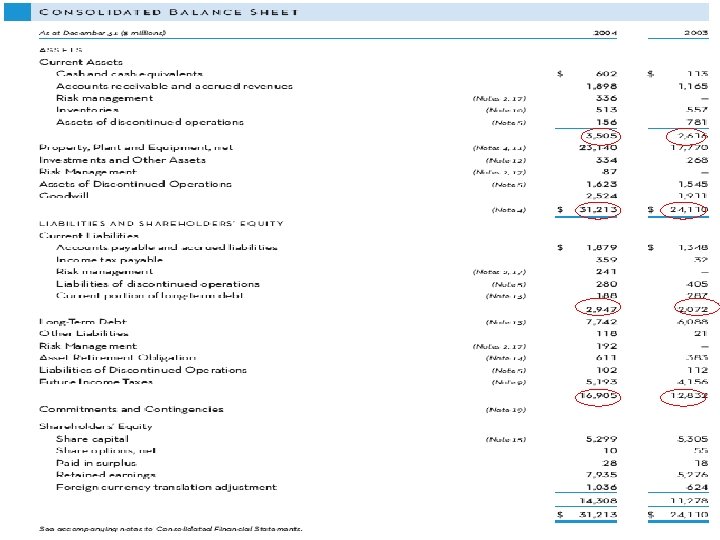

Analysis of Balance Sheet • 50% of its asset were financed through Debt and the other 50% through shareholder Equity • Its liquidity level to pay its current debt is high 1. 18 compared to 1. 26 in 2003 • Number of debt outstanding increased by 1 billion caused of the purchase of TBI must be accommodated by borrowing • Property, Plant and Equipment is increased by 30% from 17, 770 to 23, 140 million
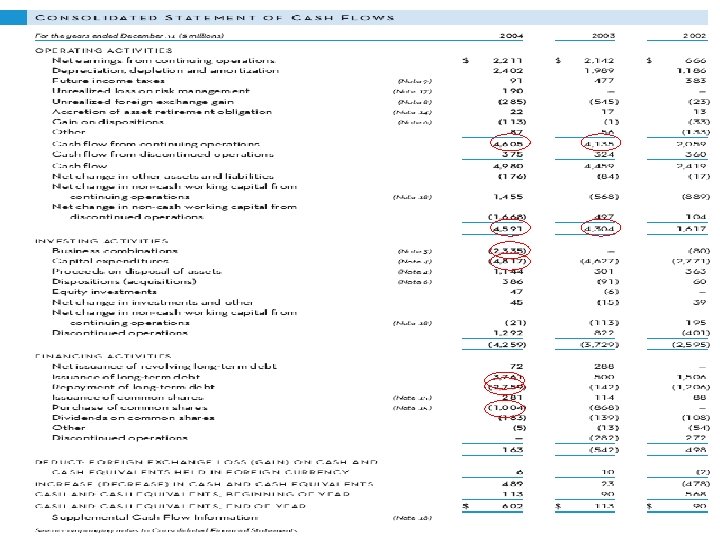

Analysis of Cash Flow • Cash Flow from Continuing operating Increased to 5. 0 billion from 4. 5 billion (up 11%) • While Cash flow from operating is 4. 5 billion compared to 4. 3 billion (effect of discontinued operation, other change in asset and liabilities and non cash working capital) • Free Cash Flow = 4. 5 – 2. 3 – 4. 8 = -2. 6 billion • They Maintain a steady investment on CAPEX while buying Tom Brown Inc as their business combination. • They are paying an increasing dividend by (32%) and purchase a number of shares

Financing Activities

Stock Performance: three year Chart Encana

Stock Performance: 1 -year Chart Encana VS S&P 500 Energy

Brokerage House and My Recommendation Buy: 1. Company is the leader in the natural gas industry and also in the natural gas storage 2. Strategy to focus on unconventional reserves and North America produce lower operation cost than the increasing cost in Europe and also higher rate of reserves in the future 3. New CFO will step up as the CEO understand the company operationally and financially will result in higher return investment made
- Slides: 162