Canadian Oil and Gas November 12 2005 Presented

Canadian Oil and Gas November 12, 2005 Presented by Helen Wei Ricky Kam Kyle Wu Xiao Lu Wang

Overview • Industry Analysis • Canadian Natural Resources • Imperial Oil • Suncor

Industry Overview • 9 th largest oil producer- 3. 1 million barrels per day (2004) – Moving up the list quickly with oil sands production increasing • • 3 rd largest natural gas producer-- 6. 6 trillion cubic feet (2002) Summary of data of industry #1 supplier of oil and gas imported of US Important segment of Canada’s economy in terms of investment, trade, income, and employment – accounts for 1. 3% of Canada’s gross domestic product • Major production provinces: – Alberta, British Columbia, Saskatchewan, Nova Scotia, and Newfoundland

Newest Data July 2004 July 2005 thousands of cubic metres July 2004 to 2005 % changes Crude oil and equivalent hydrocarbons Production 12 662. 5 12 188. 8 -3. 7 Exports 8 056. 3 7 758. 5 -3. 7 Imports 4 682. 2 4 841. 0 3. 4 Refinery receipts 9 634. 3 9 481. 7 -1. 6 Marketable production 13 712. 7 13 939. 6 1. 7 Exports 8 784. 1 9 222. 7 5. 0 Canadian domestic sales 3 838. 3 3 792. 4 -1. 2 Natural gas

Types of Oil • Conventional Oil – Light/Medium crude – Heavy crude – Pentanes • Oil Sands – Bitumen – Synthetic • Offshore

Oil: Production & Consumption • Source: International Energy Agency
 • Source: International Energy Agency")
Oil: Exports (US) • Source: International Energy Agency

Gas: Production & Consumption

Sources of Natural Gas

Three Components • Upstream – Exploration and Production • Midstream – Pipeline, Transportation and Storage • Downstream – Refining, Marketing and Retailing

Companies • • • Canadian Natural Resources Limited En. Cana Husky Energy Imperial Oil Nexen Petro-Canada Shell Canada Suncor Energy Syncrude Canada Talisman Energy

Factors influence demand &Supply • Geopolitics – energy independence • Economics – high oil & gas prices depressing growth • Environment – regulation • Politics -- war

Demand Global demand for energy is predicted to increase 9% annually.

Global Primary Energy Demand • Source: OECD

Demand for Oil

Global Oil Import Dependency

Crude Oil Price • Source: OECD

Demand for Natural Gas

Supply: Oil supply will increase at 1. 8% p. a. Gas supply will increase at 2. 8%

Recent Prices for Oil and Gas

Industry Environment in Canada • • • Economics Regulation Competition Technology/Equipment support Cost advantages Resources

Economy in Canada • • • GDP Unemployment Rate Productivity Exchange rate Business Revenue

Growth in Real GDP in G-7 Countries

Unemployment and participation Rates

Labor Productivity

Average Private Sector Projections of Budgetary Revenues

Regulatory Framework Navigable Waters Protection Act Migratory Birds Convention Act Aboriginal Land Claims TDG Act Federal Fisheries Act Species at Risk Act Oceans Act Canadian Environmental Assessment Act Marine Conservation Act Canadian Environmental Protection Act Canada Shipping Act Canadian Oil and Gas Operations Act NEB Act Canada Petroleum Resources Act Mackenzie Valley Resource Management Act
 Oil (Thousand barrels/day) Gas (Million tonnes oil equivalent) 1 Saudi Arabia 8,")
Competition (2002) Oil (Thousand barrels/day) Gas (Million tonnes oil equivalent) 1 Saudi Arabia 8, 711, 000 1 Russia 530. 2 2 Russia 7, 286, 000 2 United States 488. 6 3 Iran 3, 804, 000 3 Canada 164. 5 4 Mexico 3, 590, 000 4 United Kingdom 86. 3 5 Norway 3, 408, 000 5 Iran 77 6 China 3, 300, 000 6 Algeria 73. 8 7 Canada 2, 738, 000 7 Norway 70. 6 8 Kuwait 2, 270, 000 8 Indonesia 66

Cost Advantages • Lowest investment cost to set up and operate companies • Most generous tax treatment for R&D operation • Competitive and profitable business environment – – Streamlined approval process Highly skilled workforce Efficient transmission and storage system Access to processing and marketing infrastructure. • Royalty regime for oil sands

Technology and Services • High quality Canadian technologies, products, and services enjoy international competitive advantages. • Canada ranks: – 1 st in the world in the development of specialized oil sand extraction equipment – 1 st for treatment of sour gas – 2 nd for advanced drilling technologies, such as underbalanced and horizontal technologies, offshore drilling modules, and winterized drilling rigs – 2 nd for enhanced automated techniques, such as computer-controlled automatic coring devices and automated pipe-handling systems

Equipment & Services • Canada is a world leader in the supply of oil and gas equipment • Canada’s recognized world-class services include: – pre-drilling services, including geophysical contractors; – drilling services, including mud, cement, logging, testing, coring, and fishing services; – well-completion services, including perforating and stimulatingservices, workover services including coiled tubing; – wireline services, including placing of down-hole instrumentation; – logistics management, including tanker operations, supply vessels and offshore helicopter services; – offshore engineering and project management; and – other services such as firefighting and diving

Resources • Oil reserves 180 billion barrels – 2 nd in the world • World largest oil sand reserves – 30%(2000) – 50%(by the end of the decade) – 3/4 (2025) • Offshore reserves just begun to be tapped: Great Potential • Close to US

Oil Reserves

Natural Gas Reserves

Gas Reserves
 – Caused by use of fossil")
Environment Issues • Green House Gas Emission (GHGs) – Caused by use of fossil fuels and include carbon dioxide (CO 2), methane (CH 4) and nitrous oxide (Nox) – Emitted in the gas pipeline system due to increase in volume shipped – Cause change in climate • Sour Gas – H 2 S is toxic to humans and animals at very low concentrations • Flaring – the burning of waste gases to dispose of unwanted or unusable volumes of gas, to depressure gasprocessing equipment for maintenance – risk to human health and the environment, and wasteful

About the Company • Incorporated in November 7, 1973, in Alberta • “… is a senior oil and natural gas exploration, development and production company…” • Ranked 16 th in profit, 39 th in revenue, 28 th in assets in Business Magazine Top 1000 Ranking

Security Information • Publicly traded in Toronto Stock Exchange and New York Stock Exchange • Ticker Symbol: CNQ • As of 1: 22 pm, November 11, latest price of CNQ -T was $55. 10, CNQ-N was $46. 40 • 52 week low and high: $22. 75 – $60. 00

Management • CNQ’s mission statement: “To develop people to work together to create value for the Company’s shareholders by doing it right with fun and integrity. ” • Focus on four key per share metrics: production, reserves, cash flow and NAV • Maintain transparent financial reporting

Officers • Allan P. Markin – Chairman of the Board • John G. Langille – President • Steve W. Laut – Chief Operating Officer • Douglas A. Proll – Chief Financial Officer – Senior Vice President, Finance

Strategy • Sustainable development with technology and land • Strong geological knowledge to help exploitation in new regions
 and offshore")
Strategy • Low risk growth projects in western Canada, North Sea (England) and offshore West Africa (Ivory Coast) • Key component: use excess cash flows from unexpected higher commodity prices to “selectively acquire properties”

Affiliation • Acquired Sceptre in 96, Ranger in 2000, Rio Alto Exploration in 02, Canadian heavy crude oil resource properties in 04 • Own two incorporated subsidiaries in Alberta, two in England one in Ivory Coast • Partners with many Alberta-based resource companies, including Cold Lake Pipeline Ltd.
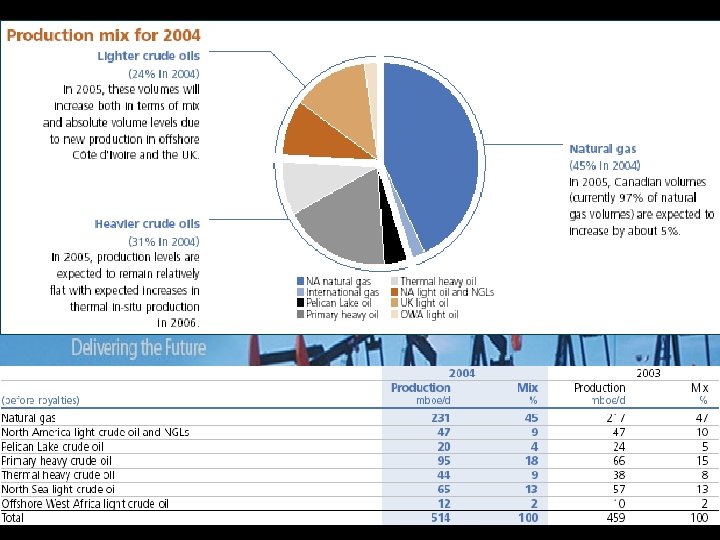

Resources

Resources – Horizon Oil Sands • CNRL owns 100% of the 116, 595 acres of the Athabasca Oil Sands area of northern Alberta • Company expects 110 K barrels/day in 2008, 155 K barrels/day in 2010, and 232 K barrels/day in 2012

Product Prices

Daily Production

Resource Reserves

Hedging Against Oil Prices Entered into puts with way too low strike prices…

Hedge Results Loss resulted from hedging with contracts, effectively dropped the average price

Capital Expenditure

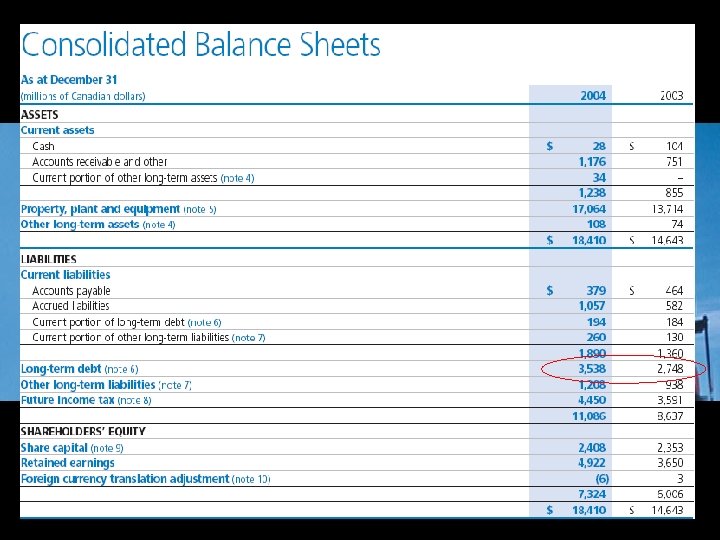
Debt Use • Increased long term debt of $790 million from 2003 to 2004 • Company’s debt securities are rated “Baa 1” by Moody’s, “BBB+” by S&P, and “BBB(high)” by Dominion

Biggest attraction is the growing operating cash flow and dividend payout since 2001

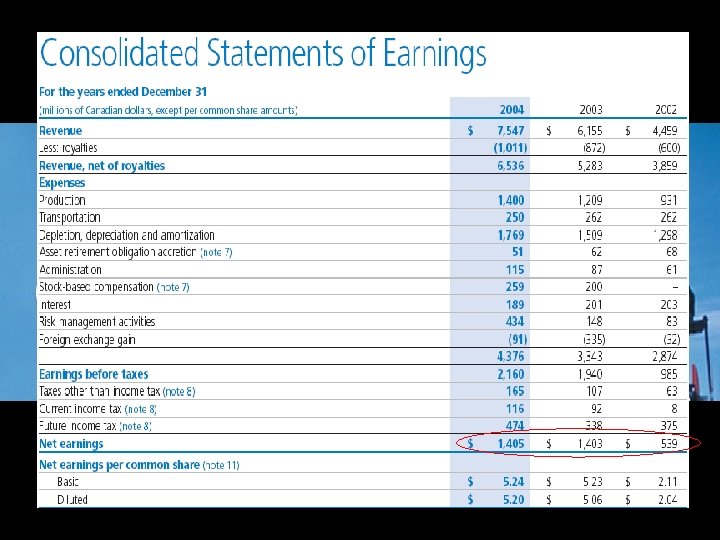
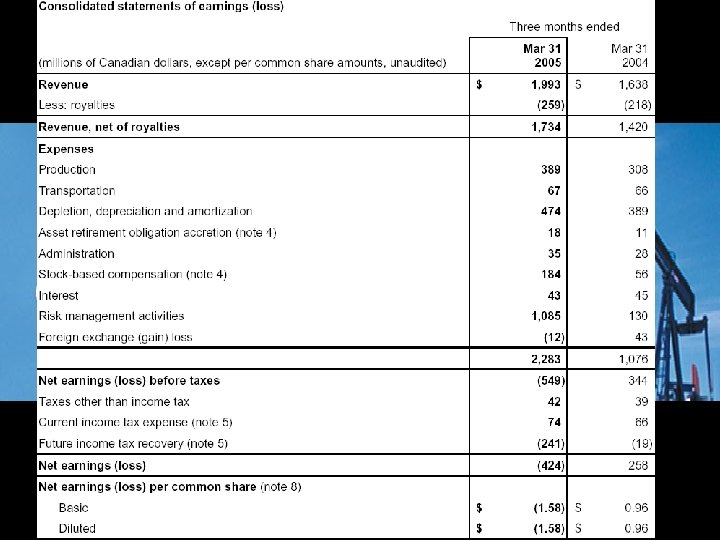
Time Series of Revenue

Time Series of Net Income

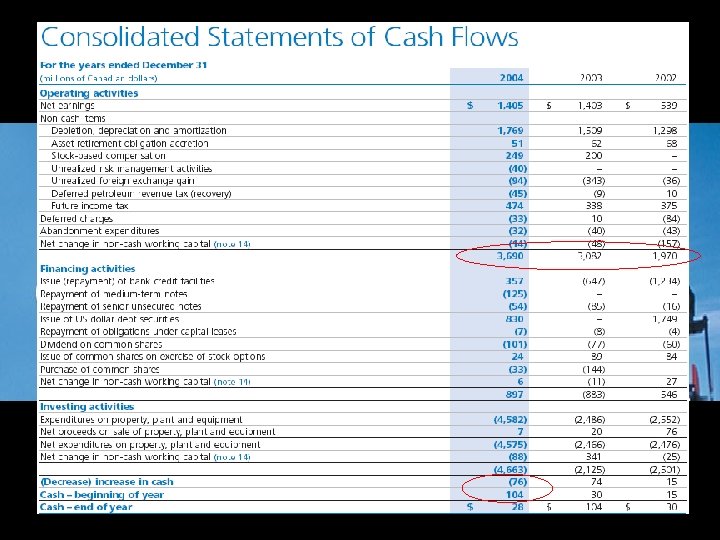
Time Series of Cash

Quarterly Financial Highlights $ millions 2005 Q 2 2005 Q 1 2004 Q 4 2004 Q 3 2004 Q 2 2004 Q 1 Revenue 2164 1993 1969 2075 1865 1638 Net Earning 219 -424 577 311 259 258 Per Share 0. 41 -0. 79 2. 15 1. 16 0. 97 0. 96 OCF 1136 1009 950 1041 930 848 Per Share 2. 12 1. 88 3. 54 3. 88 3. 47 3. 16

Financial Ratios CNRL Industry P/E 9. 68 6. 20 Price to Book 4. 23 3. 30 Profit Margin 6. 81% 7. 20% ROE 7. 6% 32. 5% Div. Yield 0. 0042 0. 03

Share Capital • As of September 2005, 536, 717, 000 shares outstanding • 2 to 1 stock split in May 2005 • Issued 1, 591, 000 shares in 2004 for $24 million • Repurchased 873, 400 shares at the end of 2004 for $33 million (avg. $38. 01/share) • Paid out $107 million in dividend in December 2004 ($0. 40/share)

DCF Valuation • Market interest rate is approximated by weighted average of interests CNRL pays for its long term debt: 5. 21% • Estimated growth rate with dividend: 3. 48% • P(0) = 13. 66, P/E = -17. 97 (This is WRONG!) • P(-1) = 11. 56, P/E = 2. 21 • Market price = 56. 75, P/E = 9. 68 • Extremely overvalued because of unrealistically simple model

1 Year Stock Price vs. S&P/TSX Energy

5 Year Stock Price vs. S&P/TSX Energy

1 Year Stock Price vs. AMEX Oil Index

5 Year Stock Price vs. AMEX Oil Index
 • Continually growing dividend payout")
Recommendation • Sustainable and relatively risk less growth (Good) • Continually growing dividend payout (Even better) • Unstable earning in 2005 due to large risk management loss (Bad) Hold for now, potential buy in 2006

About Imperial Oil • Incorporated in 1880 • Traded on Toronto Stock Exchange, American Stock Exchange

Management • Enhance shareholder value through “Consistent Management Approach” • Emphasis on 4 corporate priorities: – Operational Excellence – Growing Profitable Sales Volume – Achieving and maintaining a best-in-class cost structure – Improving the productivity of the asset mix
 Fischer • T. J. (Tim) Hearn – Chairman, President")
People • B. J. (Brian) Fischer • T. J. (Tim) Hearn – Chairman, President and CEO – Joined Imperial Oil in 1967 • P. A. (Paul) Smith – Controller and Senior Vice President, Finance and Administration – Joined Imperial Oil in 1980 – Senior Vice President, Products and Chemicals Division – Joined Imperial Oil in 1968 • R. L. (Randy) Broiles – Senior Vice President, Resources Division – Hasn’t been with Imperial for long, but joined Exxon Mobil in 1979.

Strategy • Strong results due to: – Business model that focuses on long-term. – Industry leading returns on capital – Focus on operational excellence

Affiliation with Exxon Mobil • Exxon Mobil owns 69. 6% of Imperial’s outstanding shares. • International exposure gained through this relationship. • Abundant access to technologies, leverage, lowercost global locations, etc.

Resources Segment • Almost 20% of Canada’s oil sands production in 2004. • Major leaseholder in Alberta’s oil sands. – 460, 000 acres worth of land holdings • Supplies Canada and U. S. with natural gas from Western Canada and the Nova Scotia offshore • Exploration licenses off Canada’s East Coast.

Resources– Cold Lake Operations • Wholly owned operation in Cold Lake. • One of the largest thermal heavy-oil-recovery operations in the world • Increasing royalties to be paid to lessor – the Province of Alberta

Resources – Other Oil Sands • Actively exploring for new resources. • Owns resources that aren’t currently reachable – Actively engaged in research and studies to access these resources
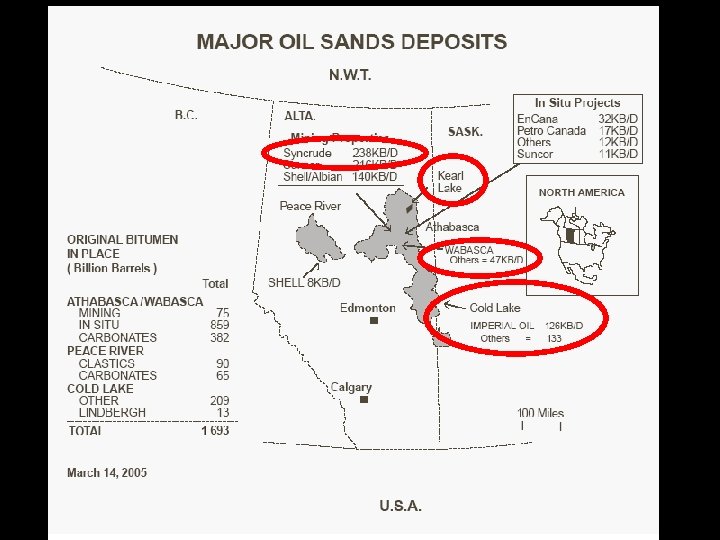

Resources – Syncrude • Joint venture in shallow tar sands deposits • Imperial owns 25% – 2 nd largest holding – Imperial receives ~58, 900 barrels per day from net production • Recent investment in expansions and upgrades will more than double daily production.

Resource Segment • Record net income in 2004 – Would have been higher, but: • Lower Cold Lake bitumen production • Fewer tax benefits • Higher Canadian Dollar

Resource Segment - Growth • Sustainable growth opportunities present: – Proved reserves of 1. 7 billion barrels – Non-proved reserves of 11. 5 billion barrels – 2004 oil and gas production was 115 million oilequivalent barrels
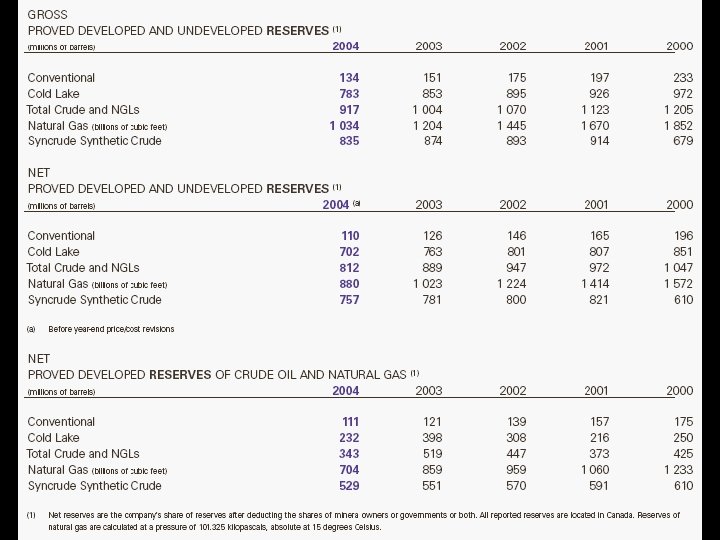

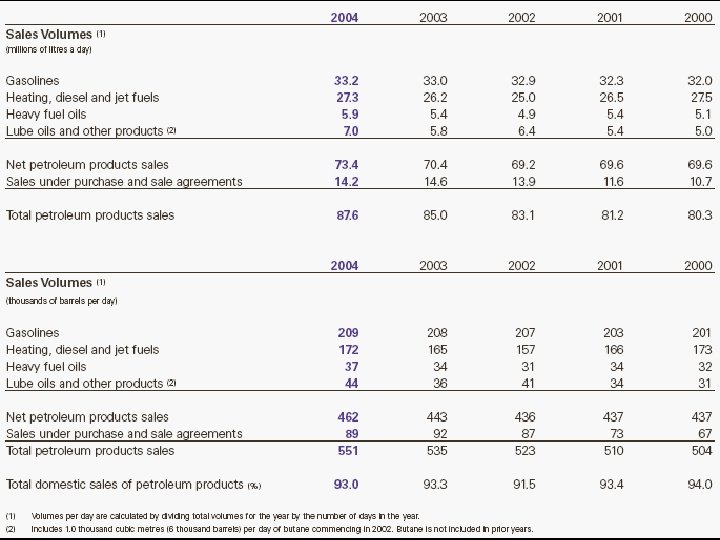
Products and Chemicals • Products segment operates combined capacity of 502 • Canada’s largest refiner kb/d of petroleum and marketer of petroleum products. • Products and Chemicals Division manages petroleum products and chemicals businesses. • Markets 700+ petroleum products under brand names including “Esso”. – 2, 000 Esso service stations – 100 commercial facilities – 3 urban home heating operations.

Products and Chemicals • Chemicals segment products: – primary petrochemicals – plastic resins – aliphatic and aromatic solvents. • Largest market share in North America for rotational molding polyethylene applications. • Second largest North American market share for injection molding applications.

Products and Chemicals

Products and Chemicals

Summary of Quarterly Financials Q 1 Q 2 Q 3 5, 958 6, 802 7711 Net Income 393 539 652 EPS (Basic) 1. 13 1. 56 1. 92 EPS (Fully Diluted) 1. 12 1. 56 1. 91 Dividends per share 0. 22 0. 24 Operating CF (57) 827 1, 385 Investing CF (297) (249) 376 Financing CF (388) (551) 638 Current Assets 3815 3893 4695 10, 189 10, 300 10468 Current Liabilities 5, 164 4840 5741 Other Liabilities 2, 511 3041 3093 Common Shares 1, 795 1774 1759 Earnings Reinvested 4, 902 4906 4938 Revenue Other Assets


Financials - Ratios Imperial Industry Price/Earnings 18. 96 6. 20 Price/Book 6. 02 3. 30 Net Profit Margin (last quarter) 8. 62% 7. 20% ROE 32. 12% 32. 5% Dividend Yield 0. 01 0. 03

Time Series of Financials - Revenue

Time Series of Financials – Net Income

Time Series of Financials - Cash

Uncontrollable Risks

Uncontrollable Risks Not hedged against oil prices

Shares repurchased Increasing share price and Income per share Consistently increasing dividends per share

Shareholder Value
")
Shareholder Value • Started first buyback program in 1995: – Repurchased ~40% (233 m) outstanding shares since – 14 million shares repurchased in 2004 • $872 million worth • Dividends paid for over 100 years – 88 cents per share in 2004 – Increased dividends for ten consecutive years • Consistent triple-A credit rating by S&P – Only Canadian Industrial with this rating

Shareholder Value • Average shareholder return of almost 20% per year for the last decade.

5 Year Stock Price vs. S&P/TSX Energy

5 Year Stock Price vs. AMEX Oil Index

1 Year Stock Price vs. S&P/TSX Energy

1 Year Stock Price vs. AMEX Oil Index

DCF Valuation Gordon Growth Model: • k = 3% • Estimated g from EPS: 60% – Probably not sustainable • Estimated g from dividends: 2. 4 % • P = 150. 19 • P/E = 26. 12 • Actual price around $106 • Actual P/E about 17 -19 • Undervalued? – Simple model – Unrealistic assumptions?

Conclusion • Sustainable growth • Affiliation with Exxon Mobil • Globally rising energy needs • Great historical performance Buy
")
TSX, NYSE (Ticker: SU)

Suncor Agenda • • Business background Business strategy Management team Core business segment Financial statement analysis Stock performance Recommendation

Company background • A growing integrated energy company • History: ü 1919 - Sun company was established with its first office opened in Montreal. ü 1979 - Suncor Inc. formed due to amalgamation of all the Canadian operations. ü 1992 - Suncor became a publicly traded company. ü 1997 - Traded in NYSE (SU) Name changed to Suncor Energy • Headquarter: Calgary, Alberta. • Full time employees: 4, 605

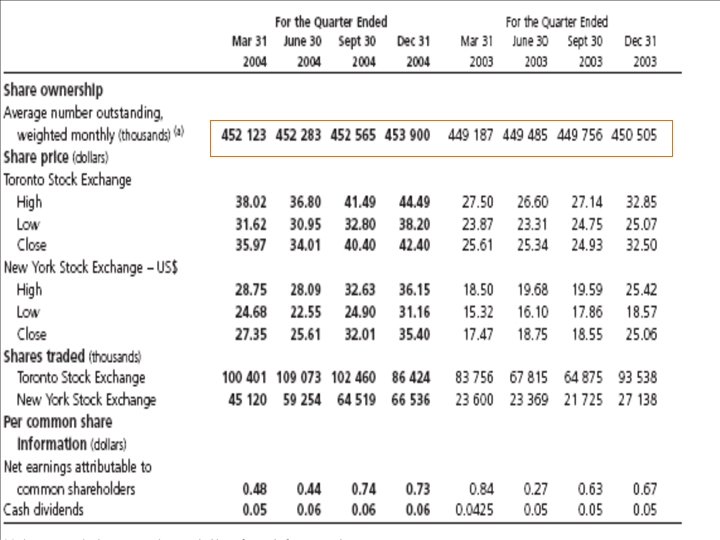
Current Stock Information • As of Thursday, November 10 ü Symbol: SU ü Exchange market: TSX ü Previous Close: 65. 25 CAD ü 52 week range: 38. 20 - 73. 25 CAD ü Avg Vol: 1, 954, 234 ü # shares outstanding as of Sep 30, 2005: 457, 287, 881

Business Strategy • ü ü ü Focus: Develop huge resource of Canada’s Athabasca oil sands Three-Fold strategy (operation) Multiple sources of bitumen supply Staged approach to expanding the upgrading technology Integrate the products into the growing North American marketplace • Financial side: ü Strong balance sheet --- annual debt repayment

Management Team • Richard L. George – President, CEO - 14 year experience as a director • J. Kenneth Alley -Sr. VP, CFO - 21 experience at Suncor

Management Team • Steven W. Williams - Exec VP, Oil Sands - Over 20 year experience in international energy industry • David W. Byler - Exec VP, Natural Gas & Renewable Energy - Joined Suncor in 1979 • Thomas L. Ryley - Exec VP, Energy Marketing and Refining - Canada - Joined Suncor in 1983 • M. (Mike) Ashar - Exec VP, Refining and Marketing - U. S. A. - Joined Suncor in 1987

Core business segments • • Oil sand Natural gas Renewable energy Refining and marketing (Canada & US)

Oil Sand • Suncor’s fundamental business unit • Located near Fort Mc. Murray, Alberta • 2004 - work to expand Oil sands production capacity to 260, 000 bpd continued on schedule and budget • Planned to increase production capacity to 350, 000 bpd in 2008 • In January 2005 - a fire at Oil Sands damaged Upgrader 2. ü Production at Oil sands reduced until Q 3

Quarterly Net Earning

Natural Gas • Based in Calgary and operated in Western Canada ü Providing revenues ü Serve as a price hedge against the company’s internal consumption at oil sand refining operation

Energy Marketing and Refining • Canada ü Products from Sarnia, Ontario refinery are sold to commercial customers in Canada and US • US ü Connect Suncor to industrial, commercial and retail markets in the US Rocky Mountain region. ü Lead Suncor’s efforts to further expand into the growing US energy market. q In 2004, expansion and upgrades of the company’s Sarnia and Denver refineries were launched.

Net earning from operation

2004 Net Earning Breakdown

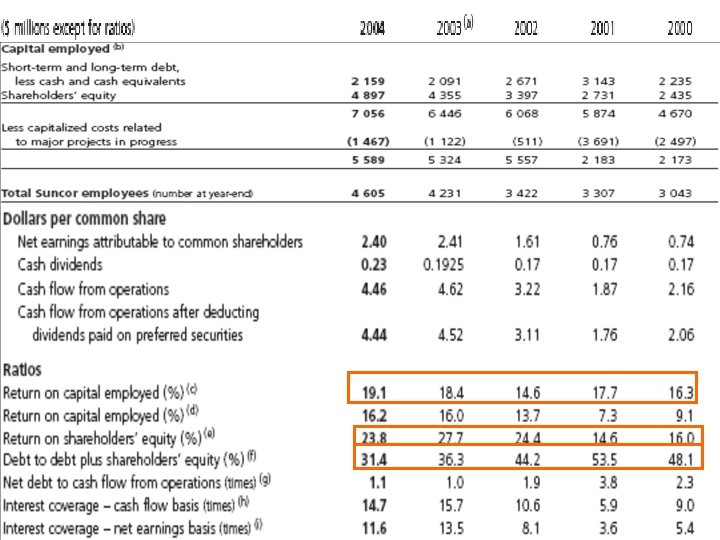
2004 Capital employed breakdown

Financial Statement Analysis • Income Statement

Quarterly summary 3 Quarters of 2005 Q 1 Q 2 Q 3 2061 2, 380 3, 142 Net Income 174 112 341 EPS (Basic) 0. 22 0. 24 0. 75 EPS (Fully Diluted) 0. 21 0. 24 0. 73 Dividends per share 0. 06 Revenue Operating CF 255 554 401 Investing CF -615 (903) (836) Financing CF 311 358 472 1480 1516 1896 11111 11, 925 12, 652 Current Liabilities 1578 1818 1, 949 Other Liabilities 5983 6478 7, 154 Common Shares 684 707 723 4, 346 4438 4, 722 Current Assets Other Assets Earnings Reinvested
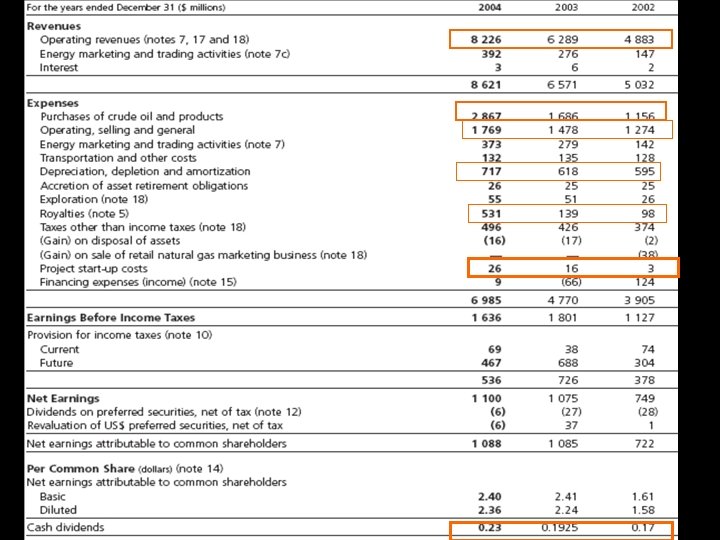

Earnings Total Revenue Net Income EPS Basic EPS Diluted 2004 2003 2002 8226 6289 4883 1100 1075 749 2. 40 2. 41 1. 61 2. 36 2. 24 1. 58

Expense decomposition

Expense • Operating selling and general ü 12 month R&M in 2004 compared to 5 month in 2003 ü First year of in-situ operation ü Higher energy cost ü Higher compensation • Depreciation • Royalties ü Based on current long term assumption, 25% continue in future years

Oil Sand • Net earning increased: ü Higher benchmark commodity price ü Higher sales volume ü Offset the loss due to fire

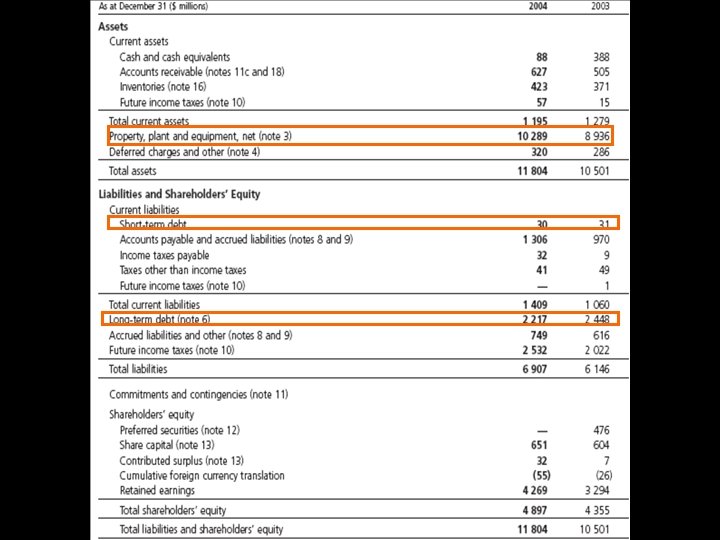
Financial Statement Analysis • Balance Sheet

Financial Statement Analysis • Statement of cash flow

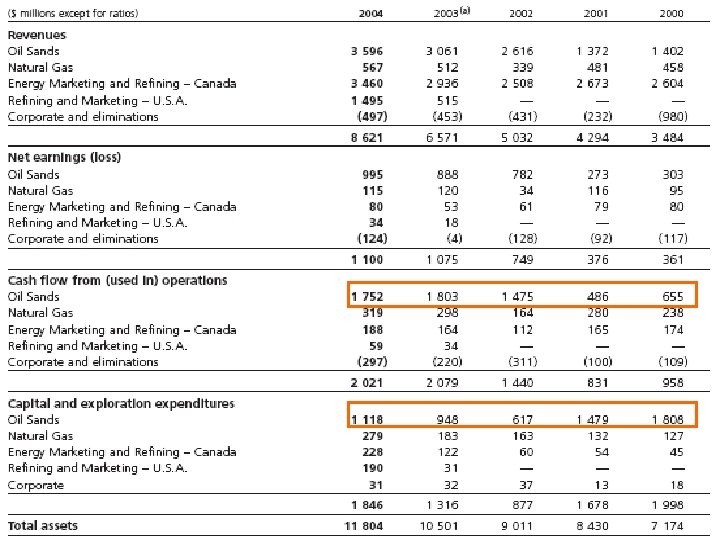
Cash flow from operation

Ratios Suncor Industry Price/Earnings 30. 5 6. 20 Price/Book 5. 46 3. 30 Net Profit Margin 9. 98% (last quarter) ROE 32. 12% 7. 20% Dividend Yield 0. 03 0. 004 32. 5%


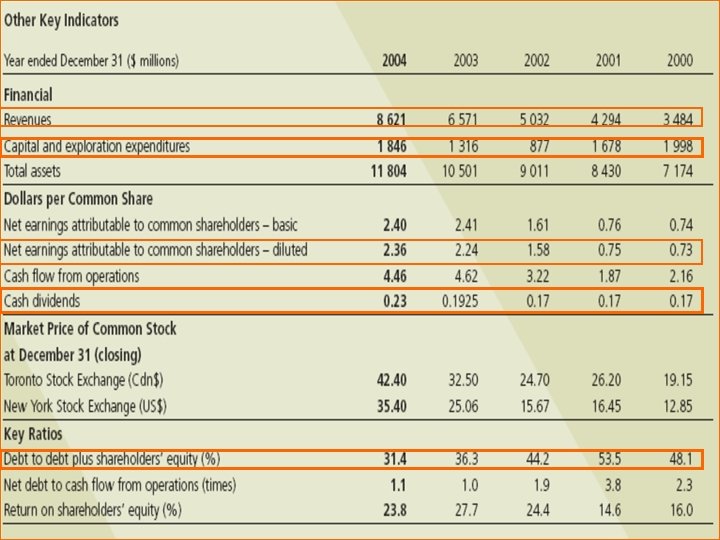
Trend analysis • 2000 -2004

Time Series of Financials - Revenue

Time Series of Financials – Net income

Time Series of Financials - Cash
 ü")
Risk & Success factors • Commodity price • Exchange rate (CAD / USD) ü In 2004, $74 million after tax gain solely due to exchange rate • Environmental regulations • Extreme winter weather • Stakeholder support for growth • Regional labor issue

Financial hedging activity • Interest rate swap at Dec 31, 2005

Sensitivity Analysis

1 Year Performance

5 Year Performance

Recommendation Hold

Summary: Financial Ratios CNRL Suncor Imperial Industry P/E 9. 68 30. 50 18. 96 6. 20 Price to Book Profit Margin ROE 4. 23 5. 46 6. 02 3. 30 6. 81% 9. 98% 8. 62% 7. 20% 7. 6% 18. 72% 32. 12% 32. 5% 0. 004 0. 01 0. 03 Div. Yield 0. 0042

Summary: Recommendations Company Recommendation Canadian Natural Resources Hold Imperial Oil Buy Suncor Hold
- Slides: 158