Canadian Bioinformatics Workshops www bioinformatics ca Module Title

Canadian Bioinformatics Workshops www. bioinformatics. ca

Module #: Title of Module 2

Module 3 Metabolite Identification and Annotation – Part II David Wishart Informatics and Statistics for Metabolomics May 3 -4, 2012

Goal of Metabolite Annotation ppm 7 6 5 4 3 2 1
 Mixture Compound A Compound B Compound C")
Metabolite ID by Spectral Deconvolution (NMR) Mixture Compound A Compound B Compound C
 Auto. Fit (automated fitting) Metabo. Miner")
Alternatives to Chenomx • • • AMIX (Bruker) Auto. Fit (automated fitting) Metabo. Miner (2 D NMR) HMDB (NMR spectral match) PRIMe Spin Assgn (NMR spectral matching server) • r. NMR and BRMB Peaks Server • CCPN-MP

Auto. Fit - Automated NMR Profiling
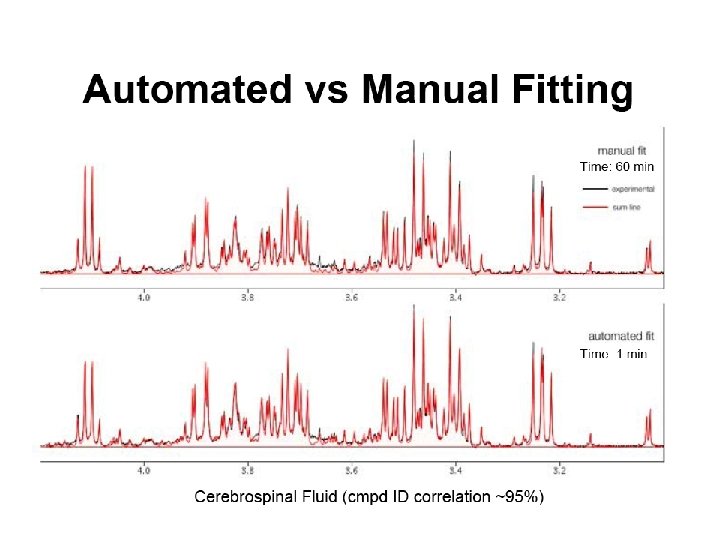
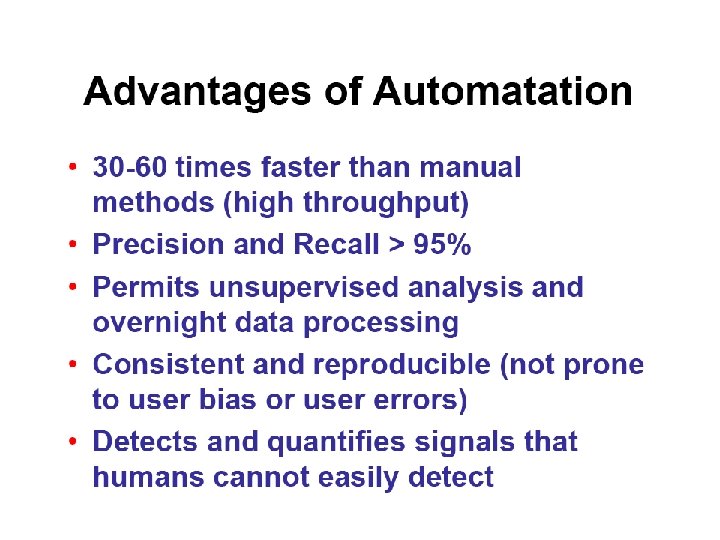

Performance of Autofit Synthetic Real P. Mercier et al. J Biomol NMR. 2011 Apr; 49(3 -4): 307 -23

NMR Compound ID from Mixtures - Metabo. Miner ID’d Compounds Raw TOCSY Spectrum http: //wishart. biology. ualberta. ca/metabominer/

Metabo. Miner Software Design • Standard reference libraries – 225 TOCSY spectra – 488 HSQC spectra – Specialized sub-libraries for CSF, plasma and urine • Algorithms for automatic processing & compound identification – “Minimal signature peaks” – 1 D 1 H peak list as sanity check – Extra dimensional information for identification • Support for direct spectral annotation

Metabo. Miner Performance

NMR Compound ID - HMDB NMR spectrum of mixture Phenyllactate Phenylpyruvate Phenylacetic acid Tropic acid Benzyl alcohol … http: ///www. hmdb. ca Peak list to HMDB High scoring matches

PRIMe Spin Assign http: //prime. psc. riken. jp/? action=nmr_search

r. NMR http: //rnmr. nmrfam. wisc. edu/

BMRB Peaks Server http: //www. bmrb. wisc. edu/metabolomics/query_metab. php

CCPN - MP http: //www. ccpn. ac. uk/ccpn/projects/metabolomics/

Metabolite ID by GC-MS GC -MS total Ion chromatogram

Recall EI MS Generates Multiple Peaks Molecular ion EI Breaks up Molecules in Predictable Ways

GC-MS Spectrum

Recall GC-MS Analytes are Derivatized Methoxime

Metabolite ID by GC-MS • GC-MS is often best for identification of amino acids, organic acids, sugars, fatty acids and molecules with MW<500 • GC has higher resolution and reproducibility than LC • EI-MS is more standardized than soft ionization methods, so EI spectra are more comparable • Most common route is to use AMDIS + NIST database

NIST 11 MS Database • 243, 893 EI spectra of 212, 961 cmpds • 9934 ion trap MS for 4649 cmpds • 91, 557 Qtof & Qq. Q spectra for 3774 compounds • 224, 038 RI values for 21, 847 cmpds

NIST MS Search Software
 • Noise analysis – Determines background")
AMDIS (Automated Mass Spectral Deconvolution and Identification System) • Noise analysis – Determines background noise level • Component perception – Identifies peaks by comparing to noise • Spectral deconvolution – Generates a “clean” or model spectrum • Compound identification – Identifies compounds via a library search using a match factor
 • Measures the similarity of the MS spectrum of the query")
Match Factor (MF) • Measures the similarity of the MS spectrum of the query to the MS spectrum in the reference database • Defined as the normalized dot product of the query and the reference spectra Iref corresponds to the intensities of the reference spectra, Iqry corresponds the intensities of the query spectra, M corresponds to the masses (m/z) w is a weighting term to penalize uncertain peaks

GC-MS Protocol • Prepare a set of external n-alkane standards (8 -9 n-alkanes spanning octane to hexadecane) and run as an external calibration standard • Run a “blank sample” containing just the solvent and derivatization agents • Run the sample of interest (under the same conditions as the blank)

GC-MS Protocol External n-alkane standard used for RI calculation

GC-MS Protocol • Create a calibration file using the n-alkane mixture (sets retention indices [RI’s] to the standard values) • Analyze the sample data file against the CAL(calibration)-file for the alkane mixture (sets and recalculates RI's using the nalkanes) • Search the NIST database for matches and displaying the results of the search • Get rid of “false” positives by comparing the “blank” against the sample spectrum

Step 1 - Create Calibration File AMDIS

Step 2 – Calibrate Sample Spectrum Using CAL-file AMDIS

Step 3 – Search NIST Database for Matches GC Peak List AMDIS EI-MS Spectrum For 11. 597
 Peak Spectrum MF =")
Step 3 – Search NIST Database for Matches (Zero in) Peak Spectrum MF = 84% Match To Valine Reference Spectrum Match factor ³ 60% (if in doubt compare “blank” and your signal) 73 & 144 are 2 most abund. m/z
 – Chroma.")
Other GC-MS Options • Alternatives to AMDIS – Analyzer. Pro (Spectral. Works) – Chroma. TOF (Leco) – Evaluated in Tr. AC Trends in Analytical Chemistry Volume 27, Issue 3, March 2008, Pages 215 -227 • Alternatives to NIST 08 or NISTII – Golm Database (Open access) – Fiehn. Lib (Leco, Agilent) – HMDB? ? ?
 database • Contains MSRI (MS +")
The Golm Database • GC-MS (Quad and TOF) database • Contains MSRI (MS + retention index) or MST data for 1450 identified metabolites • Includes 10, 336 spectra linked to analytes • Downloadable libraries compatible with NIST 08 and AMDIS software • Primary focus on plant metabolites • Supports compound name and MS queries • MS submissions via NIST 08 or AMDIS format

Golm Database http: //gmd. mpimp-golm. mpg. de/

Golm Database

The Fiehn. Lib GC-MS Database • 2212 EI MS and RI data for quadrupole &TOF GC-MS • Over 1000 primary metabolites below 550 Da • Covers lipids, amino acids, fatty acids, amines, alcohols, sugars, aminosugars, sugar alcohols, sugar acids, , and sterolsphosphates, hydroxyl acids, purines

Metabolite ID by LC-MS LC -MS total Ion chromatogram

Levels of Metabolite Identification in MS • 4 levels of metabolite identification • Positively identified compounds – Confirmed by match to known standard • Putatively identified compounds – Match to MS + RT or MS/MS + RT • Compounds putatively identified in a compound class • Unknown compounds

Metabolite ID by LC-MS • LC-MS is often best for identification of lipids, bases, amino acids, organic acids, fatty acids and other somewhat hydrophobic molecules • Metabolite ID typically requires both MS and MS/MS data (along with retention time information) and internal standards • Compound ID can be done by high accuracy mass matching and/or by MS/MS matching to spectral databases
 Chem. Spider (www. chemspider.")
Simple MW Search DBs Ch. EBI (www. ebi. ac. uk/chebi/) Chem. Spider (www. chemspider. com) Pub. Chem (http: //pubchem. ncbi. nlm. nih. gov/) HMDB (www. hmdb. ca)

Pub. Chem MW Search Available Under “Advanced Search”

Pub. Chem Results

Ch. EBI MW Search http: //www. ebi. ac. uk/chebi/advanced. Search. Forward. do
 Metlin (http: //metlin. scripps. edu/)")
Advanced MS Search DBs NIST/AMDIS (http: //chemdata. nist. gov) Metlin (http: //metlin. scripps. edu/) HMDB (www. hmdb. ca) Mass. Bank (www. massbank. jp)

Advanced MS Search DBs • These databases support not only MW or MW range searches, but also support parent ion searches (positive, negative, neutral), peak list searches (from MS or MS/MS data) as well as MS/MS spectral matching • These DBs are intended more for MSbased metabolomics and compound ID than the simple MW search tools

MS Compound ID - HMDB LC-MS Spectrum Peak list to HMDB Phenyllactate Phenylpyruvate Atrolactic acid Homovanillin Coumaric acd http: ///www. hmdb. ca High scoring matches

MS Compound ID - HMDB • Database of ~100, 000 predicted masses from ~10, 000 known metabolites • Includes adduct mass calculations for 30+ possible or expected metabolite adducts • Allows selection of different databases (Drug. Bank, HMDB, Foo. DB, T 3 DB), mass tolerance and ionization mode • Designed for mixture deconvolution (i. e. identification of multiple compounds at a time)

MS/MS Compound ID - HMDB • Database of 1000 experimental MS/MS spectra (low, medium and high collision energies) collected on Qq. Q - but largely valid for ion trap instruments as well • Allows selection of different instruments (Qq. Q, ion trap, FT-MS q. TOF), collision energies, ionization modes, parent ion mass tolerance and fragment ion mass tolerance • Designed for identification of a single compound at a time

Metlin MS Search Step 1: Enter Mass Step 2: Select Charge Step 3: Select “all” Step 4: “Find Metabolites” http: //metlin. scripps. edu/metabo_search_alt 2. php

Metlin Results

Metlin MS/MS Search mz. XML mz. Data http: //metlin. scripps. edu/upload. php

Metabolite ID - Complications • LC-ESI-MS often leads to the production of salt adducts, neutral loss species and multiply charged species • Up to 50% of LC-MS signals arise from these “noise” sources • Key challenge is to distinguish adducts or multiply charged species from parent ions or to group adducts or multiply charged species with parent ions

Adduct Formation Effect on ESI Mass Spectrum Sample Na Add

Common Adducts in DI-MS

Fiehn Lab Adduct Table http: //fiehnlab. ucdavis. edu/staff/kind/Metabolomics/MS-Adduct-Calculator/

MZed. DB – Adduct Calculator http: //maltese. dbs. aber. ac. uk: 8888/hrmet/search/genip. php

MZed. DB – Results for C 6 H 12 O 6

Neutral Loss Fragments

Handling MS Complications • MZed. DB, Metlin and HMDB are able to handle or predict adducts • Metlin and MZed. DB are able to handle or predict ion pairs or multiply charged species • Metlin can potentially handle or predict neutral loss species • Searching by MS or MS ranges can lead to lots of hits (high FP rate)

Exploiting High Mass Accuracy to ID Compounds Type Mass Accuracy FT-ICR-MS 0. 1 - 1 ppm Orbitrap 0. 5 - 1 ppm Magnetic Sector 1 - 2 ppm TOF-MS 3 - 5 ppm Q-TOF 3 - 5 ppm Triple Quad 3 - 5 ppm Linear Ion. Trap 50 -200 ppm (10 ppm in Ultra-Zoom)

Molecular Formula Generators • Formula generators are used to create molecular formulae from very accurate masses obtained by FT-MS or Orbi. Trap • Assist in compound ID by LC-MS (formula is more restrictive than MW) • Input typically requires: – Accurate isotopic mass (with or without adduct) – Error in ppm or m. Da (milli. Daltons)
 Accurate mass Mass error http: //www. alchemistmatt. com/mwtwin. html")
Molecular Formula Generators (MWTWIN) Accurate mass Mass error http: //www. alchemistmatt. com/mwtwin. html
 http: //www. highchem. com/formula-generator/")
Molecular Formula Generators (High. Chem) http: //www. highchem. com/formula-generator/
 http: //maltese. dbs. aber. ac. uk: 8888/hrmet/search/gr. html")
Molecular Formula Generator Server (MZed. DB) http: //maltese. dbs. aber. ac. uk: 8888/hrmet/search/gr. html

Finding Compounds By Molecular Formula - Pub. Chem http: //pubchem. ncbi. nlm. nih. gov/search. cgi

Finding Compounds By Molecular Formula - Ch. EBI http: //www. ebi. ac. uk/chebi/advanced. Search. Forward. do
 as well as chemical bonding")
Formula Filters • Use additional MS information (isotopic abundance) as well as chemical bonding restrictions (Lewis & Senior rules), known or presumed atomic compositional data and matches to known or hypothesized structures to reduce the possible # of structures/formulas that are generated
 Formula Filter")
Fiehn’s 7 Golden Rules (7 GR) Formula Filter

7 GR Software http: //fiehnlab. ucdavis. edu/projects/Seven_Golden_Rules/Software/

Molecular Formula Space of Small Molecules

Frequency Distribution of Molecular Formulas

Impact of Mass Accuracy on Formula Numbers
![Mass + Isotope Abundance [M+H]+ C 45 H 73 NO 15 MW = 867.](http://slidetodoc.com/presentation_image/58ade97c38dce1a9c714b4a2367912ca/image-76.jpg "Mass + Isotope Abundance [M+H]+ C 45 H 73 NO 15 MW = 867.")
Mass + Isotope Abundance [M+H]+ C 45 H 73 NO 15 MW = 867. 49799 Example: ESI-MS (+) of Solanine on a LTQ Resolving Power: 1700 Mass Accuracy: 46 ppm Isotopic Abundance Error: ± 1. 46%

Mass Isomers Are Hard To Distinguish by MS Alone Use Retention Time or Isomer Generators to Distinguish

Molecular Isomer Generators Creates all possible structural isomers from a given molecular formula Example: MOLGEN DEMO (Bayreuth)

Size of Molecular Isomer Space is Unknown Accurate mass Formula Number Isomers in Beilstein DB 77. 99531 CH 2 O 4 6 0 78. 04293 CH 6 N 2 O 2 28 1 78. 03169 C 2 H 6 O 3 10 8 78. 02180 C 4 H 2 N 2 465 2 78. 01056 C 5 H 2 O 151 2 78. 04695 C 6 H 6 217 29 150. 04293 C 7 H 6 N 2 O 2 100, 082, 479 153 150. 09054 C 7 H 10 N 4 66, 583, 863 105 150. 03169 C 8 H 6 O 3 6, 717, 404 90 150. 07931 C 8 H 10 N 2 O 76, 307, 072 542 150. 06808 C 9 H 10 O 2 6, 843, 602 667 150. 11569 C 9 H 14 N 2 9, 459, 132 568 150. 02180 C 10 H 2 N 2 65, 563, 828 0 150. 10446 C 10 H 14 O 1, 548, 361 1938 150. 01056 C 11 H 2 O 9, 414, 509 0 150. 14084 C 11 H 18 84, 051 762 150. 04695 C 12 H 6 34, 030, 905 12

Some Points of Caution • Many databases (Pub. Chem, Ch. EBI, Metlin, Fiehn. Lib, NIST) mix non-metabolites with metabolites or plant metabolites with animal and/or microbial metabolites or drugs/buffer reagents with metabolites • This leads to many “silly” hits • If you know the source organism use this information to limit the search or use organism-specific metabolome databases (HMDB, Foo. DB, Drug. Bank, Knap. Sack, etc. )
")
Alternatives to Mass Filtering and Mass Matching • Use chemoselective labeling (similar to proteomics) to simplify the identification of “true” metabolites, reduce number of signals and eliminate false positives • Use MS-based kits (Biocrates) • Use concepts in Computer-Aided Structure Elucidation (CASE) to assist in compound ID

Quantitative MS Metabolomics With Chemoselective Labeling Pooled Analysis Mix LC-MS Analysis Individual Analysis

Quantitative MS Metabolomics With Chemoselective Labeling

Quantitative MS Metabolomics in Human Urine 30 n. M 2. 51 m. M 672 peaks by amino labeling 120 standards spiked 92 peaks identified/quantified 30 n. M - 2. 51 m. M 820 peaks by carboxy labeling Still assessing Guo K. & Li L. Anal Chem. 2009 May 15; 81(10): 3919 -32.

Advantages to Derivitization • Tags can convert non-UV active compounds into UV or fluorescently detectable cmpds • Tags improve ionization efficiency and lower limit of detection • Tags permit affinity purification and concentration • Tags make polar molecules hydrophobic, leading to better LC separations • Tags permit isotope based quantification • Tags greatly increase # compounds detected • Tags allow independent confirmation of “real” peaks • Best route to automated ID & quantification by LC-MS

Bio. Crates IDQ Kit 40 acylcarnitines, 13 amino acids, 15 Lyso. PCs, 77 PCs, 15 SMs = 160

Multiple Reaction Monitoring CD 3 Q 1 Q 3 CH 3

Sample Urine Metabolite List Concentration range from 10 n. M to 7. 2 m. M (1, 000 X concentration) Arginine 38. 7 Tyrosine u. M 204. 0 u. M C 14: 2 Carn 0. 03 u. M C 4: 1 Carn 0. 235 u. M C 8 Carnitine 1. 05 u. M PC(36: 5) aa 0. 011 u. M Lyso. PC-20: 4 SM(22: 3) 0. 039 u. M 0. 016 u. M Glutamine 531. 0 u. M Valiine 37. 0 u. M C 14: 2 -OH 0. 02 u. M C 5 Carnit 4. 39 u. M C 9 Carnitine 1. 37 u. M PC(38: 5) aa 0. 016 u. M Lyso. PC-6: 0 0. 073 u. M SM(24: 0) 0. 342 u. M Glycine 922. 0 u. M Leu/Ile 128. 0 u. M C 16 Carn 0. 021 u. M C 6 -OH Carn 0. 703 u. M PC(28: 1) aa 0. 059 u. M PC(42: 4) aa 0. 010 u. M SM(OH)16: 1 0. 020 u. M SM(24: 1) 0. 206 u. M Histidine 1146. 0 u. M Carnitiine 73. 2 u. M C 16 -OH Cr 0. 035 u. M C 5 -M-DC 0. 531 u. M PC(30: 2) aa 0. 009 u. M PC(38: 3) ae 0. 021 u. M SM(OH)22: 1 0. 065 u. M SM(26: 0) 0. 020 u. M Methionine 15. 6 u. M C 10 Carn 0. 324 u. M C 16: 1 -OH 0. 035 u. M C 5 -OH Carn 1. 46 u. M PC(34: 1) aa 0. 094 u. M PC(38: 4) ae 0. 025 u. M SM(OH)22: 2 0. 060 u. M SM(26: 1) 0. 014 u. M Phenylalanin 52. 7 u. M C 10: 1 Carn 1. 83 u. M C 2 Carnitine C 5: 1 Carn 45. 2 u. M 1. 84 u. M PC(34: 2) aa 0. 087 u. M PC(38: 5) ae 0. 092 u. M SM(OH)24: 2 0. 015 u. M Glucose 2264 u. M Proline 42. 9 u. M C 10: 2 Carn 0. 796 u. M C 3 Carnitine 2. 12 u. M C 5: 1 -OH 0. 367 u. M PC(34: 4) aa 0. 009 u. M PC(38: 6) ae 0. 068 u. M SM(16: 0) 0. 352 u. M Creatinine 7222 u. M Serine 408. 0 u. M C 12 Carn 0. 203 u. M C 3 -OH Carn 0. 163 u. M C 6 Carnitine 0. 814 u. M PC(36: 1) aa 0. 053 u. M PC(40: 5) ae 0. 014 u. M SM(16: 1) 0. 001 u. M Threonine 220. 0 u. M C 14 Carn 0. 063 u. M C 4 Carnint 11. 0 u. M C 6: 1 Carnt 0. 294 u. M PC(36: 3) aa 0. 054 u. M PC(42: 3) ae 0. 012 u. M SM(18: 1) 0. 023 u. M Tryptophan 15. 0 u. M C 14: 1 -OH 0. 016 u. M C 4 -OH Carn 0. 405 u. M C 8 -OH Carn 0. 509 u. M PC(36: 4) aa 0. 051 u. M PC(44: 3) ae 0. 014 u. M SM(20: 2) 0. 020 u. M

CASE – Computer-Aided Structure Elucidation • Two approaches – Bottom Up and Top Down • Top-Down uses known metabolites and generates variants (via metabolic transformation or other bio-informed methods). Properties/spectra/MW are predicted and then compares them to observed spectra/properties of unknown • Bottom-Up uses known fragments of molecules, assembles the fragments into logical structure, predicts the properties/spectra and compares to observed spectra/properties of unknown
 Match observed spectra to predicted")
Top - Down CASE Methods Known metabolites (20, 000) Match observed spectra to predicted specta to ID Predicted biotransformations (20, 000 --> 200, 000) Predicted MS, MS/MS, NMR, GC-MS Spectra
 CASE Known metabolite substructures or metabolite EI or CID fragments Neural Network")
Bottom-Up (Traditional) CASE Known metabolite substructures or metabolite EI or CID fragments Neural Network or GA driven fragment assembly + Match observed spectra to predicted specta to ID Predicted (or kown) MS, MS/MS, NMR, GC-MS fragment spectra
- Slides: 91