Canadian Bioinformatics Workshops www bioinformatics ca Module Title

Canadian Bioinformatics Workshops www. bioinformatics. ca

Module #: Title of Module 2

Module 1 Introduction to Metabolomics David Wishart Informatics and Statistics for Metabolomics June 16 -17, 2014
 • To")
Learning Objectives • To define metabolomics and the size of the metabolome(s) • To appreciate the importance and potential applications of metabolomics • To understand the operational principles of key metabolomics technologies (LC, GC, MS and NMR) • To understand the difference between targeted and untargeted metabolomics

Schedule

The Pyramid of Life

What is Metabolomics? • Genomics - A field of life science research that uses High Throughput (HT) technologies to identify and/or characterize all the genes in a given cell, tissue or organism (i. e. the genome). • Metabolomics - A field of life science research that uses High Throughput (HT) technologies to identify and/or characterize all the small molecules or metabolites in a given cell, tissue or organism (i. e. the metabolome).

What is a Metabolite? • Any organic molecule detectable in the body with a MW < 1500 Da • Includes peptides, oligonucleotides, sugars, nucelosides, organic acids, ketones, aldehydes, amino acids, lipids, steroids, alkaloids, food additives, toxins, pollutants, drugs and drug metabolites • Includes human & microbial products • Concentration > detectable (1 p. M)

What is a Metabolome? • The complete collection of small molecule metabolites in a cell, organ, tissue or organism • Includes endogenous and exogenous molecules as well as transient or even theoretical molecules • Defined by the detection technology • Metabolome size is always ill-defined

Different Metabolomes All Mammals 60, 000 Chemicals 100, 000 Chemicals 300, 000 Chemicals The Pyramid of Life All Microbes All Plants
 2600 (Drug. Bank) 32500 (Foo. DB) 1450")
The Human Metabolomes 3230 (T 3 DB) 2600 (Drug. Bank) 32500 (Foo. DB) 1450 (Drug. Bank) 29700 (HMDB) Toxins/Env. Chemicals Drug metabolites Food additives/Phytochemicals Drugs Endogenous metabolites M m. M n. M p. M
 10, 000 (Drug metabolome) 100, 000 (Food metabolome)")
Theoretical Human Metabolomes 100, 000 (Lipidome) 10, 000 (Drug metabolome) 100, 000 (Food metabolome) 10, 000 (Secondome) Lipids/Lipid derivatives Secondary drug metabolites Secondary food metabolites Secondary endogenous metabolites M m. M n. M p. M f. M

Why is Metabolomics Important?

Small Molecules Count… • >95% of all diagnostic clinical assays test for small molecules • 89% of all known drugs are small molecules • 50% of all drugs are derived from preexisting metabolites • 30% of identified genetic disorders involve diseases of small molecule metabolism • Small molecules serve as cofactors and signaling molecules to 1000’s of proteins

Metabolites Are the Canaries of the Genome A single base change can lead to a 10, 000 X change in metabolite levels

Response Metabolomics Response Proteomics Response Metabolomics is More Time Sensitive Than Other “Omics” Genomics Time

Metabolism is “Understood”

The Metabolome is Connected to all other “Omes” Meta bolome Proteome Genome The Pyramid of Life

The Metabolome is Connected to All Other “Omes” • Small molecules (i. e. AMP, CMP, GMP, TMP) are the primary constituents of the genome & transcriptome • Small molecules (i. e. the 20 amino acids) are the primary constituents of the proteome • Small molecules (i. e. lipids) give cells their shape, form, integrity and structure • Small molecules (sugars, lipids, AAs, ATP) are the source of all cellular energy • Small molecules serve as cofactors and signaling molecules for both the proteome and the genome • The genome & proteome largely evolved to catalyze the chemistry of small molecules

Metabolomics Enables Systems Biology Bioinformatics Meta bolomics Cheminformatics Proteomics Genomics Systems Biology

Metabolomics Applications • Toxicology Testing • Genetic Disease Tests • Clinical Trial Testing • Nutritional Analysis • Fermentation Monitoring • Clinical Blood Analysis • Food & Beverage Tests • Clinical Urinalysis • Nutraceutical Analysis • Cholesterol Testing • Drug Phenotyping • Drug Compliance • Water Quality Testing • Transplant Monitoring • Petrochemical Analysis • MRS and CS imaging

Metabolomics Methods

Metabolomics Workflow Biological or Tissue Samples pp m 7 6 5 4 3 Data Analysis 2 Extraction Biofluids or Extracts 1 Chemical Analysis

Comparing “Omics” Coverage Completeness Metabolomics 200 Chemicals Proteomics 5000 Proteins Genomics 22, 000 Genes The Pyramid of Life

Why Metabolomics is Difficult Chemical Diversity Metabolomics 2 x 10⁵ Chemicals Proteomics 20 Amino acids Genomics 4 Bases The Pyramid of Life

Metabolomics Technologies • • • UPLC, HPLC CE/microfluidics LC-MS FT-MS Qq. Q-MS NMR spectroscopy X-ray crystallography GC-MS FTIR

Chromatography

Chromatography • The separation of components in a mixture that involves passing the mixture dissolved in a "mobile phase" through a stationary phase, which separates the analyte to be measured from other molecules in the mixture based on differential partitioning between the mobile and stationary phases • Column, thin layer, liquid, gas, affinity, ion exchange, size exclusion, reverse phase, normal phase, gravity, high pressure
 Liquid Chromatography - HPLC • Developed in 1970’s • Uses high")
High Pressure (Performance) Liquid Chromatography - HPLC • Developed in 1970’s • Uses high pressures (6000 psi) and smaller (5 m), pressure-stable particles • Allows compounds to be detected at ppt (parts per trillion) level • Allows separation of many types of polar and nonpolar compounds

HPLC Modalities • Reversed phase – for separation of nonpolar molecules (non-polar stationary phase, polar mobile phase) • Normal phase – for separation of nonpolar molecules (polar stationary phase, non-polar/organic mobile phase) • HILIC – hydrophilic interaction liquid chromatography for separation of polar molecules (polar stationary phase, mixed polar/nonpolar mobile phase)

HPLC Columns

Reverse Phase Column

HPLC Separation Efficiency

HPLC Schematic

Gradient HPLC Schematic

HPLC of a Biological Mixture

Gas Chromatography

Gas Chromatography • Involves a sample being vaporized to a gas and injected into a column • Sample is transported through the column by an inert gas mobile phase • Column has a liquid or polymer stationary phase that is adsorbed to the surface of a metal tube • Columns are 1. 5 -10 m in length and 2 -4 mm in internal diameter • Samples are usually derivatized with TMS to make them volatile

TMS Derivatization

Gas Chromatography

GC-Columns Polysiloxane
 is the time taken by an analyte to")
Retention Time/Index • Retention time (RT) is the time taken by an analyte to pass through a column • RT is affected by compound, column (dimensions and stationary phase), flow rate, pressure, carrier, temp. • Comparing RT from a standard sample to an unknown allows compound ID • Retention index (RI) is the retention time normalized to the retention times of adjacently eluting n-alkanes

Compound Identification and Quantification

GC-MS Chromatogram of a Biological Mixture

Mass Spectrometry • Analytical method to measure the molecular or atomic weight of samples

Typical Mass Spectrometer

MS Principles • Different compounds can be uniquely identified by their mass Butorphanol L-dopa N -CH 2 OH Ethanol COOH HO -CH 2 CH-NH 2 CH 3 CH 2 OH HO HO MW = 327. 1 MW = 197. 2 MW = 46. 1

Mass Spectrometry • For small organic molecules the MW can be determined to within 1 ppm or 0. 0001% which is sufficiently accurate to confirm the molecular formula from mass alone • For large biomolecules the MW can be routinely determined within an accuracy of 0. 002% (i. e. within 1 Da for a 40 k. D protein) • Recall 1 dalton = 1 atomic mass unit (1 amu)

Different Types of MS • GC-MS - Gas Chromatography MS – separates volatile compounds in gas column and ID’s by mass • LC-MS - Liquid Chromatography MS – separates delicate compounds in HPLC column and ID’s by mass • MS-MS - Tandem Mass Spectrometry – separates compound fragments by magnetic or electric fields and ID’s by mass fragment patterns

Masses in MS • Monoisotopic mass is the mass determined using the masses of the most abundant isotopes • Average mass is the abundance weighted mass of all isotopic components

Isotopic Distributions 1 H = 99. 9% 12 C = 98. 9% 35 Cl = 68. 1% 2 H = 0. 02% 13 C = 1. 1% 37 Cl = 31. 9%

Isotopic Distributions 1 H = 99. 9% 12 C = 98. 9% 35 Cl = 68. 1% 2 H = 0. 02% 13 C = 1. 1% 37 Cl = 31. 9% 100 32. 1 6. 6 2. 1 m/z 0. 06 0. 00

Mass Spec Principles Sample + _ Ionizer Mass Analyzer Detector

Typical Mass Spectrum aspirin

Typical Mass Spectrum • Characterized by sharp, narrow peaks • X-axis position indicates the m/z ratio of a given ion (for singly charged ions this corresponds to the mass of the ion) • Height of peak indicates the relative abundance of a given ion (not reliable for quantitation) • Peak intensity indicates the ion’s ability to desorb or “fly” (some fly better than others)

Resolution & Resolving Power • Width of peak indicates the resolution of the MS instrument • The better the resolution or resolving power, the better the instrument and the better the mass accuracy DM • Resolving power is defined as: M • M is the mass number of the observed mass (DM) is the difference between two masses that can be separated

Resolution in MS
 High resolution Instrument (TOF) 2847 Resolution in MS")
Low resolution Instrument (Ion trap) High resolution Instrument (TOF) 2847 Resolution in MS
 = 3482. 7473 MW(ave) = 3484 Blue DM/M = 1000 Red")
Resolution/Resolving Power MW(mono) = 3482. 7473 MW(ave) = 3484 Blue DM/M = 1000 Red DM/M = 3000 Green DM/M = 10000 Black DM/M = 30000

Mass Spectrometer Schematic Turbo pumps Diffusion pumps Rough pumps Rotary pumps High Vacuum System Inlet Sample Plate Target HPLC GC Solids probe Ion Source Mass Analyzer MALDI ESI Ion. Spray API LSIMS EI/CI TOF Quadrupole Ion Trap Orbitrap QTrap Mag. Sector FTMS Detector Microch plate Electron Mult. Hybrid Detec. Data System PC’s UNIX Mac
 – Small molecules, 1")
Different Ionization Methods • Electron Ionization (EI - Hard method) – Small molecules, 1 -1000 Daltons, structure • Chemical Ionization (CI – Semi-hard) – Small molecules, 1 -1000 Daltons, simple spectra • Electrospray Ionization (ESI - Soft) – Small molecules, peptides, proteins, up to 200, 000 Daltons • Matrix Assisted Laser Desorption (MALDI-Soft) – Smallish molecules, peptides, proteins, DNA, up to 500 k. D
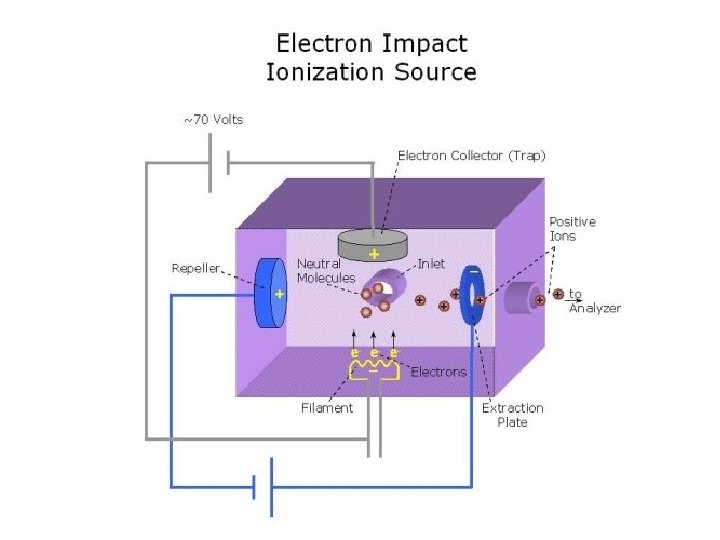

Electron Impact Ionization • Sample introduced into instrument by heating it until it evaporates • Gas phase sample is bombarded with electrons coming from rhenium or tungsten filament (energy = 70 e. V) • Molecule is “shattered” into fragments (70 e. V >> 5 e. V bonds) • Fragments sent to mass analyzer • Most commonly used in GC-MS

EI Fragmentation of CH 3 OH+ CH 3 OH CH 2 O=H+ CH 3 OH + CH CH 2 O=H+ 3 + H + OH CHO=H+ + H

Electron Impact MS of CH 3 OH Molecular ion EI Breaks up Molecules in Predictable Ways
 + _ Lecture 2.")
Soft Ionization Methods 337 nm UV laser Fluid (no salt) + _ Lecture 2. 1 cyano-hydroxy cinnamic acid Gold tip needle MALDI ESI 66
")
Electrospray (Detail)
")
Electrospray (Detail)
 and pumped through")
Electrospray Ionization • Sample dissolved in polar, volatile buffer (no salts) and pumped through a stainless steel capillary (70 - 150 m) at a rate of 10100 L/min • Strong voltage (3 -4 k. V) applied at tip along with flow of nebulizing gas causes the sample to “nebulize” or aerosolize • Aerosol is directed through regions of higher vacuum until droplets evaporate to near atomic size (still carrying charges)

Electrospray Ionization 5%H 2 O/95%CH 3 CN 95%H 2 O/5%CH 3 CN 100 V 1000 V 3000 V

Electrospray Ionization • Can be modified to “nanospray” system with flow < 1 L/min • Very sensitive technique, requires less than a picomole of material • Strongly affected by salts & detergents • Positive ion mode measures (M + H)+ (add formic acid to solvent) • Negative ion mode measures (M - H)- (add ammonia to solvent)

Mass Spectrometer Schematic Turbo pumps Diffusion pumps Rough pumps Rotary pumps High Vacuum System Inlet Sample Plate Target HPLC GC Solids probe Ion Source Mass Analyzer MALDI ESI Ion. Spray FAB LSIMS EI/CI TOF Quadrupole Ion Trap Mag. Sector FTMS Detector Microch plate Electron Mult. Hybrid Detec. Data System PC’s UNIX Mac
 – High resolution, exact")
Different Types of Mass Analyzers • Magnetic Sector Analyzer (MSA) – High resolution, exact mass, original MA • Quadrupole Analyzer (Q or Q*) – Low (1 amu) resolution, fast, cheap • Time-of-Flight Analyzer (TOF) – No upper m/z limit, high throughput • Ion Cyclotron Resonance (FT-ICR) – Highest resolution, exact mass, costly

MS Mass Accuracy Type Mass Accuracy FT-ICR-MS 0. 1 - 1 ppm Orbitrap 0. 5 - 1 ppm Magnetic Sector 1 - 2 ppm TOF-MS 3 - 5 ppm Q-TOF 3 - 5 ppm Triple Quad 3 - 5 ppm Linear Ion. Trap 50 -200 ppm (10 ppm in Ultra-Zoom)

Mass Chromatograms • Standard “output” from an LC-MS or GC-MS experiment • X-axis is retention time, Y-axis is signal intensity • Total Ion Current (TIC) chromatogram is summed intensity across the entire range of masses being detected at every point in the analysis • Base Peak chromatogram (BPC) is like a TIC but displays only the most intense peak in each spectrum • Extracted Ion chromatogram (EIC) contains one or more analytes extracted from the TIC or BPC

Mass Chromatograms of Biological Mixtures Tomato Extract Arabidopsis Extract

NMR Spectroscopy

Explaining NMR

Principles of NMR • Measures nuclear magnetism or changes in nuclear magnetism in a molecule • NMR spectroscopy measures the absorption of light (radio waves) due to changes in nuclear spin orientation • NMR only occurs when a sample is in a strong magnetic field • Different nuclei absorb at different energies (frequencies)
 Have Spin up Spin down")
Protons (and other nucleons) Have Spin up Spin down

Each Spinning Proton is Like a “Mini-Magnet” S N N S Spin up Spin down

Principles of NMR N N S S hn hn Low Energy High Energy

Bigger Magnets are Better Increasing magnetic field strength low frequency high frequency

A Modern NMR Instrument Radio Wave Transceiver

NMR Magnet

NMR Magnet Cross-Section Sample Bore Cryogens Probe Magnet Coil Magnet Legs

An NMR Probe

NMR Sample & Probe Coil

1 H NMR Spectra Exhibit. . . • Chemical Shifts (peaks at different frequencies or ppm values) • Splitting Patterns (from spin coupling) • Different Peak Intensities (# 1 H) 8. 0 7. 0 6. 0 5. 0 4. 0 3. 0 2. 0 1. 0 0. 0

Chemical Shifts • Key to the utility of NMR in chemistry • Different 1 H in different molecules exhibit different absorption frequencies • Each compound can be defined by a unique pattern of chemical shifts (a fingerprint) • Chemical shifts are mostly affected by electronegativity of neighbouring atoms, bonds or groups

Characteristic Chemical Shifts

Assigning Simple NMR Spectra TMS

Assigning Simple NMR Spectra

NMR Spectra Need “Fixin’” Before After Baseline correction Shimming Water suppression Referencing Phasing
 – Calibrates/normalizes chemical shifts")
NMR Spectra Need “Fixin’” • Chemical shift referencing (TMS, DSS) – Calibrates/normalizes chemical shifts • Shimming – Fixes line shape to look Lorentzian • Phasing – Fixes line shape to look “absorptive” • Water suppression/removal – Removes large water signal • Baseline correction – Makes spectrum look flat – not wobbly

NMR Spectrum of a Biological Mixture
 Technology & Sensitivity Unknowns 4 LC-MS or")
# Metabolites or Features detected (Log 10) Technology & Sensitivity Unknowns 4 LC-MS or DI-MS 3 GC-MS TOF 2 NMR 1 0 Knowns GC-MS Quad M m. M n. M p. M f. M Sensitivity or LDL
 GC-MS DI-MS Techniques Metabolites Water-soluble (amino acids, organic acids,")
Comparison NMR (with cold probe) GC-MS DI-MS Techniques Metabolites Water-soluble (amino acids, organic acids, sugars) mainly watersoluble (some hydrophobic) Mainly hydrophobic (some watersoluble) Types of samples Biofluids, plant, bacterial, animal tissue extracts, Food Biofluids, plant, Mainly biofluids bacterial, animal tissue extracts, Food Sample Volume 100 µL (min) 30 -50 µL (min) 10 µL

Comparison NMR GC-MS DI-MS Sample prep time 30 -120 min/20 samples 3 -4 h for 96 samples Run time 10 -90 min/sample 30 -60 min/sample 7 min/sample Data Analysis 30 -60 min / sample 1 -2 h for 96 samples Limit of Detection ~ 5 µM ~ 100 n. M ~ 5 n. M No. of metabolites ~ 20 -150 ~20 -50 ~ 100 -180 Overlapping Metabolites 10 -15 Cross-checking 10 -30 %
 • GC-MS based")
What’s Possible • NMR-based metabolomics (~50 -200 metabolites identified/quantified, M sensitivity) • GC-MS based metabolomics (~70 -120 metabolites identified/quantified, < M sensitivity) • DI-MS based metabolomics (180 metabolites identified/quantified, n. M sensitivity) • LC-MS based metabolomics (300 -500 metabolites identified/quantified, n. M sensitivity) • Lipidomics (3000 lipids identified and semiquantified, n. M sensitivity) • Specialty phytochemical, nutrient, drug and pesticide analysis (mostly HPLC, n. M sensitivity)
 Methods 3 2")
2 Routes to Metabolomics ppm 7 6 5 4 Quantitative (Targeted) Methods 3 2 Chemometric (Profiling) Methods 25 TMAO hippurate allantoin creatinine taurine 1 20 creatinine PC 2 15 10 citrate ANIT 5 hippurate urea 2 -oxoglutarate water succinate fumarate ppm 7 6 0 -5 Control -10 5 4 3 2 1 -15 PAP -20 -25 -30 -20 -10 PC 1 0 10
 Data Reduction Data Collection 25 PC 2 20 15 10 5 ANIT")
Profiling (Untargeted) Data Reduction Data Collection 25 PC 2 20 15 10 5 ANIT 0 -5 -10 -15 -20 -25 -30 Sample Prep Metabolite Identification PAP -20 -10 Control PC 1 0 10
 Sample Prep Biological Interpretation 25 PC 2 20 15 10 5 ANIT")
Quantitative (Targeted) Sample Prep Biological Interpretation 25 PC 2 20 15 10 5 ANIT 0 -5 -10 -15 -20 -25 -30 PAP -20 -10 Control PC 1 0 Data Reduction Metabolite Identification & Quantification 10

From Spectra to Lists ppm 7 6 5 4 3 2 1

From Lists to Pathways

From Pathways & Lists to Models & Biomarkers

Key Informatics Challenges in Metabolomics • Spectra -> Lists – Data integrity and quality – Data alignment and normalization – Data reduction and classification – Assessment of significance – Metabolite identification/quantification • Lists -> Pathways & Biomarkers – Pathway mapping and identification – Biological interpretation
- Slides: 107