Can you make an accurate map Warm Up


 indicates a constant")


- Slides: 38
Can you make an accurate map?
Warm Up Question Today’s question: How to: – Take out your binder and open to your unit 1 section – Always write out the whole question AND all answer choices – Circle your answer in pencil (in case you’re wrong and need to change it) Lines of Longitude A. never meet. B. begin at the equator. C. are referred to as parallels. D. intersect at the poles. E. contain the two tropics.
Lines of Longitude A. never meet. B. begin at the equator. C. are referred to as parallels. D. intersect at the poles. E. contain the two tropics.
Maps & Geography Skills! Yes, you need to have map and geo skills
Describing location – Equator – 0*- runs west to east & separate Earth north and south – Prime Meridian – 0*- runs north to south & separates Earth west and east – Latitude – Aka parallels- runs parallel to & measures distance north and south of equator – Longitude – Aka meridians- runs parallel to & measures distance west and east of Prime Meridian
Describing location – Site – Physical and cultural features, independent of its relationship to other places around it – San Francisco is about 37* N lat. And 123* W long. on a peninsula separating San Fran Bay from the Pacific Ocean – Situation – Aka relative location- describing the location based on the relationship to other places – San Francisco is an economic hub in northern California near the Pacific Ocean – Absolute distance – Measurement of linear space – Bangor, Maine is 130 miles northeast of Portland, Maine – Relative distance – Includes the local, cultural, political, or economic connectivity
Why do Geographers use Maps, and What do Maps Tell Us? Where in the World is North Korea? ?
Warm Up Question How to: – Take out your binder and open to your Unit 1 Section – Always write out the whole question AND answer choices – Circle your answer in pencil (in case you’re wrong and need to change it) Today’s question: Which of the following is TRUE concerning regions? A. They are strict functional units. B. They are usually defined by a standard mathematical formula. C. They are figments of the imagination. D. They are conceptual units. E. They all have well-defined boundaries.
Which of the following is TRUE concerning regions? A. They are strict functional units. B. They are usually defined by a standard mathematical formula. C. They are figments of the imagination. D. They are conceptual units. E. They all have well-defined boundaries.
Region s World USA
Formal Regions defined by a commonality, typically a cultural linkage or a physical characteristic. e. g. Location, Climate, Religion, Language…
Functional Regions defined by a set of social, political, or economic activities or the interactions that occur within it. e. g. an urban area
Perceptual Regions ideas in our minds, based on accumulated knowledge of places and regions, that define an area of “sameness” or “connectedness. ” e. g. the South the Mid-Atlantic the Middle East
Midwest Northeast West Southwest
Cartography – Remote sensing – Captures images of Earth’s surface from airplanes or satellites – GPS – Global Positioning System- integrated network of satellites the orbit Earth constantly and broadcasts location information – GIS – Geographic Information Systems- software program that allows geographers to map, analyze, and model spatial data using thematic layers – Thematic layers – Layers of the Earth’s surface
Types of Maps: Reference Maps Thematic Maps - Show locations of places and geographic features - Tell a story about the degree of an attribute, the pattern of its distribution, or its movement. - Absolute locations - Relative locations What are reference maps used for? What are thematic maps used for?
Reference Map
Thematic Map What story about median income in the Washington, DC area is this map telling?
Cartograms – Skewing a map to show a more realistic view of what happened – Ex: 2012 Presidential Election
Cartogram of world population
Types of Maps: – Topographic- path of each isoline (countour line) indicates a constant elevation. The closer together the lines, the higher the elevation. – Choropleth- use colors or tonal shading to represent categories of data for given geographic areas. – Using five colors to show five income levels
Types of Maps – Cognitive- formed by people’s perceived information about their surroundings and then create a mental image – Very informative for how people interpret and understand places in which they live. – Aka mental maps – Preference- type of cognitive map that show people’s ideas about the environmental, social, or economic quality of life in various places – Both influenced by your sense of place
Projections Why don’t ALL maps look the same? !? !
Projections Why are we changing maps? ! – Mercator- landmasses become amplified and larger closer to the poles – Fuller- maintains accurate size and shape of landmasses but rearranges direction – Robinson- attempts to balance projection errors and is aesthetically pleasing. – Frequently used by cartographers – Peters- equal-area projection centered on Africa – Azimuthal- north or south pole is in the center of the map, giving the impression that you’re looking down on the Earth
Map Projections Mercator- most used but not very accurate Fuller
Map Projections Robinson Peters- more accurate
Azimuthal
Is any map a good map? – Why maps are all wrong. . .
Scale – Ratio between the distance on a map and the actual distance on Earth’s surface – Standard = 1: 24, 000 – Small scale = 1: 100, 000 – Large scale = 1: 5, 000
Warm Up Question The set of processes that are increasing interactions, deepening relationships and heightening interdependence regardless of national boundaries is called _____. – a) spatial – b) nationalizing – c) ecological – d) globalization – e) none of the above
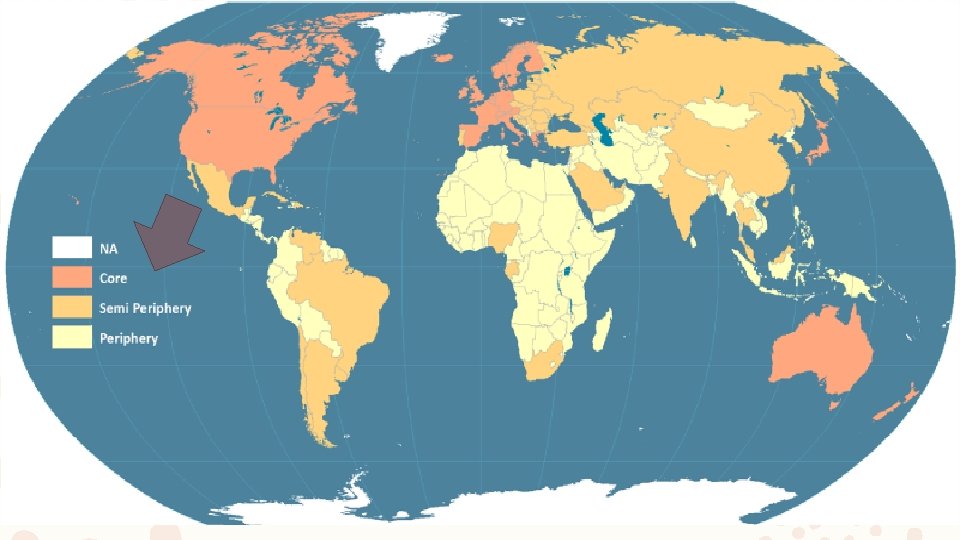
The World Systems Theory – World is broken down into three categories of countries- developed by Immanuel Wallerstein – Idea that the world is broken down economically where some countries benefit where others are exploited – Core (MDC) (Developed) – Wealthy, powerful – Semi-Periphery (LDC) (Developing) – Has a little bit of both core and periphery in the country – Periphery (LDC) (Developing) – Poor, struggling
Core countries – MDC, Developed – Dominant capitalist countries – Wealthy – Citizens are doing well – Strong military power – Do not depend on one single state or country – Uses power to exploit poorer countries – Labor – Raw materials
Label the core countries on your map
Periphery countries – LDC, Developing – Lack a strong, central government – Controlled by other countries – Dependent on core countries for capital – Low skill, labor-intensive production – Aka- third-world countries
Label the periphery countries on your map
Semi-periphery countries – LDC, Developing – Have qualities of core and periphery in the country – Trying to get out of periphery – Declining from core – Sometimes exploited by the core – Sometimes exploit periphery
Label the semiperiphery countries on your map