
Campus Luigi Einaudi Turin November 12 2015 ST
Campus Luigi Einaudi Turin November 12, 2015 S&T indicators: Handle with care Giorgio Sirilli ISCr. ES - CNR
Outline of the presentation STI indicators The manuals The most relevant indicators Uses and abuses of indicators Concluding remarks 2
Indicators Statistic: A numerical fact or datum, i. e. one computed from a sample. Statistical data: Data from a survey or administrative source used to produce statistics. Statistical indicator: A statistic, or combinations of statistics, providing information on some aspect of the state of a system or of its change over time. (For example, gross domestic product (GDP) provides information on the level of value added in the economy, and its change overtime is an indicator of the economic state of the nation. ) 3
Indicators are a technology, a product, which - governs behaviour - is modified by users (outside of the producer community) - develops in response to user needs Data sources – Surveys, administrative data, private files, case studies – Data collection is informed by manuals Data populate statistics which can be indicators Decisions are taken on the basis of indicators 4
Science and technology indicators S&T indicators are defined as “a series of data which measures and reflects the science and technology endeavor of a country, demonstrates its strengths and weaknesses and follows its changing character notably with the aim of providing early warning of events and trends which might impair its capability to meet the country’s needs”. Indicators can help “to shape lines of argument and policy reasoning. They can serve as checks, they are only part of what is needed”. (OECD, 1976) 5
STI indicators • • • 6 Research and development (R&D) Innovation statistics Intangible investment Patents Technology balance of payments Trade of high-tech products Human resources Venture capital Bibliometrics Public perception of science and technology
The evolution of STI indicators The first attempt to measure S&T in 1957 Frascati Manual (1963) The Frascati manual “family” A continous process of broadening and deepening: from macro to micro, from public to private The role of international organisations The dialogue between producers and users 7
The relationship between producers and users After WWII the main issue in STI policy was the social responsibility of science. Now the attention is placed on the social return of investment on STI and, in particular, on innovation and social objectives Weak innovation theories do not allow a straighforward interpretation of indicators A tension: the simplification of policy makers (e. g. the 3% R&D/GDP ratio) versus deepening of analysts The time dimension: demand of indicators and analyses (quick and dirty) but …. the construction of indicators is a “heavy ship” (more than 10 years to build) 8
Producers of indicators National Statistical Institutes OECD EUROSTAT Other sources (European Patent Office, USPTO, JAPO) Private sources (e. g bibliometrics) Scholars 9
International organisations active in STI indicators OECD and member countries Eurostat and the relevant Commission DGs and member states of the EU UNESCO United Nations Institute of Statistics RICYT and member countries NEPAD is moving in this direction 10
Producers of indicators OECD Group of ‘National Experts on Science and Technology Indicators’ - NESTI
What is a Manual? Manuals are codified knowledge They are guidelines for the collection and interpretation of data and for international comparisons of data, statistics and indicators. They are supported by an international infrastructure (ISIC, ISCED and ISCO) Manuals provide a language of discourse and they behave like a technology (our guiding assumption) 12
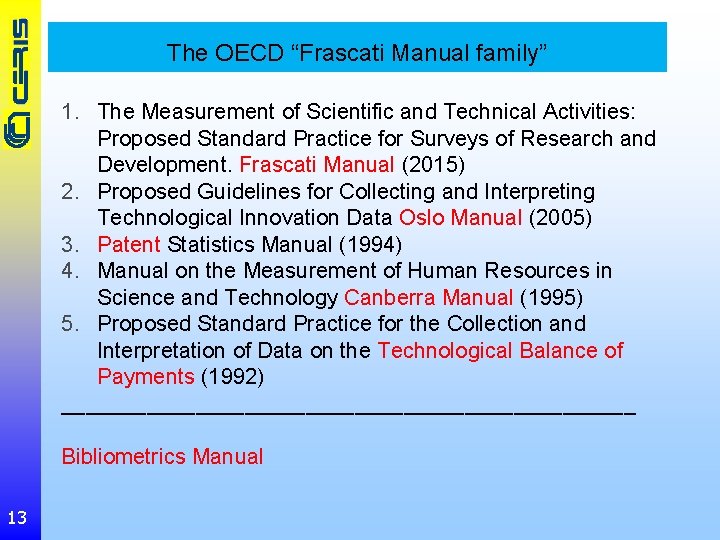
The OECD “Frascati Manual family” 1. The Measurement of Scientific and Technical Activities: Proposed Standard Practice for Surveys of Research and Development. Frascati Manual (2015) 2. Proposed Guidelines for Collecting and Interpreting Technological Innovation Data Oslo Manual (2005) 3. Patent Statistics Manual (1994) 4. Manual on the Measurement of Human Resources in Science and Technology Canberra Manual (1995) 5. Proposed Standard Practice for the Collection and Interpretation of Data on the Technological Balance of Payments (1992) ________________________ Bibliometrics Manual 13
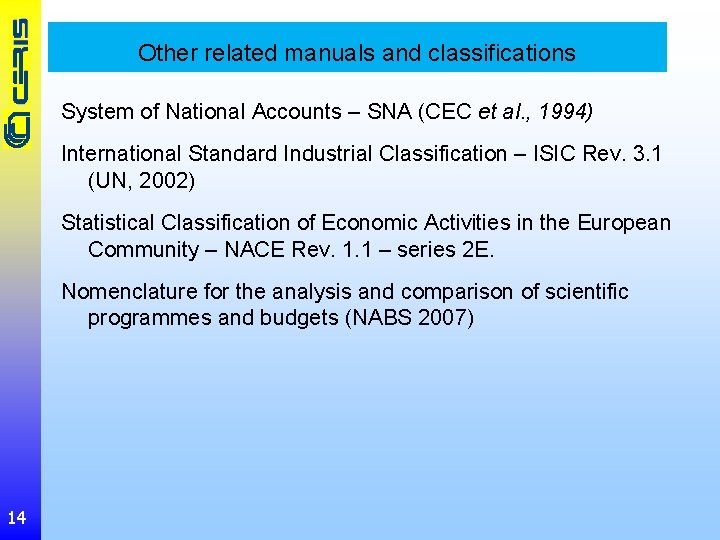
Other related manuals and classifications System of National Accounts – SNA (CEC et al. , 1994) International Standard Industrial Classification – ISIC Rev. 3. 1 (UN, 2002) Statistical Classification of Economic Activities in the European Community – NACE Rev. 1. 1 – series 2 E. Nomenclature for the analysis and comparison of scientific programmes and budgets (NABS 2007) 14

The Frascati Manual 15

The Frascati Manual “The Measurement of Scientific and Technical Activities: Proposed Standard Practice for Surveys of Research and Development. Frascati Manual” 16
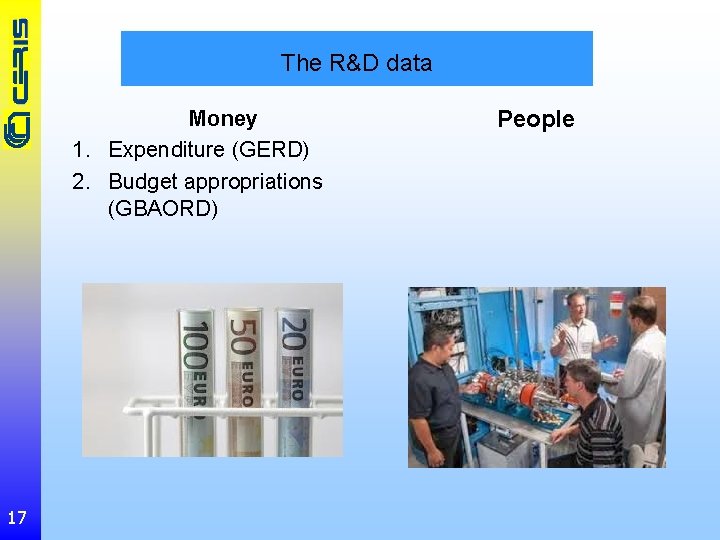
The R&D data Money 1. Expenditure (GERD) 2. Budget appropriations (GBAORD) 17 People
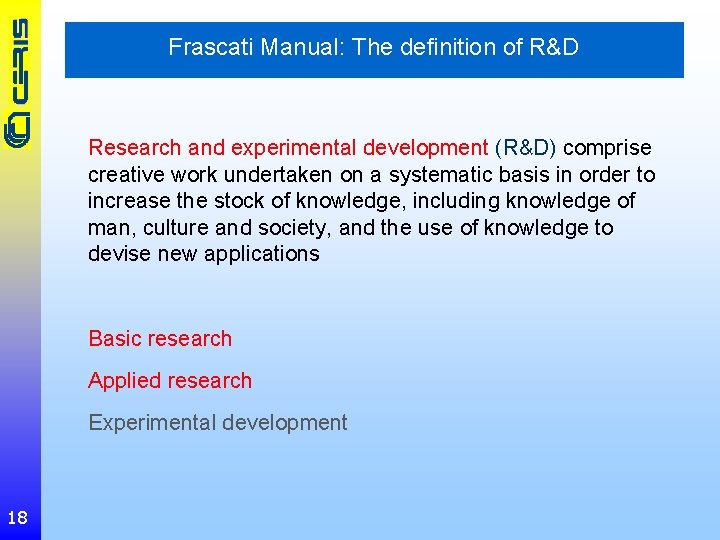
Frascati Manual: The definition of R&D Research and experimental development (R&D) comprise creative work undertaken on a systematic basis in order to increase the stock of knowledge, including knowledge of man, culture and society, and the use of knowledge to devise new applications Basic research Applied research Experimental development 18
Frascati Manual: the definition of R&D personnel All persons employed directly on R&D should be counted, as well as those providing direct services such as R&D managers, administrators, and clerical staff Researchers Technicians and equivalent staff Other supporting staff 19
R&D surveys Census survey Yearly survey using a questionnaire Skepticism at the beginning of the exercise Borderline between R&D and non-R&D activities Avaliability of information at the level of performer Use of R&D data for political and administrative purposes Juridical legitimation of the definition Response rate Data quality: comparable with other economic statistics 20

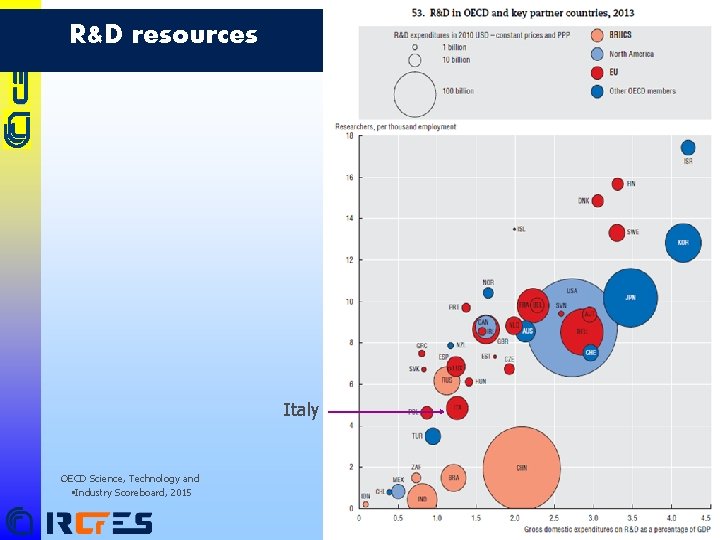
R&D resources Italy OECD Science, Technology and • Industry Scoreboard, 2015 22 22 22
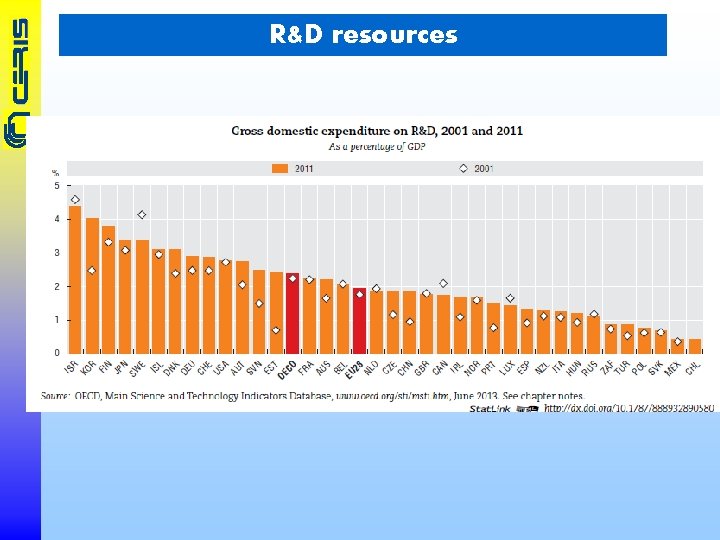
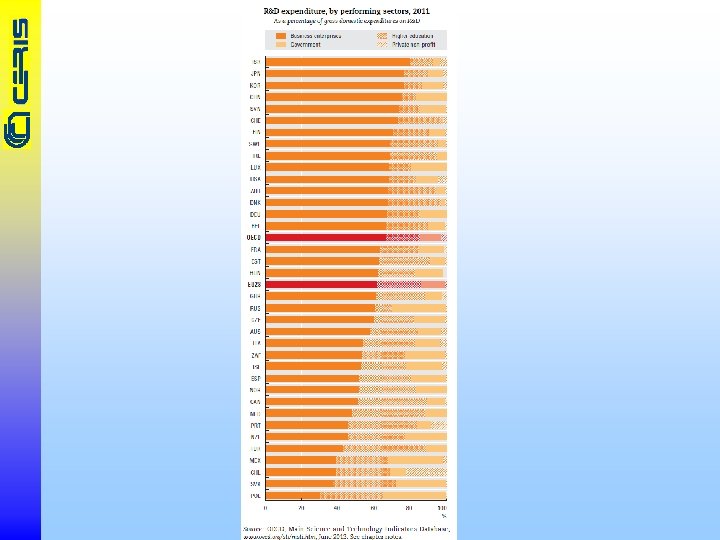
R&D resources
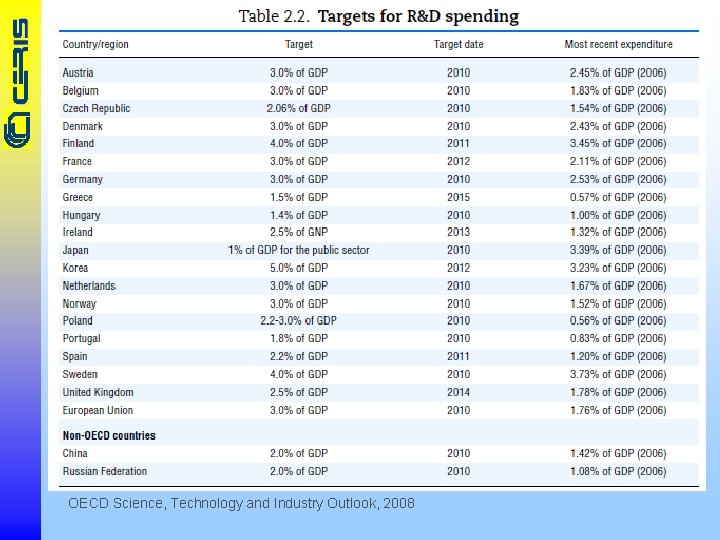
OECD Science, Technology and Industry Outlook, 2008
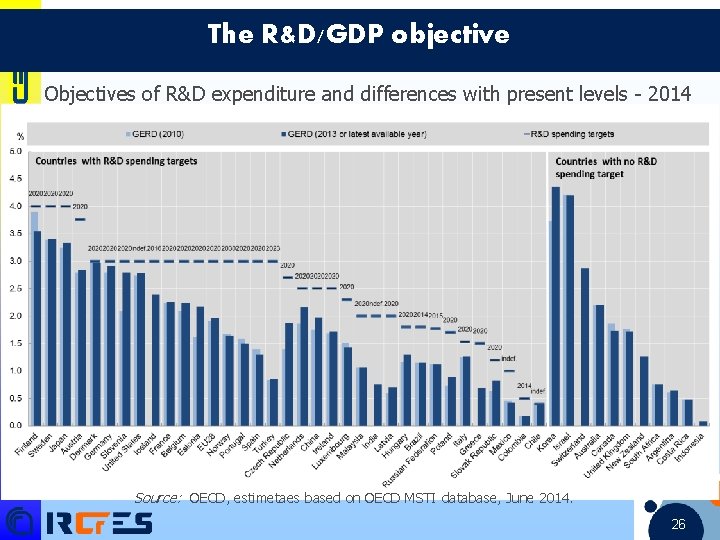
The R&D/GDP objective Objectives of R&D expenditure and differences with present levels - 2014 Source: OECD, estimetaes based on OECD MSTI database, June 2014. 26 26 26

Oslo Manual Harmonised questionnaire 27
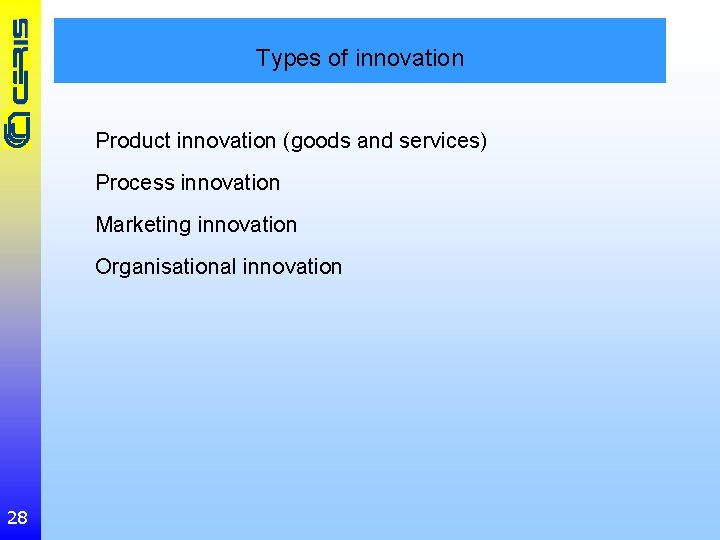
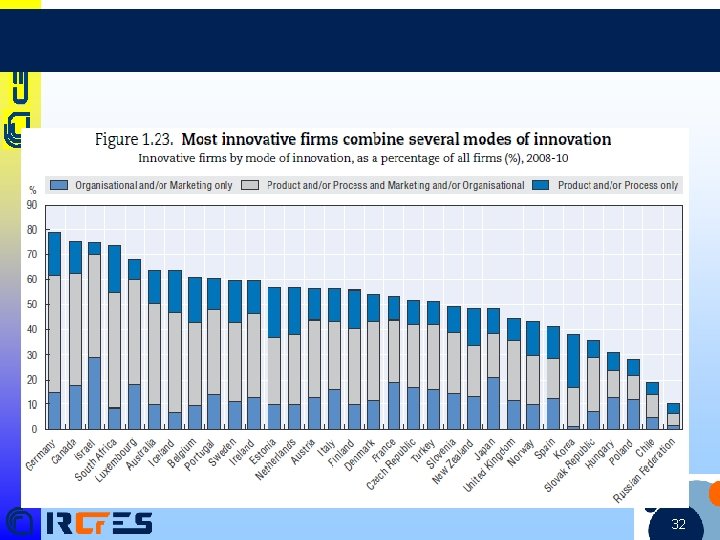
Types of innovation Product innovation (goods and services) Process innovation Marketing innovation Organisational innovation 28
Types of innovation A product innovation is the introduction of a good or service that is new or significantly improved with respect to its characteristics or intended uses. This includes significant improvements in technical specifications, components and materials, incorporated software, user friendliness or other functional characteristics. A process innovation is the implementation of a new or significantly improved production or delivery method. This includes significant changes in techniques, equipment and/or software A marketing innovation is the implementation of a new marketing method involving significant changes in product design or packaging, product placement, product promotion or pricing. An organisational innovation is the implementation of a new organisational method in the firm’s business practices, workplace organisation or external relations. 29
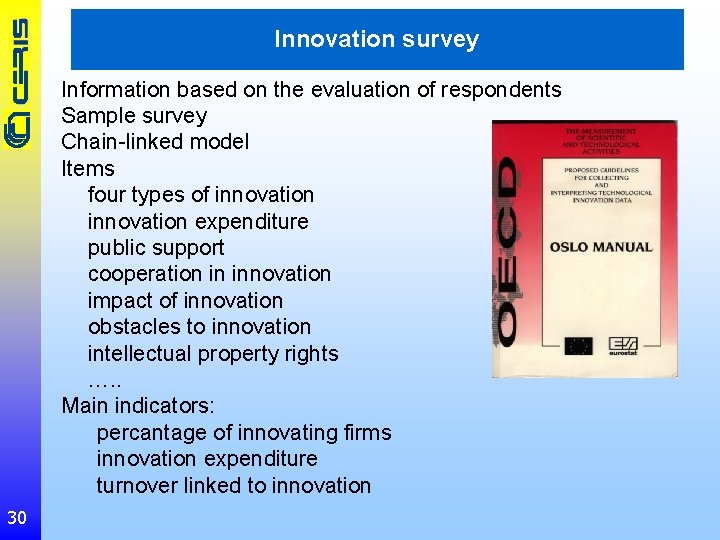
Innovation survey Information based on the evaluation of respondents Sample survey Chain-linked model Items four types of innovation expenditure public support cooperation in innovation impact of innovation obstacles to innovation intellectual property rights …. . Main indicators: percantage of innovating firms innovation expenditure turnover linked to innovation 30
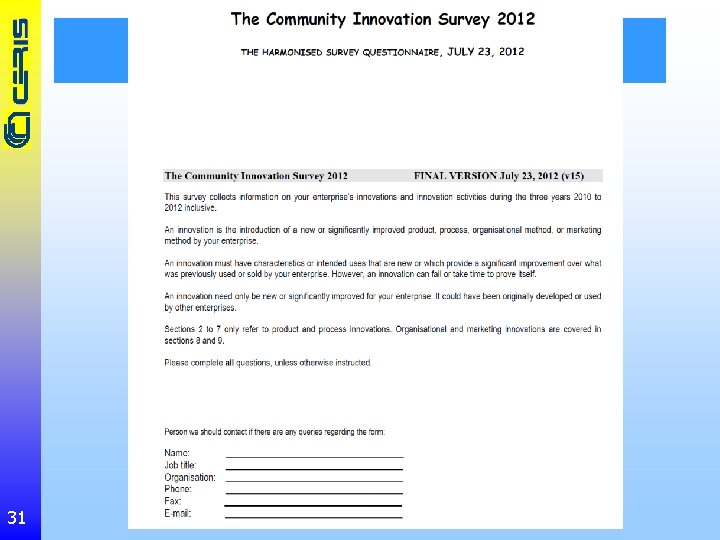
The harmonised questionnaire 31
32 32 32
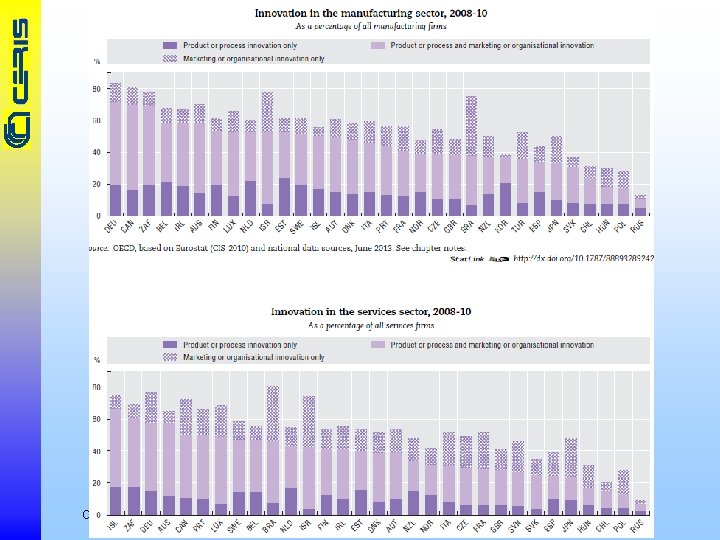
OECD Science, Technology and Industry Scoreboard, 2013
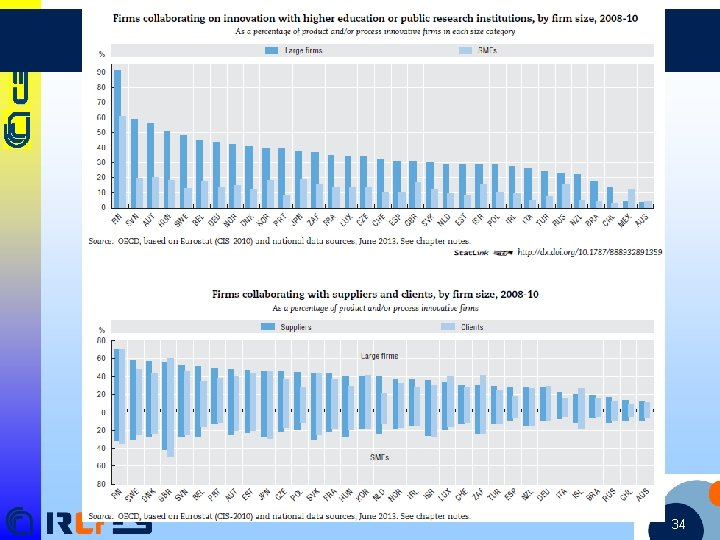
34 34 34
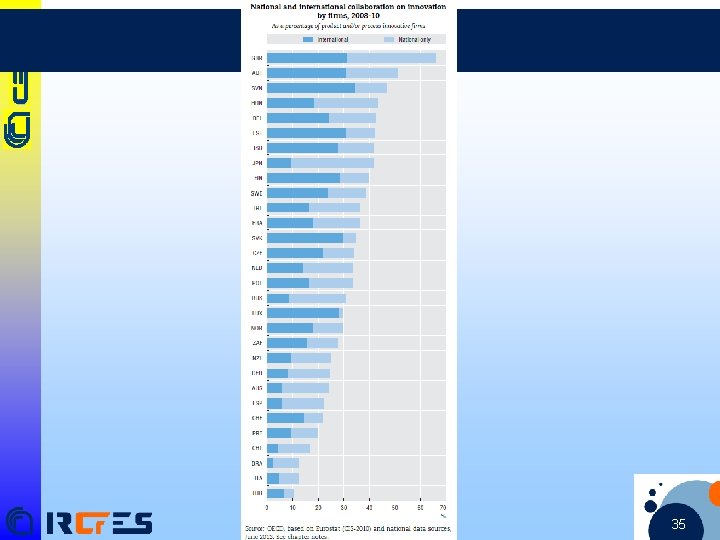
35 35 35
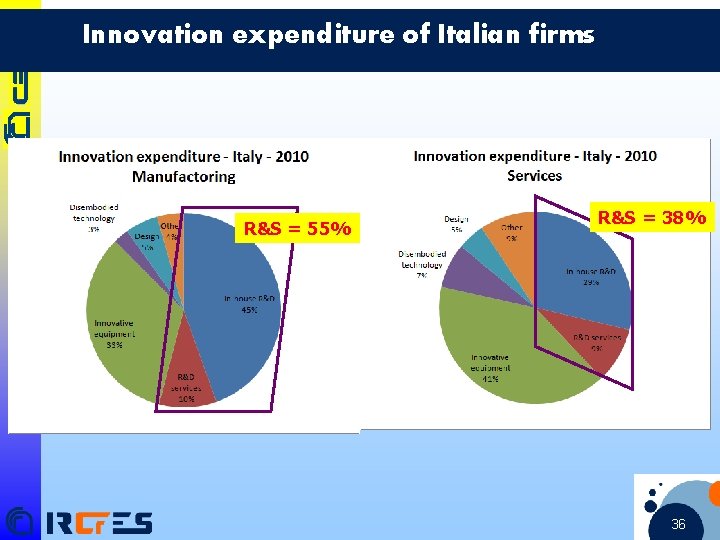
Innovation expenditure of Italian firms R&S = 55% R&S = 38% 36 36 36
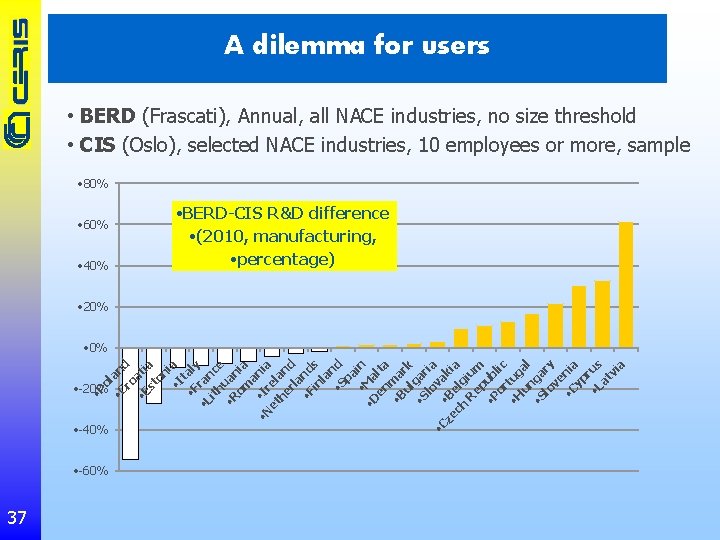
A dilemma for users • BERD (Frascati), Annual, all NACE industries, no size threshold • CIS (Oslo), selected NACE industries, 10 employees or more, sample • 80% • 60% • 40% • BERD-CIS R&D difference • (2010, manufacturing, • percentage) • 20% • P ol • C and ro • E ati st a on i • I a t • F aly • L ran it hu ce • R an om ia a • N • Ir nia et ela he n rl d a • F nd in s la n • S d pa • M in • D a en lta • B ma ul rk • S gar lo ia va • C ze • B ki ch elg a R ium ep • P ub or lic • H tug un al • S ga lo ry ve • C nia yp r • L us at vi a • 0% • -20% • -40% • -60% 37
Patents 38
Patents 39
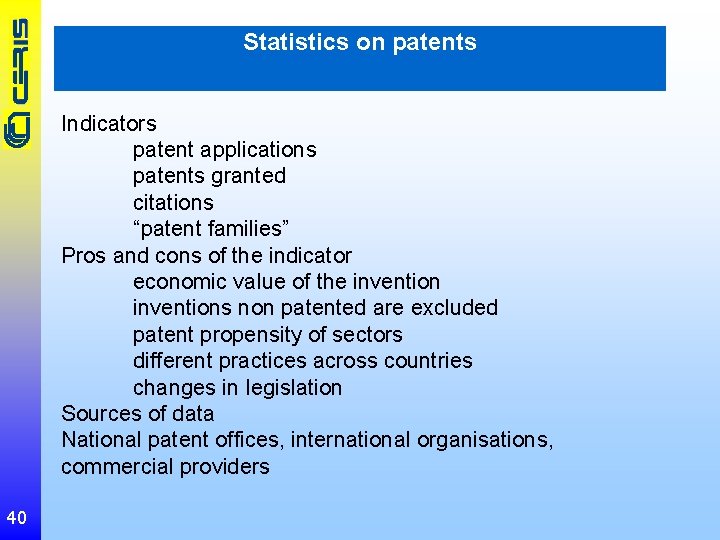
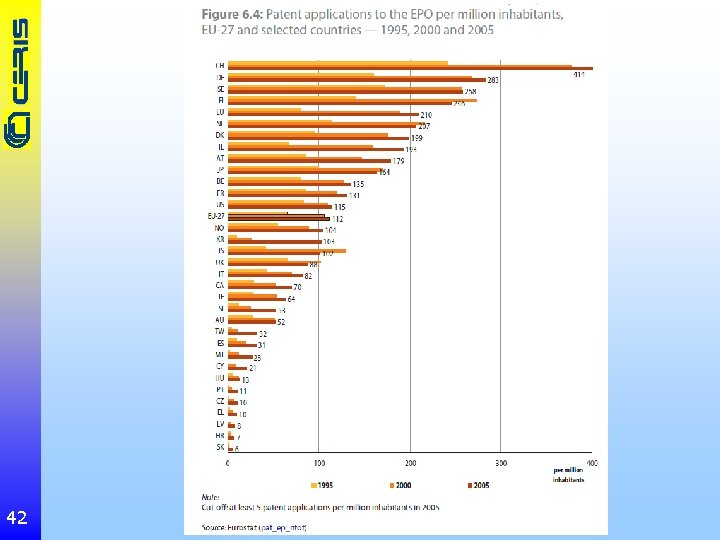
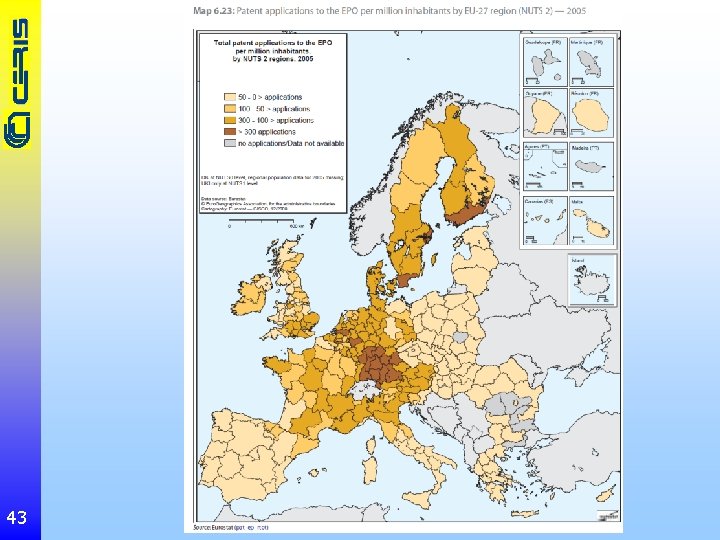
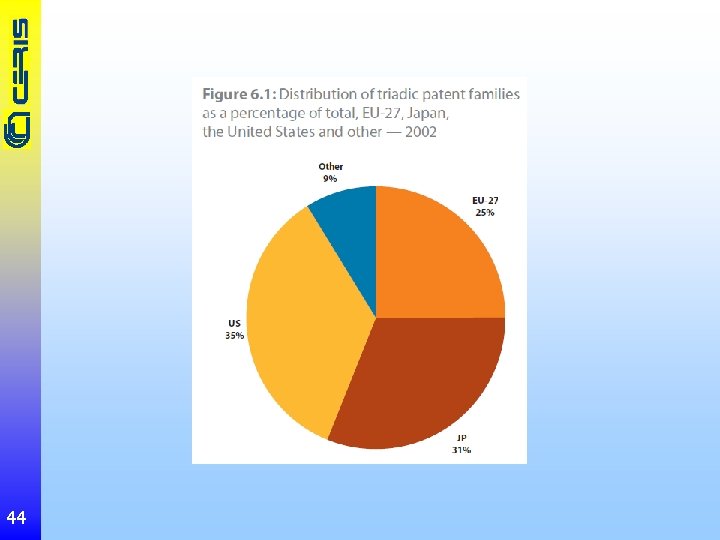
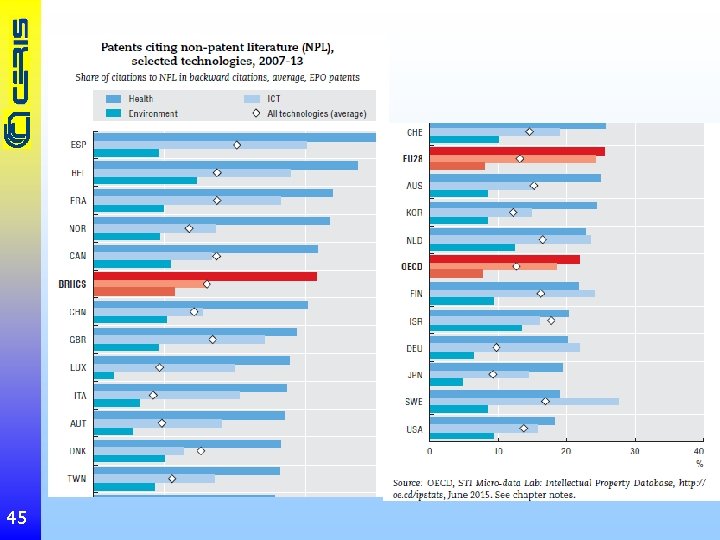
Statistics on patents Indicators patent applications patents granted citations “patent families” Pros and cons of the indicator economic value of the inventions non patented are excluded patent propensity of sectors different practices across countries changes in legislation Sources of data National patent offices, international organisations, commercial providers 40
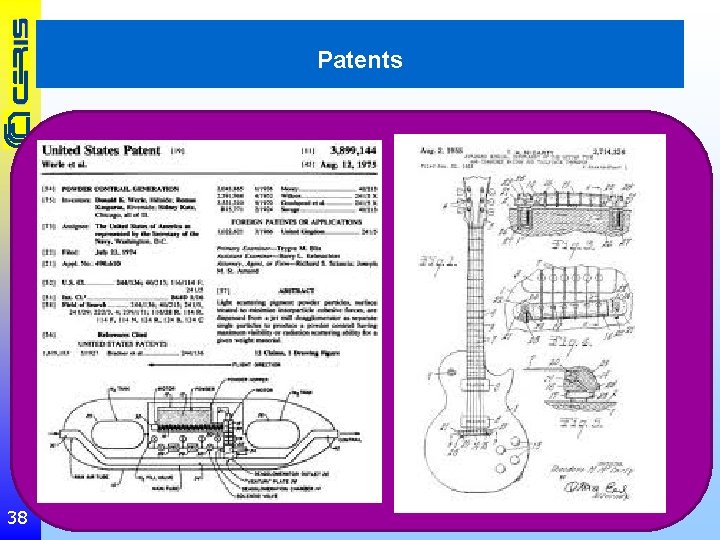
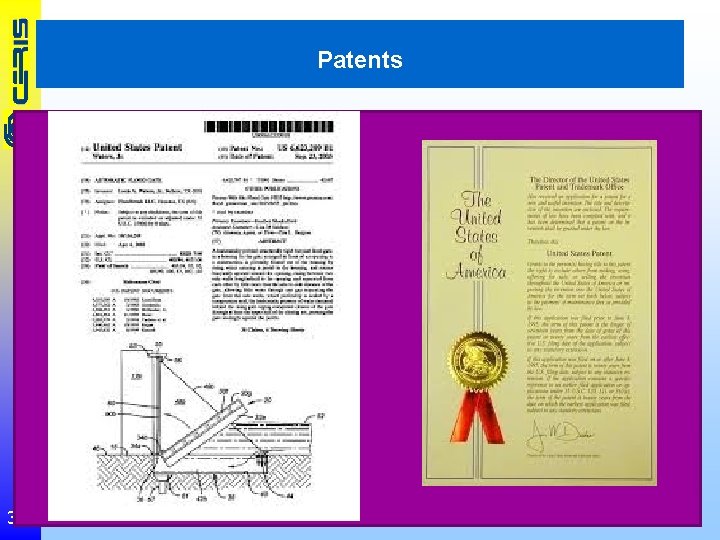
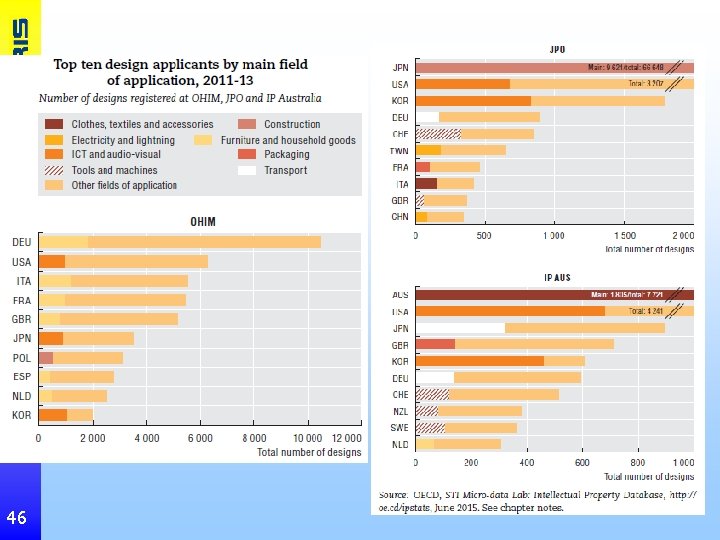
Patents and designs A patent for industrial invention protects a technical solution (an apparatus, a device, a substance or an industrial method or process, or a specific use) able to solve a problem, which fulfills the fundamental requirements of novelty, originality and industrial applicability. The technical solution is novel if it has not been disclosed, by the inventor or by third parties, worldwide before the filing date of the patent application. An industrial design right is an intellectual property right that protects the visual design of objects that are not purely utilitarian. An industrial design consists of the creation of a shape, configuration or composition of pattern or color, or combination of pattern and color in three-dimensional form containing aesthetic value. An industrial design can be a two- or three-dimensional pattern used to produce a product, industrial commodity or handicraft.
42
43
44
45
46
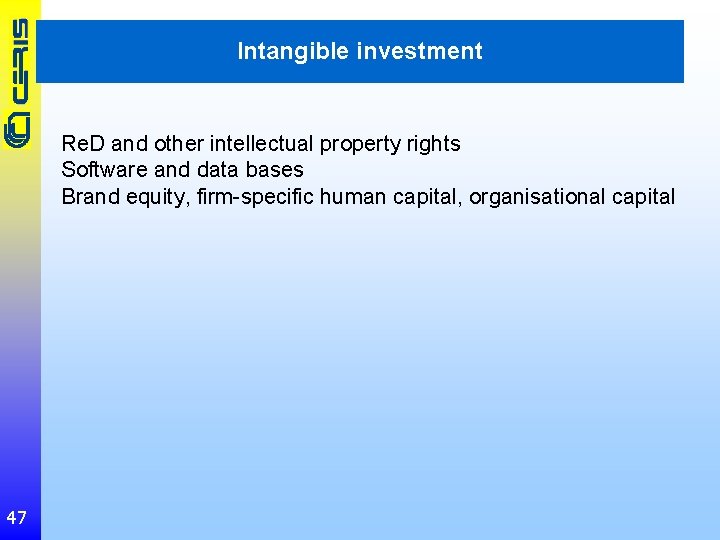
Intangible investment Re. D and other intellectual property rights Software and data bases Brand equity, firm-specific human capital, organisational capital 47
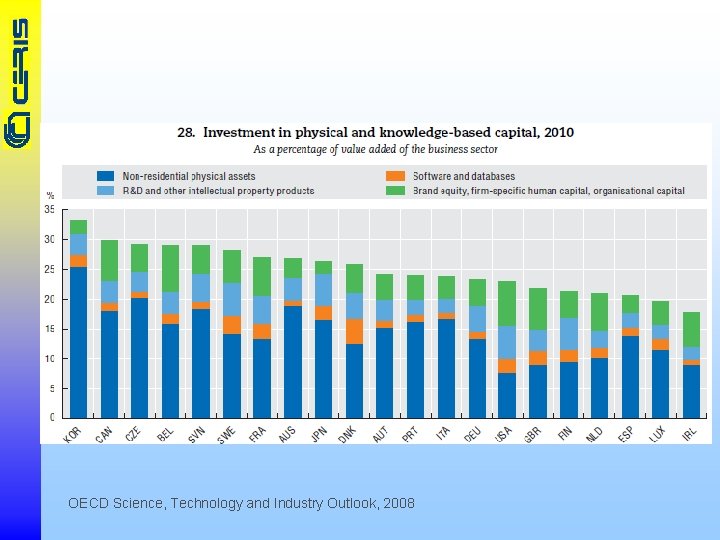
OECD Science, Technology and Industry Outlook, 2008
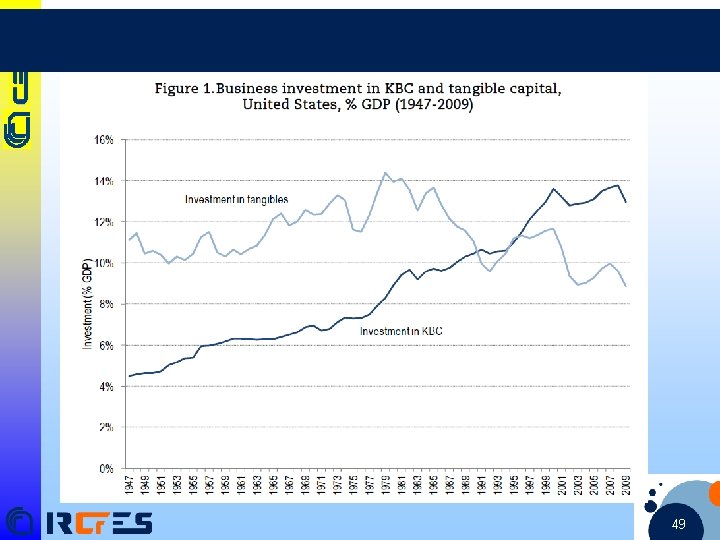
49 49 49
Technological balance of payments Types of operation patents, licences on patents, inventions, know-how, licences on know-how, trade marks, designs, technical assistance, support services of technicians and experts, personnel training, technical studies, R&S services Survey methodologies Role of multinationals International comparability 50
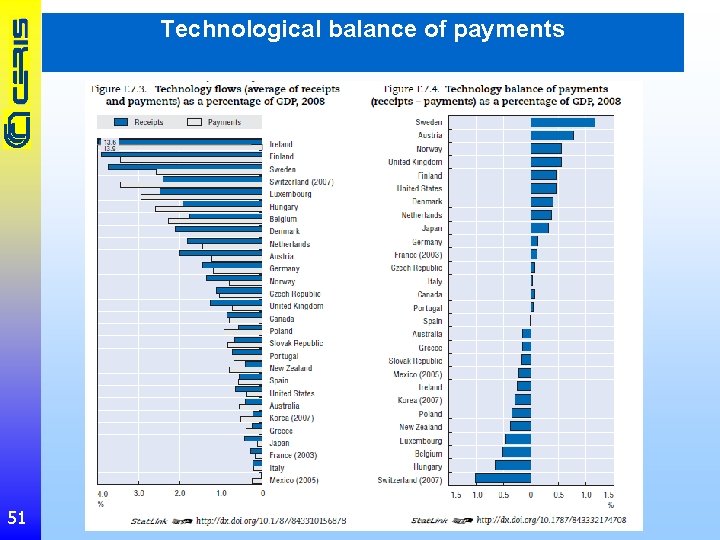
Technological balance of payments 51
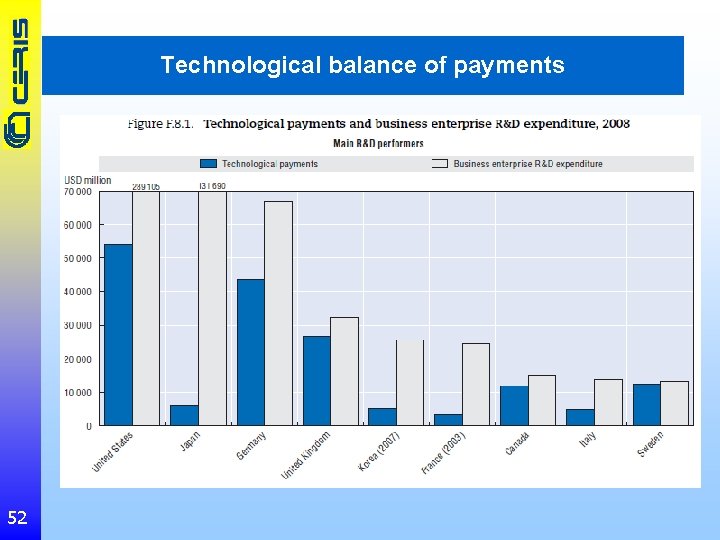
Technological balance of payments 52
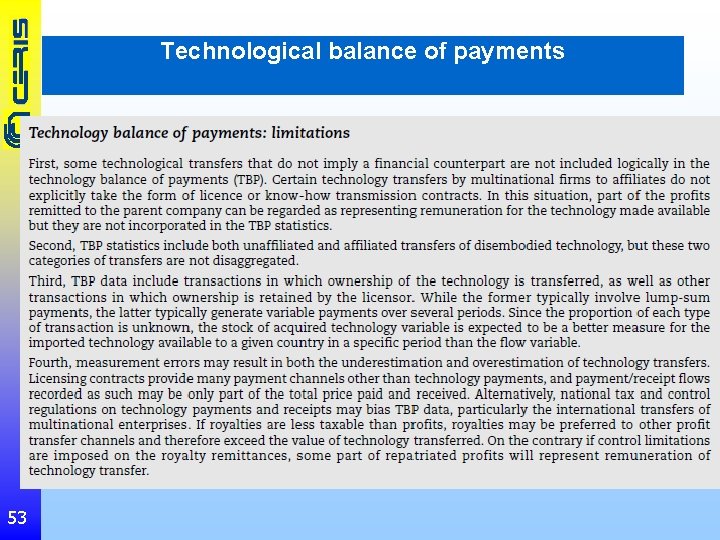
Technological balance of payments 53
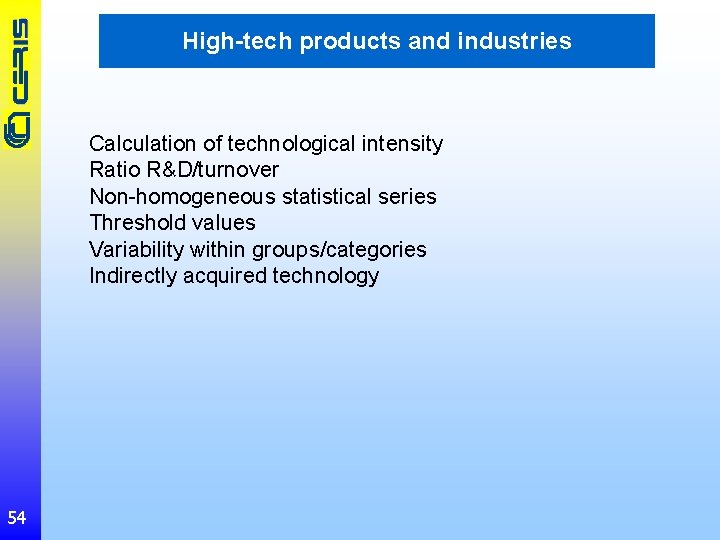
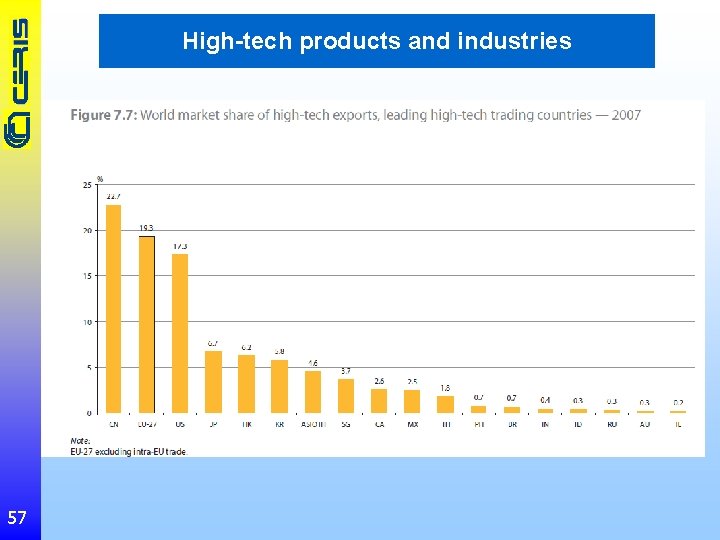
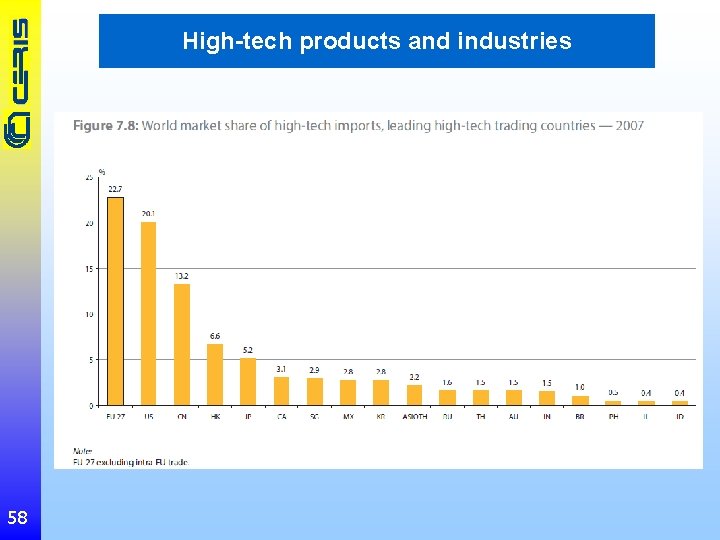
High-tech products and industries Calculation of technological intensity Ratio R&D/turnover Non-homogeneous statistical series Threshold values Variability within groups/categories Indirectly acquired technology 54
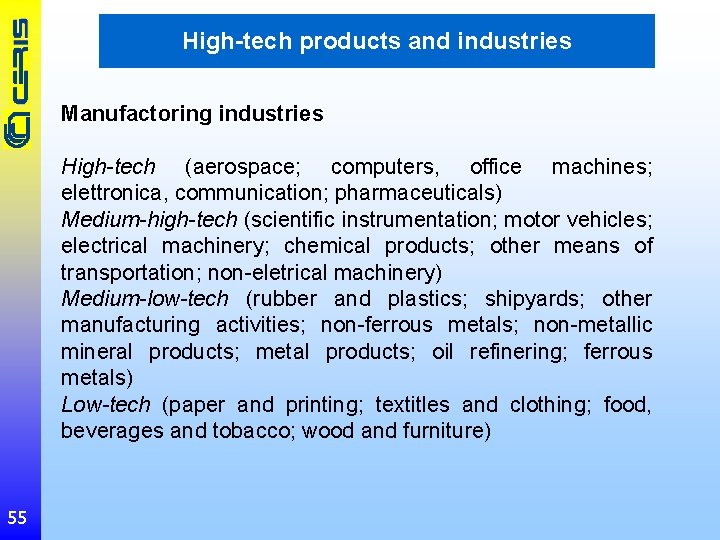
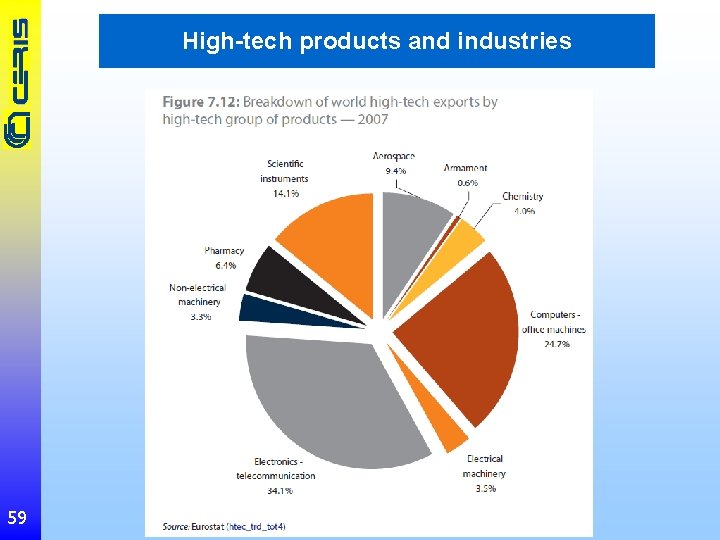
High-tech products and industries Manufactoring industries High-tech (aerospace; computers, office machines; elettronica, communication; pharmaceuticals) Medium-high-tech (scientific instrumentation; motor vehicles; electrical machinery; chemical products; other means of transportation; non-eletrical machinery) Medium-low-tech (rubber and plastics; shipyards; other manufacturing activities; non-ferrous metals; non-metallic mineral products; metal products; oil refinering; ferrous metals) Low-tech (paper and printing; textitles and clothing; food, beverages and tobacco; wood and furniture) 55
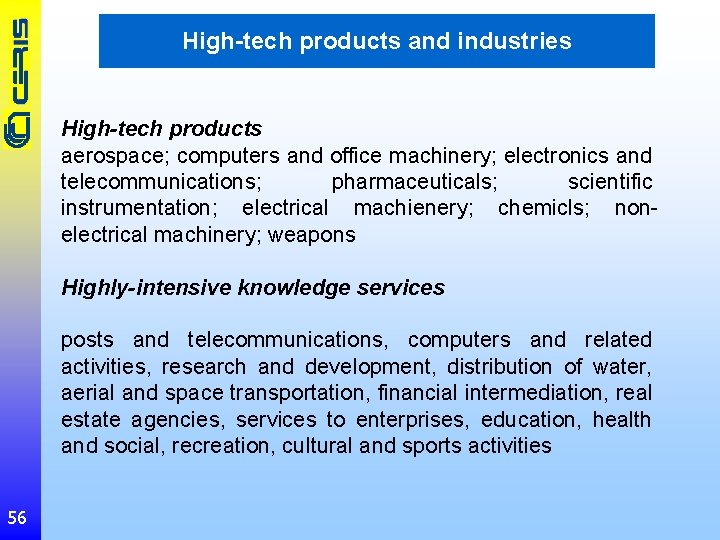
High-tech products and industries High-tech products aerospace; computers and office machinery; electronics and telecommunications; pharmaceuticals; scientific instrumentation; electrical machienery; chemicls; nonelectrical machinery; weapons Highly-intensive knowledge services posts and telecommunications, computers and related activities, research and development, distribution of water, aerial and space transportation, financial intermediation, real estate agencies, services to enterprises, education, health and social, recreation, cultural and sports activities 56
High-tech products and industries 57
High-tech products and industries 58
High-tech products and industries 59
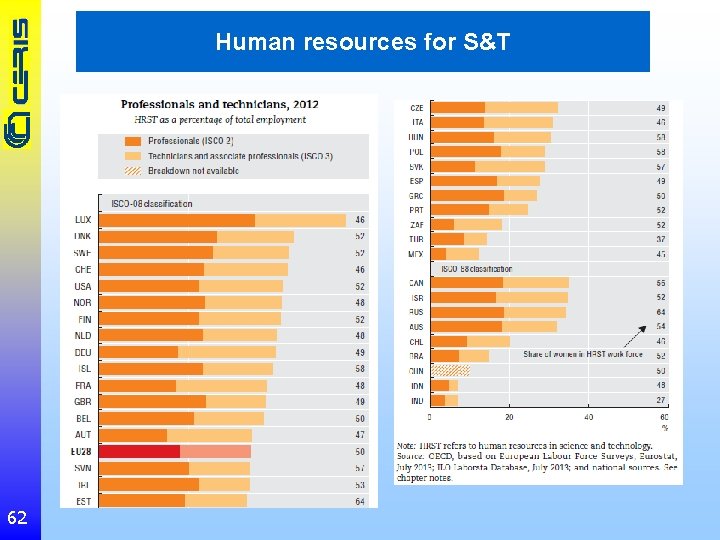
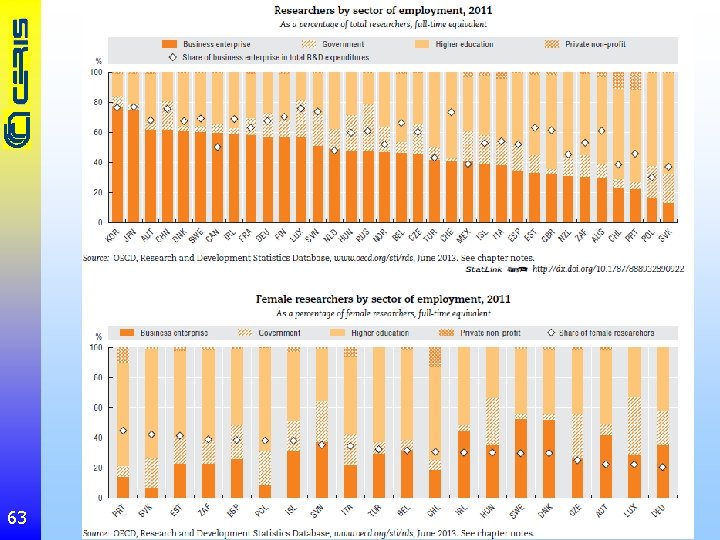
Human resources for S&T Resources actually or potentially involved in the systematic generarion, advancement, diffusion, use of scientific and technological knowledge The statistical universe of the Canberra manual is composed of highly skilled individuals, in particular individuals who have either successfully completed third-level education or who are working as professionals or technicians, for which stocks and flows are measured 60
Human resources for S&T Analisys of stocks and flows Harmonisation at international level Various data sets available Education statistics (Ph. D) 61
Human resources for S&T 62
Human resources for S&T 63
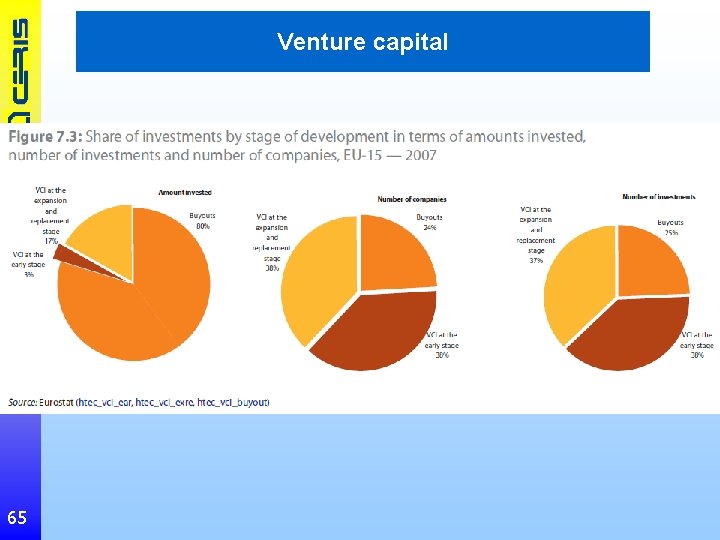
Venture capital Type of funder Stage of venture capital early stahe - exploration start (start-up) expansion Data sources 64
Venture capital 65
Bibliometrics Communication amongst scientists Various types of scientific publications (books, articles, reviews, comments, etc. ) Features of data bases (discipline, language, etc. ) Number of authors (fractioning) Indicators Publications Citations Co-citations Impact factor of journals No manual Commercial data scources (trasparency) 66
67

68
Bibliometrics 69
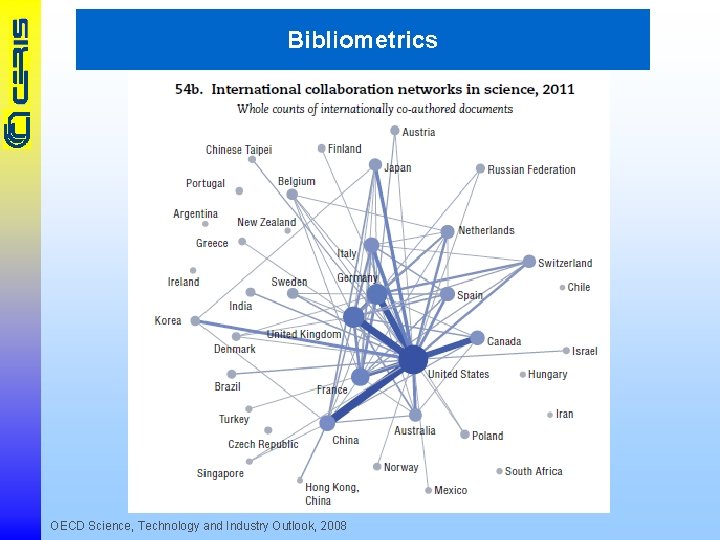
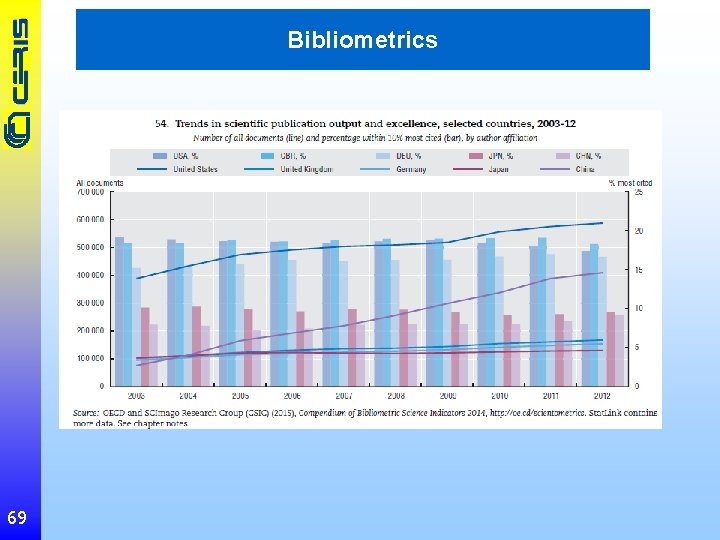
Bibliometrics OECD Science, Technology and Industry Outlook, 2008
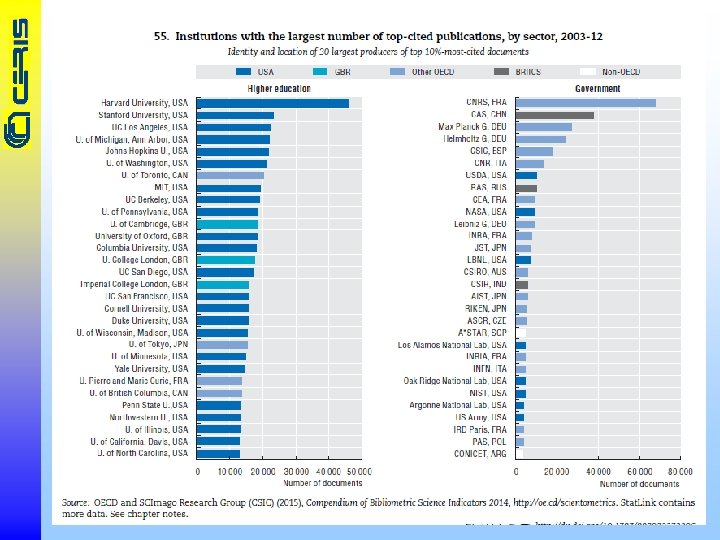
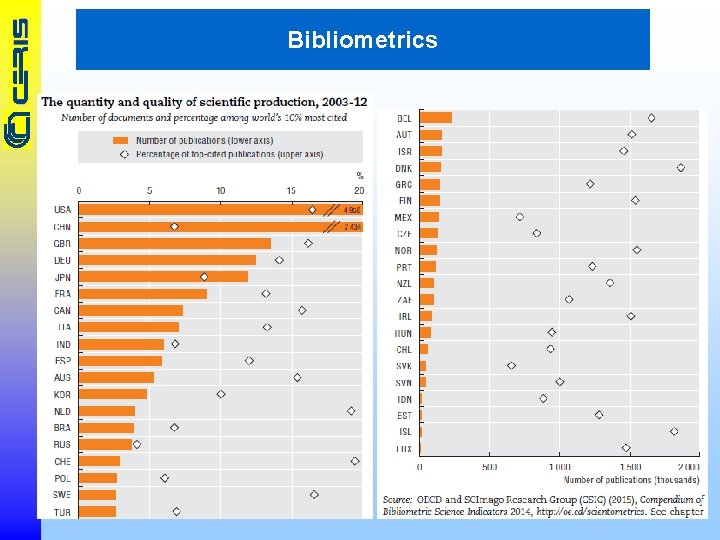
Bibliometrics
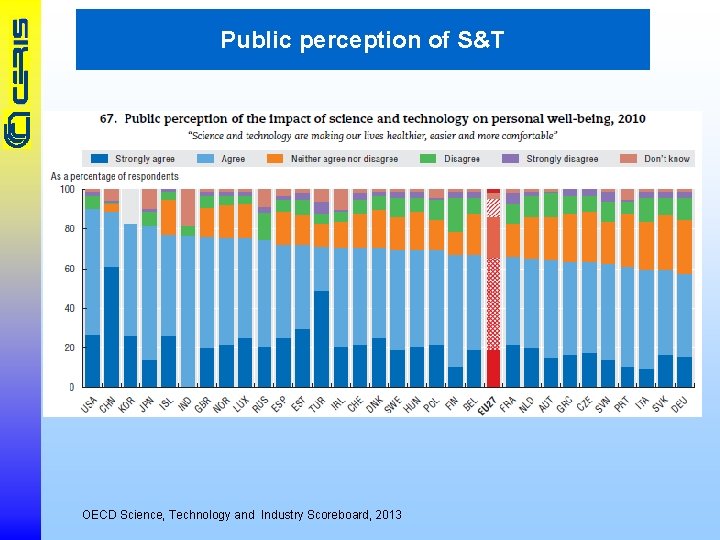
Public perception of S&T OECD Science, Technology and Industry Scoreboard, 2013
Public perception of S&T The perception of science and technology by society EUROBAROMETER 74
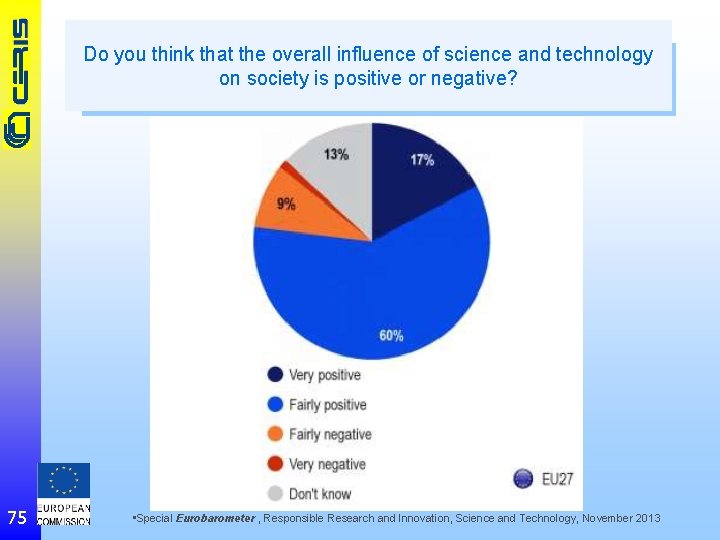
Do you think that the overall influence of science and technology on society is positive or negative? 75 • Special Eurobarometer , Responsible Research and Innovation, Science and Technology, November 2013
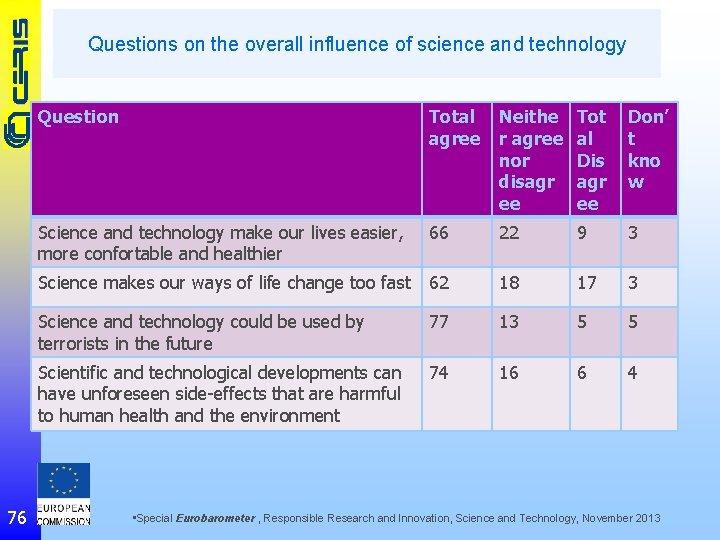
Questions on the overall influence of science and technology 76 Question Total agree Neithe r agree nor disagr ee Tot al Dis agr ee Don’ t kno w Science and technology make our lives easier, more confortable and healthier 66 22 9 3 Science makes our ways of life change too fast 62 18 17 3 Science and technology could be used by terrorists in the future 77 13 5 5 Scientific and technological developments can have unforeseen side-effects that are harmful to human health and the environment 74 16 6 4 • Special Eurobarometer , Responsible Research and Innovation, Science and Technology, November 2013
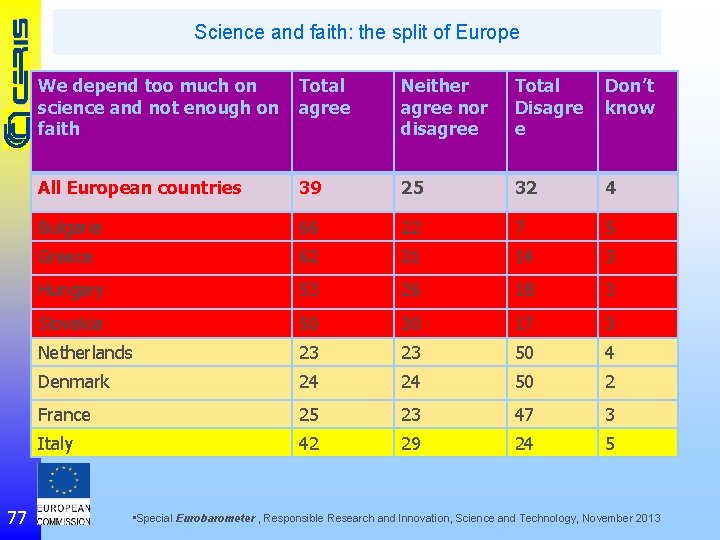
Science and faith: the split of Europe 77 We depend too much on science and not enough on faith Total agree Neither agree nor disagree Total Disagre e Don’t know All European countries 39 25 32 4 Bulgaria 66 22 7 5 Greece 62 21 14 3 Hungary 53 26 18 3 Slovakia 50 30 17 3 Netherlands 23 23 50 4 Denmark 24 24 50 2 France 25 23 47 3 Italy 42 29 24 5 • Special Eurobarometer , Responsible Research and Innovation, Science and Technology, November 2013
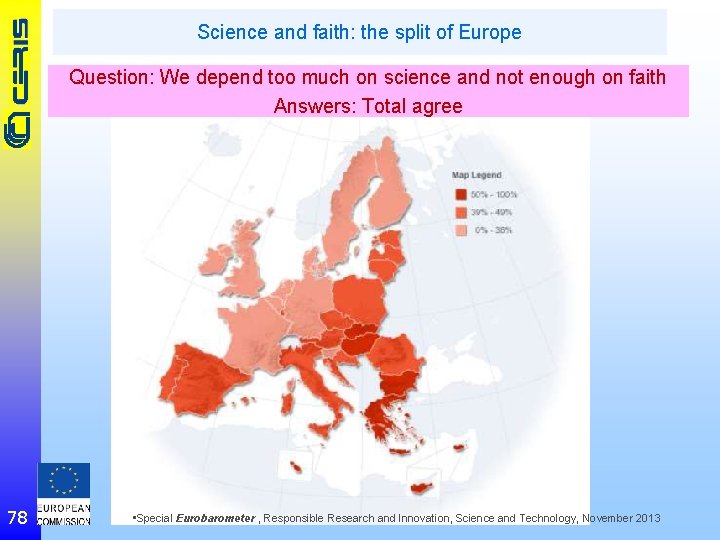
Science and faith: the split of Europe Question: We depend too much on science and not enough on faith Answers: Total agree 78 • Special Eurobarometer , Responsible Research and Innovation, Science and Technology, November 2013
Use of indicators 79
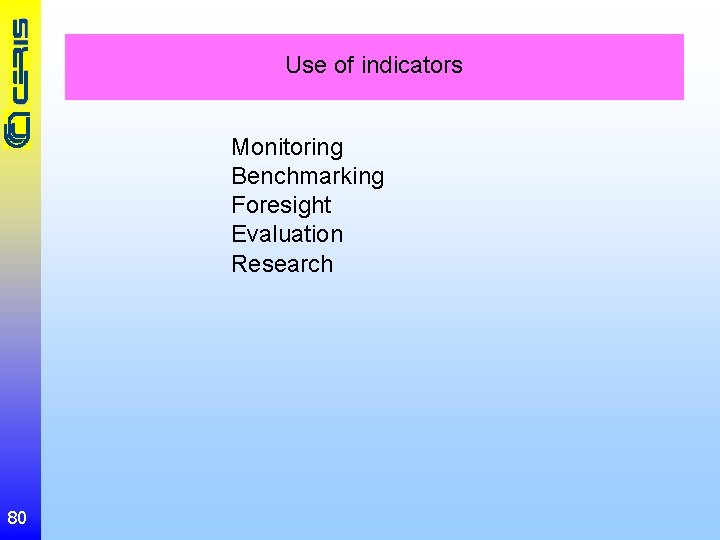
Use of indicators Monitoring Benchmarking Foresight Evaluation Research 80
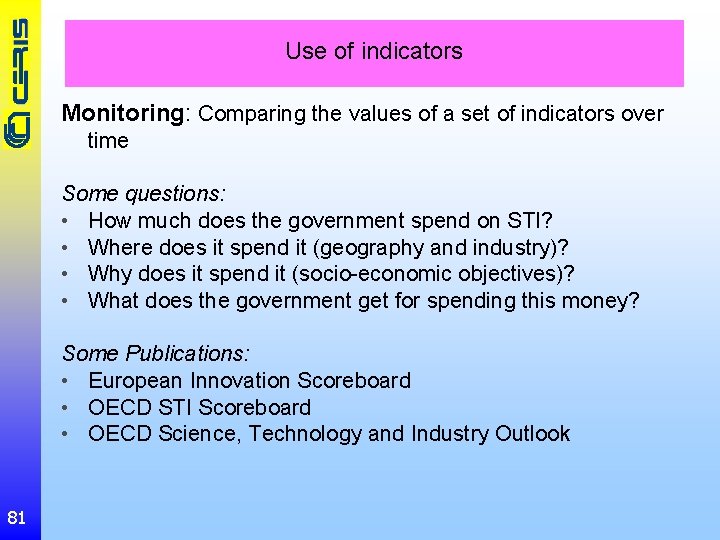
Use of indicators Monitoring: Comparing the values of a set of indicators over time Some questions: • How much does the government spend on STI? • Where does it spend it (geography and industry)? • Why does it spend it (socio-economic objectives)? • What does the government get for spending this money? Some Publications: • European Innovation Scoreboard • OECD STI Scoreboard • OECD Science, Technology and Industry Outlook 81
Use of indicators Monitoring: Comparing the values of a set of indicators over time Indicators: • Innovation • R&D • Capital investment • Intellectual property rights • Learning • Education • Design 82
Use of indicators Benchmarking: 1. Decide upon a set of indicators which are relevant to policy objectives, and then decide about targets to be achieved 2. Agree on a set of indicators and then select another system which is performing better Examples: Ranking of countries and institutions The 3% Lisbon target and ensuing policies (focus the public debate) 83
Use of indicators Foresight: viewing the future involving a mix of quantitative and qualitative evaluation methods, including a set of a current set of indicators. Discern likely paths for emerging technologies, possible futures for an economic region, or alternative responses to a coming problem such as the country should function when the oil runs out. Indicators provide a background to the process but in general are too aggregated 84
Use of indicators Evaluation: concerns the effective and efficient use allocation of resources in order to achieve a set of objectives Various methods: Quantitative (bibliometric analysis, turnover from new products, audits, etc. ) and qualitative (peer review) Research Assessment Exercise in the UK (now Research Excellence Framework) 85
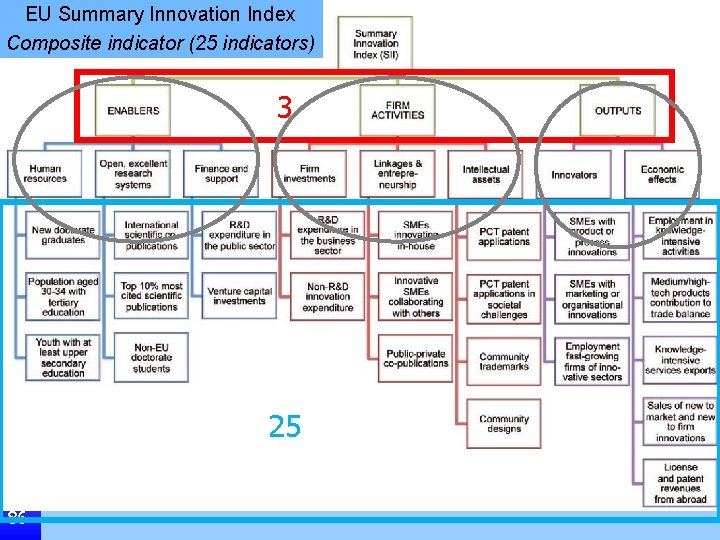
EU Summary Innovation Index Composite indicator (25 indicators) 3 25 86
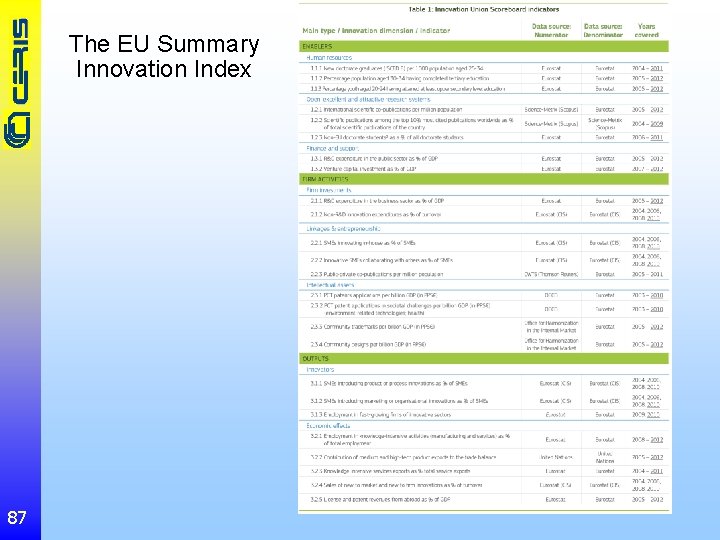
The EU Summary Innovation Index 87
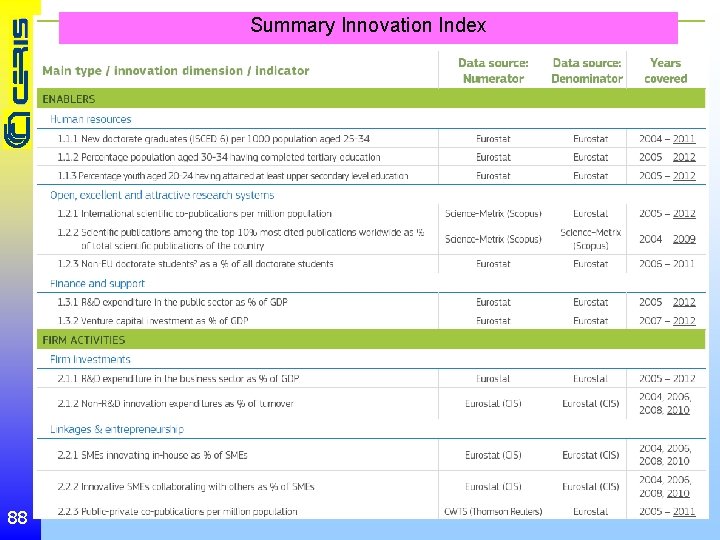
Summary Innovation Index The EU innovation performance indicator 88
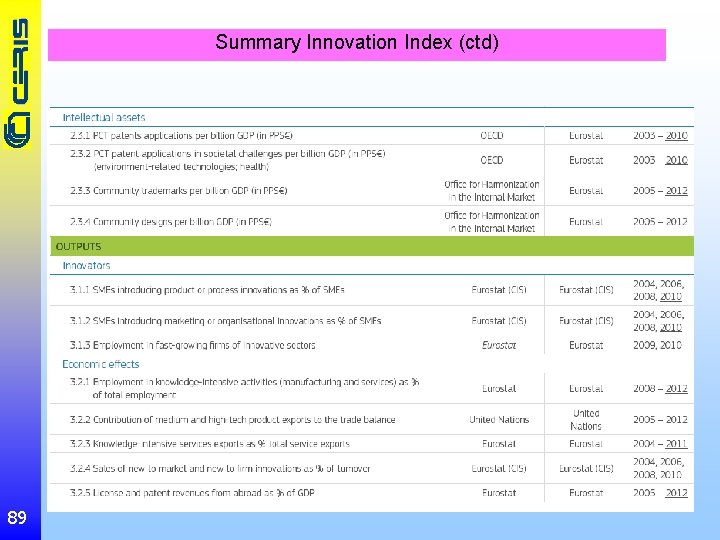
Summary Innovation Index (ctd) 89
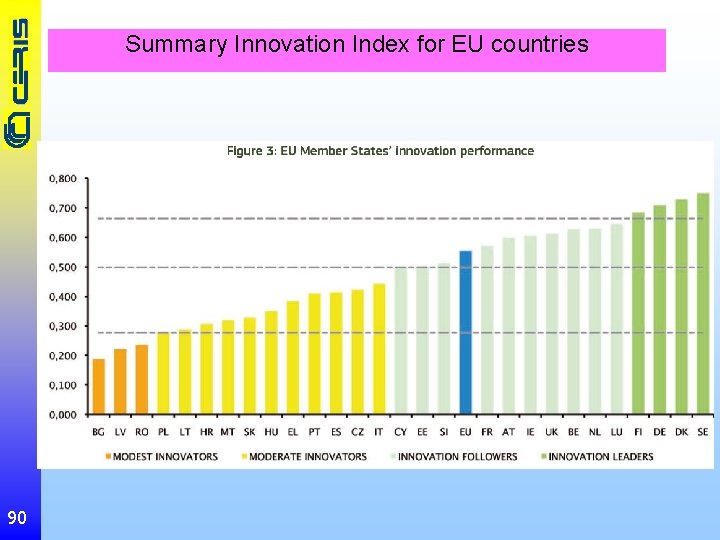
Summary Innovation Index for EU countries 90
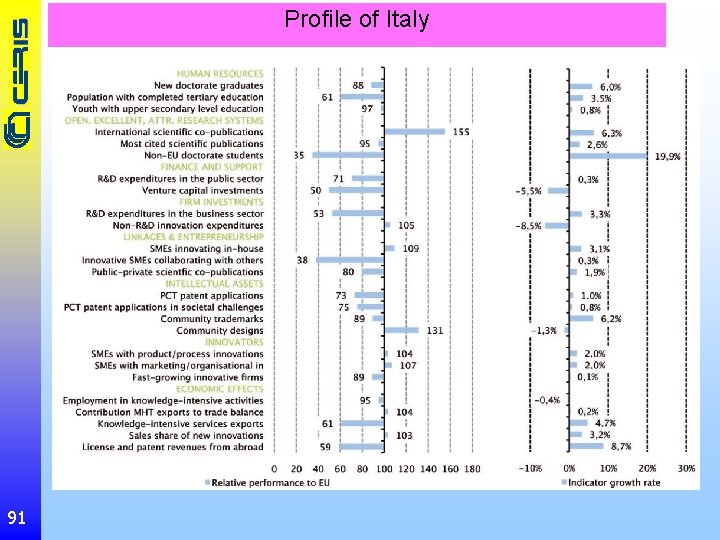
Profile of Italy 91
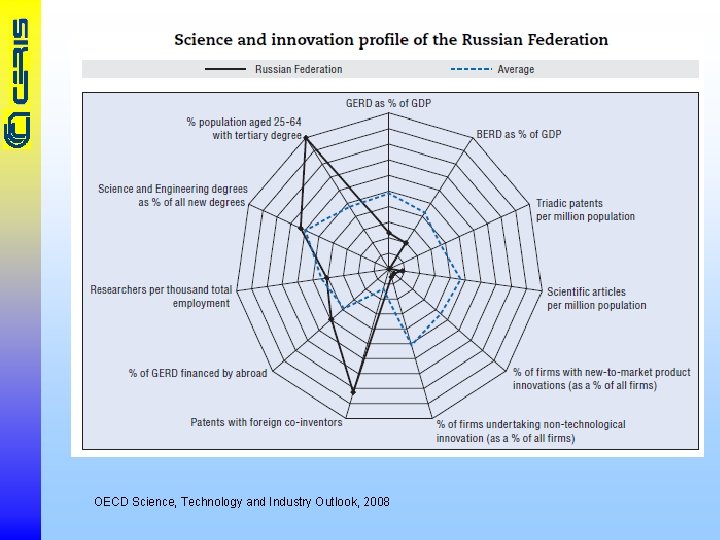
OECD Science, Technology and Industry Outlook, 2008

Ranking of universities
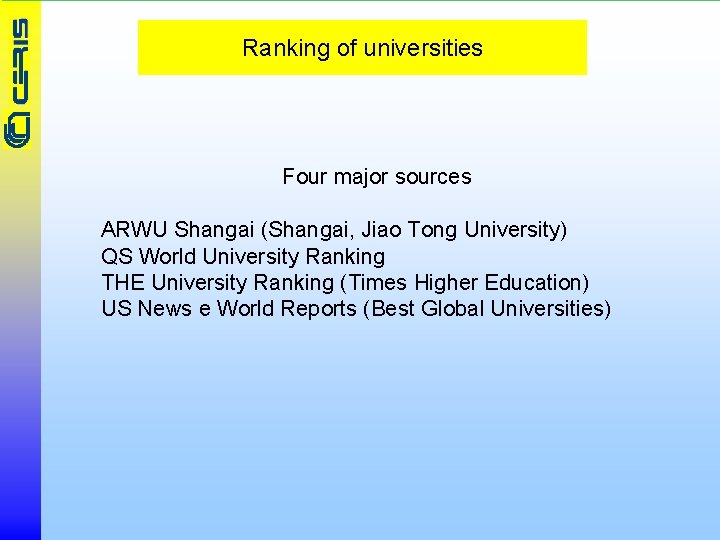
Ranking of universities Four major sources ARWU Shangai (Shangai, Jiao Tong University) QS World University Ranking THE University Ranking (Times Higher Education) US News e World Reports (Best Global Universities)
Academic Ranking of World Universities Shanghai Jiao Tong University “Starting from 2003, ARWU has been presenting the world Top 500 universities annually based on a set of objective indicators and third -party data. ARWU has been recognized as the precursor of global university rankings and the most trustworthy league table. ARWU adopts six objective indicators to rank world universities, including: -the number of alumni and staff winning Nobel Prizes and Fields Medals, -the number of Highly Cited Researchers, -the number of articles published in journals of Nature and Science, -the number of articles indexed in Science Citation Index Expanded and Social Sciences Citation Index, and -per capita performance. More than 1200 universities are actually ranked by ARWU every year and the best 500 universities are published. ”
Top UNIVERSITIES Worldwide university rankings, guides & events Criteria selected as the key pillars of what makes a world class university: Research Teaching Employability Internationalisation Facilities Social Responsibility Innovation Arts & Culture Inclusiveness Specialist Criteria
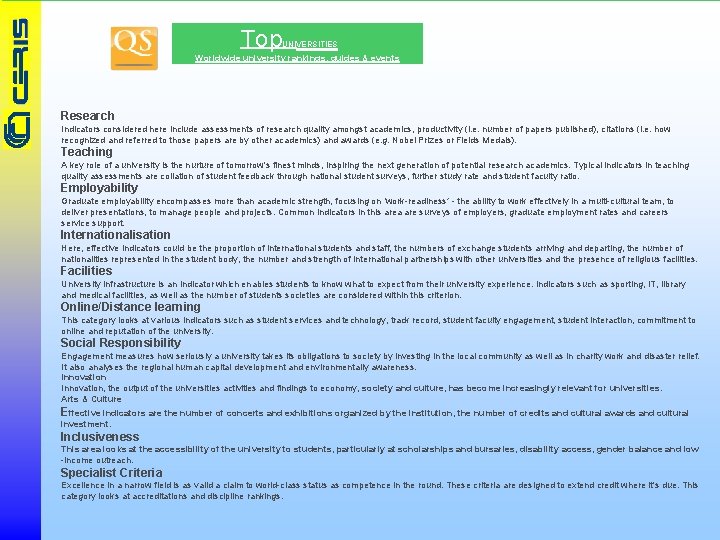
Top UNIVERSITIES Worldwide university rankings, guides & events Research Indicators considered here include assessments of research quality amongst academics, productivity (i. e. number of papers published), citations (i. e. how recognized and referred to those papers are by other academics) and awards (e. g. Nobel Prizes or Fields Medals). Teaching A key role of a university is the nurture of tomorrow's finest minds, inspiring the next generation of potential research academics. Typical indicators in teaching quality assessments are collation of student feedback through national student surveys, further study rate and student faculty ratio. Employability Graduate employability encompasses more than academic strength, focusing on ‘work-readiness’ - the ability to work effectively in a multi-cultural team, to deliver presentations, to manage people and projects. Common indicators in this area are surveys of employers, graduate employment rates and careers service support. Internationalisation Here, effective indicators could be the proportion of international students and staff, the numbers of exchange students arriving and departing, the number of nationalities represented in the student body, the number and strength of international partnerships with other universities and the presence of religious facilities. Facilities University infrastructure is an indicator which enables students to know what to expect from their university experience. Indicators such as sporting, IT, library and medical facilities, as well as the number of students societies are considered within this criterion. Online/Distance learning This category looks at various indicators such as student services and technology, track record, student faculty engagement, student interaction, commitment to online and reputation of the university. Social Responsibility Engagement measures how seriously a university takes its obligations to society by investing in the local community as well as in charity work and disaster relief. It also analyses the regional human capital development and environmentally awareness. Innovation, the output of the universities activities and findings to economy, society and culture, has become increasingly relevant for universities. Arts & Culture Effective indicators are the number of concerts and exhibitions organized by the institution, the number of credits and cultural awards and cultural investment. Inclusiveness This area looks at the accessibility of the university to students, particularly at scholarships and bursaries, disability access, gender balance and low -income outreach. Specialist Criteria Excellence in a narrow field is as valid a claim to world-class status as competence in the round. These criteria are designed to extend credit where it's due. This category looks at accreditations and discipline rankings.
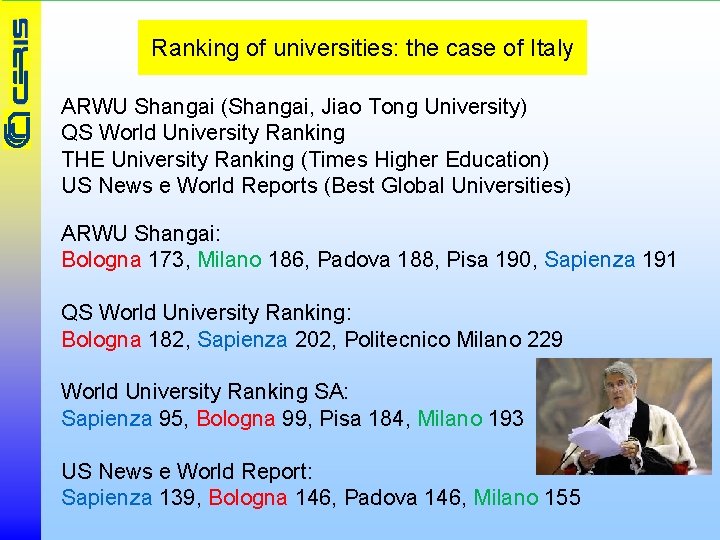
Ranking of universities: the case of Italy ARWU Shangai (Shangai, Jiao Tong University) QS World University Ranking THE University Ranking (Times Higher Education) US News e World Reports (Best Global Universities) ARWU Shangai: Bologna 173, Milano 186, Padova 188, Pisa 190, Sapienza 191 QS World University Ranking: Bologna 182, Sapienza 202, Politecnico Milano 229 World University Ranking SA: Sapienza 95, Bologna 99, Pisa 184, Milano 193 US News e World Report: Sapienza 139, Bologna 146, Padova 146, Milano 155
The art of using STI indicators 99
Use of indicators (Benoit Godin) As OECD admitted: “Monitoring and benchmarking are not coupled with policy evaluation (…). They are seldom used for evaluation purposes (…) but to analyse [counties’] position vis -à-vis competing countries and to motivate adaptation or more intense policy efforts (…). ” “Official statistics mainly served discourse purposes, and in this sense the accounting framework and the statistics presented within it were influential because they fit perfectly well with the policy discourse on rationality, efficiency and accountability: it aligns and frames the science system, by way of statistics, as goal-oriented and accountable. As it actually is, the accounting in official statistics on science is a metaphor, not an accounting exercise as such” 100
A rhetoric device: a plethora of figures and graphs “In the various studies on productivity and the New Economy the OECD constantly reminded the reader that the links between science, technology and productivity have not been demonstrated”. “A large series of graphs and figures could persuade the reader of the seriousness of the study. Although no statistics could be used to prove the emergence of the New Economy, graphs and figures nevertheless served the purpose of empiricism”. (Godin, 2004) 101
Use of indicators (Benoit Godin) The rhetoric of numbers Policy prescriptions based on shaking statistical evidence (New Economy) The “umbrella” concept, slogans, buzzwords, which shape new ways to arrange old indicators 102
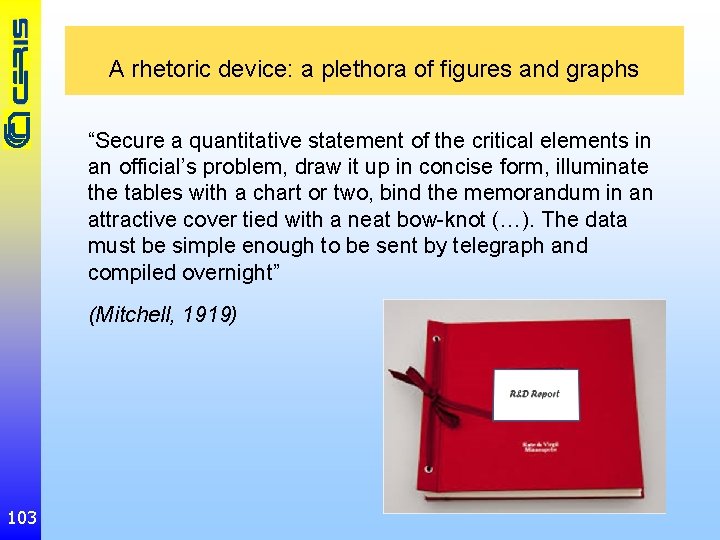
A rhetoric device: a plethora of figures and graphs “Secure a quantitative statement of the critical elements in an official’s problem, draw it up in concise form, illuminate the tables with a chart or two, bind the memorandum in an attractive cover tied with a neat bow-knot (…). The data must be simple enough to be sent by telegraph and compiled overnight” (Mitchell, 1919) 103
The mystique of ranking GERD is used for target setting - from descriptive to prescriptive “The American GERD/GDP ratio of the early 1960 s, that is 3%, as mentioned in the first paragraphs of the first edition of the Frascati Manual, became the ideal to which member countries would aim, and which the OECD would implicitly promote” (Godin) Lisbona UE 3% (2% business, 1% public sector) 104
Keith Pavitt “One would think that the political agenda determines the collection and analysis of indicators. In reality it is the other way round: it is the availability of indicators which steers the political discourse. ” 105
Fred Gault “Policy analysts should be both literate and numerate, able to put a case using innovation indicators. Not only should the analysits have such a skill set, but they also require some knowledge of the subject. It is in this environment that monitoring, benchmarking and evaluation lead to policy learning and to more effective policies. ” 106
The policy advisor Advising has become the preserve of applied economists (no more physicists and sociologists) Advisors need to be – and to appear – experts who guarantee a competent and independent approach The compromise between engagement and integrity of analysts Frustration of advisors is part of the game The paradox: too many or too little indicators? The pressure of vested interests on official statisticians 107
Research Evaluation of what: research education “third mission” of universities and research agencies (consultancy, support to local authorities, etc. ) Evaluation by whom: experts, peers Evaluation of what: organisations (departments, universities, schools) programmes, projects individuals (professors, researchers, students) Evaluation when ex-ante in-itinere ex-post 108
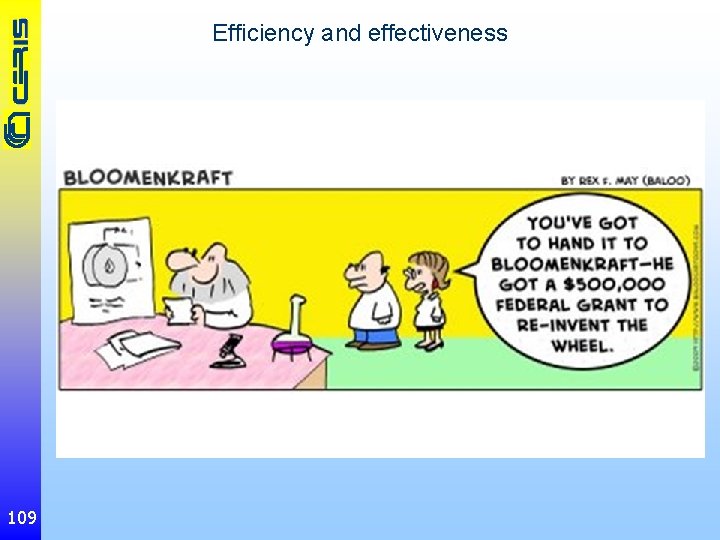
Efficiency and effectiveness 109
Research Evaluation Indicators used - bibliometrics - R&D - peer review - students - graduates - patents - spin-offs - contracts and other funding - other 110
Evaluation in Italy New public management Accountability Value for money National Institute for the Evaluation of the Education and Training System 111
San Francisco Declaration on Research Assessment The Journal Impact Factor, as calculated by Thomson Reuters, was originally created as a tool to help librarians identify journals to purchase, not as a measure of the scientific quality of research in an article. With that in mind, it is critical to understand that the Journal Impact Factor has a number of well-documented deficiencies as a tool for research assessment. These limitations include: A) citation distributions within journals are highly skewed; B) the properties of the Journal Impact Factor are field-specific: it is a composite of multiple, highly diverse article types, including primary research papers and reviews; C) Journal Impact Factors can be manipulated (or “gamed”) by editorial policy; and D) data used to calculate the Journal Impact Factors are neither transparent nor openly available to the public. 112
San Francisco Declaration on Research Assessment General Recommendation Do not use journal-based metrics, such as Journal Impact Factors, as a surrogate measure of the quality of individual research articles, to assess an individual scientist’s contributions, or in hiring, promotion, or funding decisions. 113
Editorial in Research Policy by Ben Martin Over recent years, Journal Impact factor (JIF) has become the most prominent indicator of a journal's standing, bringing intense pressure on journal editors to do what they can to increase it. Which are the approaches employed by journal editors to maximise it? Some approaches would seem completely acceptable, others are in clear breach of the conventions on academic behavior, but a number fall somewhere in between. Over time, editors have devised ingenious ways of enhancing their JIF without apparently breaching any rules. The editorial draws three conclusions. First, in the light of ever more devious ruses of editors, the JIF indicator has now lost most of its credibility. Secondly, where the rules are unclear or absent, the only way of determining whether particular editorial behavior is appropriate or not is to expose it to public scrutiny. Thirdly, editors who engage in dubious behavior thereby risk forfeiting their authority to police misconduct among authors. 114
The Leiden Manifesto for research metrics Bibliometrics: The Leiden Manifesto for research metrics “Data are increasingly used to govern science. Research evaluations that were once bespoke and performed by peers are now routine and reliant on metrics. The problem is that evaluation is now led by the data rather than by judgement. Metrics have proliferated: usually well intentioned, not always well informed, often ill applied. We risk damaging the system with the very tools designed to improve it, as evaluation is increasingly implemented by organizations without knowledge of, or advice on, good practice and interpretation. ” 11511 115
Lessons from research evaluation Evaluation should enhance efficiency and effectiveness Evaluation is a difficult process Peer review vs bibliometrics NSE vs SSH Used to define financing and hiring/promoting staff League tables Pro-active evaluation vs punitive evaluation Competition vs cooperation of scientists Excellence Opportunistic behaviour and the split of the academic community Threat t othe equilibrium amongst the activities of the university Research Assessment Excercise (REF) in the UK
Concluding remarks After 60 years STI indicators are quite good International cooperation is key (the role of the OECD and EU) Further develop theoretical models and methodologies From macro to micro Keep the dialogue between actors alive More expertise: too many economists (philosophers, sociologists, other social scientists) Too many indicators? Resource constraints STI indicators are a public good, and the “owner” of statistics is the State The role of commercial data producers (e. g. bibliometrics) What to do with the misuse of indicators? 117

Thank you for your attention giorgio. sirilli@cnr. it
- Slides: 118