Camilla Andersson Helene Alpfjord Lennart Robertson and Magnuz

Camilla Andersson, Helene Alpfjord, Lennart Robertson and Magnuz Engardt SMHI, Sweden Near-surface ozone reanalysis during 1990 -2013 in Sweden - explaining the trend

The Project Swedish EPA § The science: § To create a state-of-the-art long-term hourly ozone reanalysis (2 dvar) § To understand the causes of the change over time, focusing on the § contributions of trends in emission change, lateral and top boundary and climate variability To evaluate the performance of the ozone mapping in the MATCH-Sweden system § Restrictions: § Focus on Sweden (+ Norway) § Time-consistency § Comparability to the annual mapping of the state of the environment (MATCH-Sweden system)
 Swedish emissions – SMED (1")
Time-consistent model data European emissions - EMEP (50 km) Swedish emissions – SMED (1 km) European meteorology – EURO 4 M Meteorological reanalysis with HIRLAM 1979 - feb 2014 (22 km) Modelled hourly surface ozone covering Europe MATCH model 1990 -2013 (22 km) Lateral and top boundary

Contribution to trends - model scenarios § Change in climate (including § on-line modelled isoprene emissions) Change in anthopogenic emissions which is separated between § non-Swedish European § anthropogenic emissions Swedish anthropogenic emissions § Change in lateral and top boundaries Scenario Description m 8 Base scenario, used as input to the reanalysis. m 10 The meteorology is set to the level of 2011. M 9 Constant European anthropogenic emissions set to the level of 2011. m 14 Constant Swedish anthropogenic emissions set to the level of 2011. m 6 Constant top and lateral boundaries for all species set to the level of 2011.
 • • •")
Combining measurements and model using 2 -dim. variational analysis (2 dvar) • • • Background field (model) Full spatial and temporal coverage Larger error than the observation (assumed) Biases especially large in the extreme values Analysed surface ozone concentration • Observations • • • Smaller error than the background field Lacking temporal and spatial resolution Local effects/erroneous data By combining the two we can achieve a dataset with spatial and temporal coverage of higher quality than the original background fields
 - At least 80% data coverage")
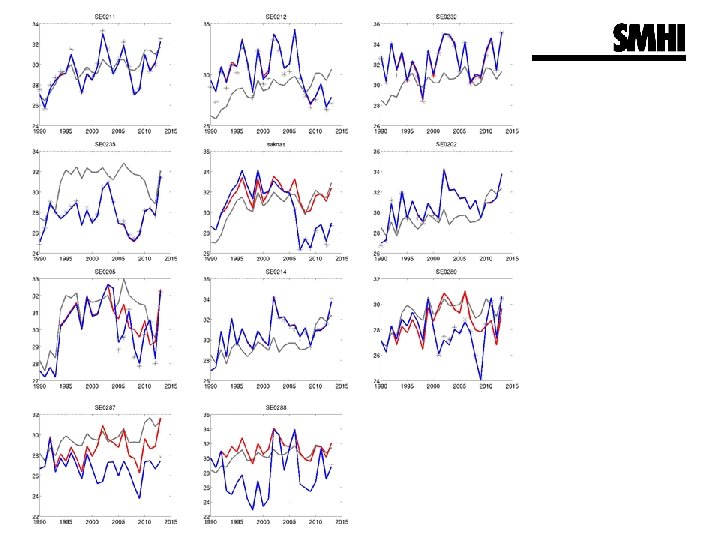
Time-consistent measurement data Measurements 10 included locations (red) - At least 80% data coverage - A valid exchange of measurement site

Time-consistent input data

Evaluation of first guess and Independent cross validation § Annual values of the final reanalysed O 3 were compared to § (dependent) observations showing improvement compared to the modelled results An independent cross validation of hourly ozone during 2013 showed an improvement at sites not included in the variational analysis.

Southern Sweden Decreasing max percentiles Increasing min and mediate percentiles

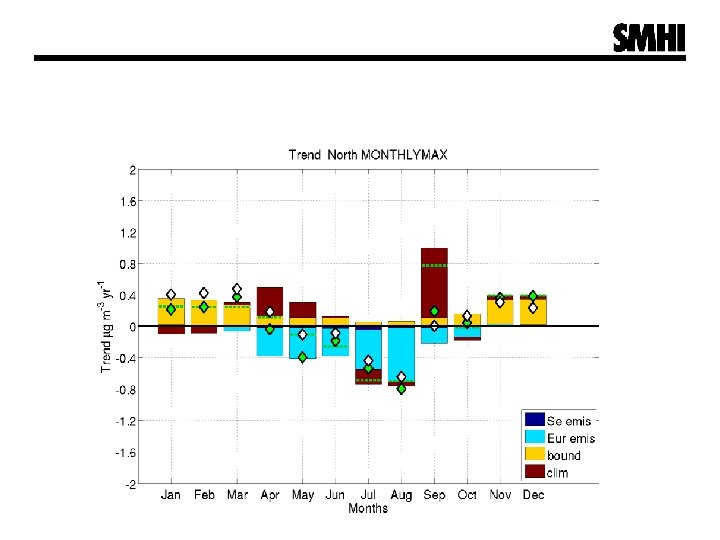
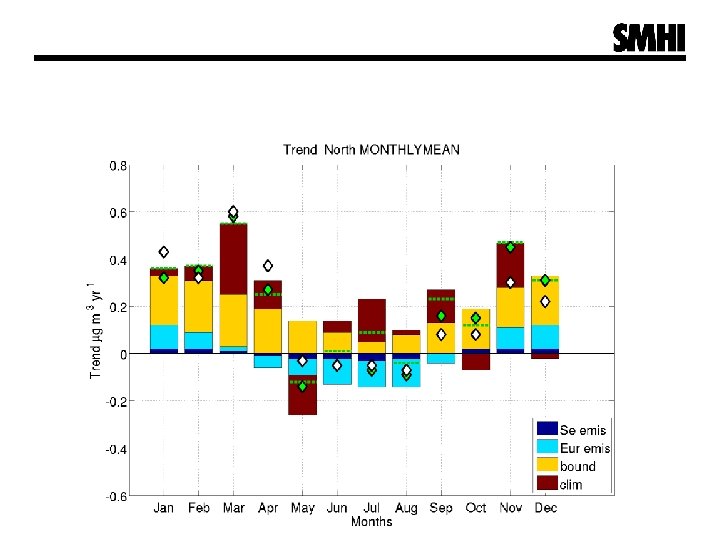
Contributions to the trend

1990 -2013 reanalysis Monthly mean higher in the North in winter, in the South in summer Winter- and spring-time means are increasing Monthly max higher in the South except in winter Summer-time max are decreasing

Contributions to the change

Contributions to the change

Conclusions and discussion § We have created a state-of-the art long-term hourly reanalysis of surface O 3 covering the geographical areas of Sweden and Norway for 1990 -2013 § We have evaluated the performance of this ozone mapping, showing improved performance compared to the original MATCH model (“first guess”) The trend in near-surface ozone § High concentrations of near-surface ozone are decreasing and low concentrations are increasing. § Rising hemispheric background concentrations have generally contributed to increasing surface concentrations in Sweden – during all seasons and in all percentiles. § Changing emissions in Europe has led to increasing low concentrations (e. g. during winter-time) and decreasing concentrations during summertime. § Climate variability during the period 1990 -2013 appears to have mainly increased ozone concentrations in Sweden.

Thank you! § To the Swedish EPA for funding this work § To Per Erik Karlsson (IVL) and Sverre Solberg (NILU) § To you for listening Contact: camilla. andersson@smhi. se

Northern Sweden Decreasing max percentile Significant increasing min and medium percentiles Hemispheric background?

Results – ozone reanalysis 1990 -2013 MEAN ANNUAL MAX 1 h 1990 -2013 MAX
- Slides: 20