CALIFORNIA DASHBOARD 2018 2019 MET Not MET For

CALIFORNIA DASHBOARD 2018 -2019

MET Not MET For 2 or more years

What’s New This Year? ● New Look and Feel ○ ○ ○ ● ● More Parent Friendly Scorecards and Performance Levels Organized into 3 Priority Areas: ○ ○ ○ Academic Performance Academic Engagement Conditions & Climate Participation Rate Included in Calculations English Learner Progress Indicator - Transition Year Chronic Absenteeism Indicator - First Time Reporting This Indicator 3 x 5 Methodology - LEA, School, Subgroups (less than 150 enrolled students) ○ ○ Chronic Absenteeism Suspension Rate ● Differentiated Support - Local and State Indicators Included ● ESSA State Plan to Identify Schools For Support

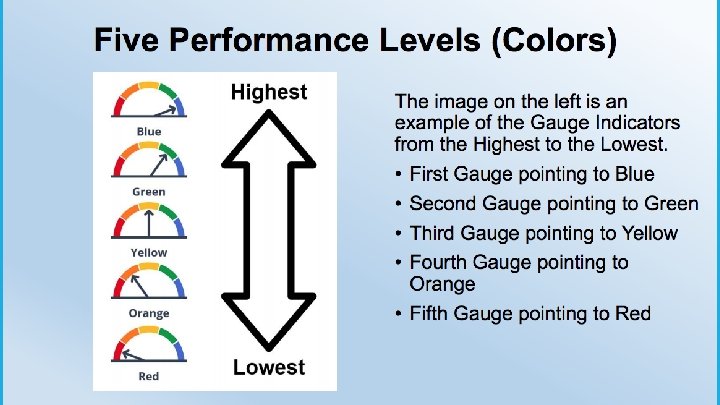
UNDERSTANDING THE STATE INDICATORS Status & Change, Colors Dials, Equity Reports

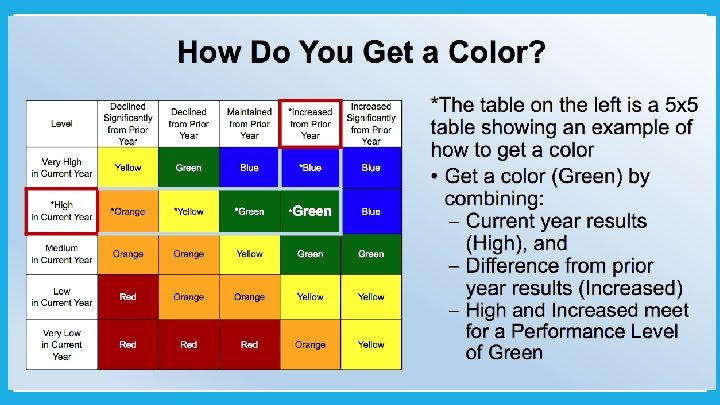
Status & Change - How it’s derived and who is counted. . . ● Status ○ ○ ○ All valid scores 2 years within the LEA Very High, Medium, Low, Very Low ○ ○ Difference between past two years Increased Significantly, Increased, Maintained, Declined Significantly ○ ○ 5 x 5 Grid - where status level and change level intersect 3 x 5 Grid - formerly ‘Safety Net’; mitigates drastic swings in small populations (less than 150) ● Change ● Color Indicators ■ Suspension Rate and Chronic Absenteeism only

View of Dashboard

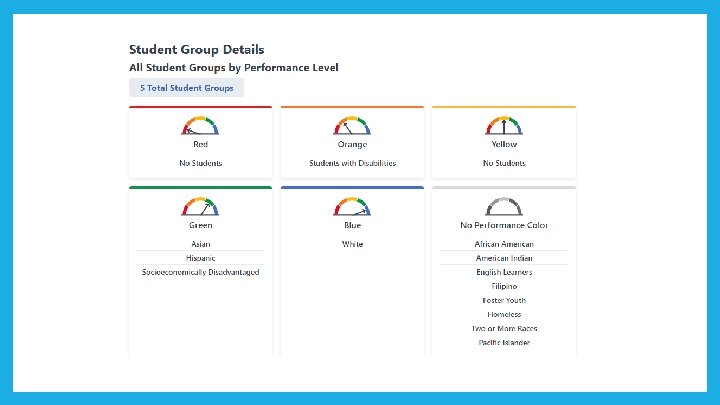
Student Population

ACADEMICS & ENGLISH LEARNER PROGRESS Priority 4

Academic Indicators • State and Local • Deeper look one click away “View More Details”

ENGLISH LANGUAGE ARTS MATHEMATICS

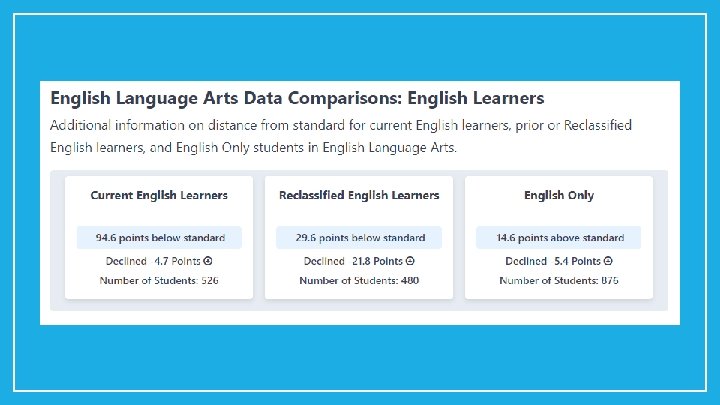
English Language Arts

English Language Arts

English Language Arts California Alternate Assessment Results for ELA and Mathematics

State Comparison: English Language Arts District Students California Students

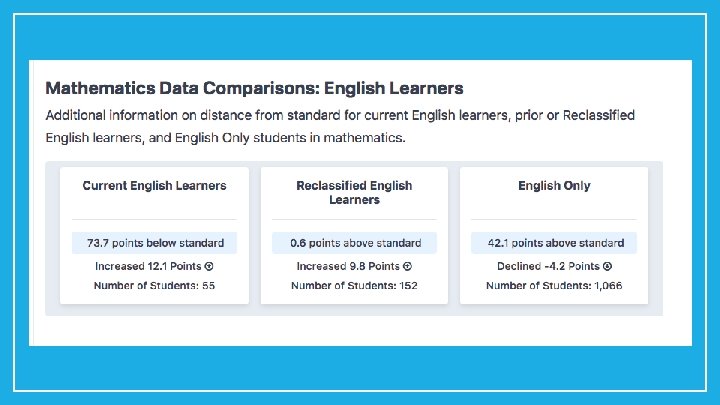
Mathematics

Mathematics

State Comparison: Mathematics District Students California Students

COLLEGE/CAREER Priority 5

How is this calculated? • Based on the number of students in a high school graduation cohort who are prepared for college or a career. • College/career readiness means completing rigorous coursework, passing challenging exams or receiving a state seal. The following measures are used to indicate readiness: • • Career Technical Education Pathway Completion Grade 11 Smarter Balanced Summative Assessment – ELA & Math Advanced Placement Exams International Baccalaureate Exams College Credit Course A-g Completion State Seal of Biliteracy Military Science/Leadership

CHRONIC ABSENTEEISM Priority 5

Who is counted? Numerator - number of students absent for 10% or more days of their enrollment Denominator - number of students enrolled for 31 days and attended at least 1 day

Chronic Absenteesim The percentage of students in Kindergarten through grade 8 who are absent 10 percent more of the instructional days they were enrolled

Chronic Absenteeism

Chronic Absenteeism: Comparison with State District California

SUSPENSION RATE Priority 6

How is this calculated? ● Unduplicated pupil count ○ Same student suspended more than once in the same school counts as 1 suspension ○ Same student suspended more than once in two different schools in same district counts once for each school, but only once for the district ● In-School and Out-of-School suspensions counted
")
Suspension Indicator (District Level)

Suspensions

Suspension Rate: State Comparison District California

GRADUATION RATE

Year to year comparison

How is this calculated? Students completing high school ● Receiving a standard high school diploma ● Complete graduation requirements at an alternative school

QUESTIONS? https: //www. caschooldashboard. org/
- Slides: 38