
Calibration Drift Among Regression and Machine Learning Models
Calibration Drift Among Regression and Machine Learning Models for Hospital Mortality S 117: Acute Setting Predictive Analytics Sharon E. Davis, MS Ph. D Candidate Department of Biomedical Informatics Vanderbilt University

Disclosure I and my spouse have no relevant relationships with commercial interests to disclose. AMIA 2017 | amia. org 2
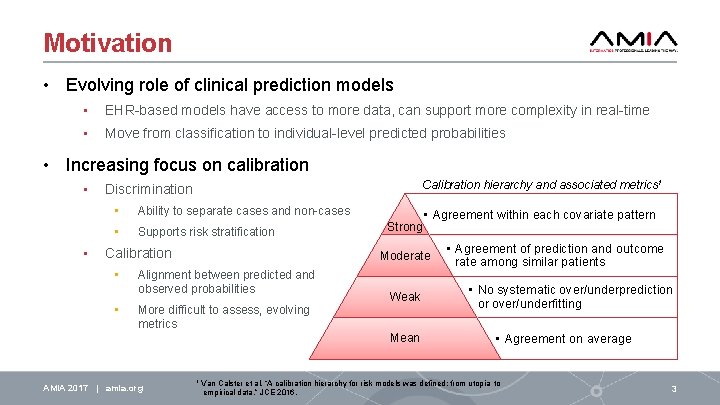
Motivation • Evolving role of clinical prediction models • EHR-based models have access to more data, can support more complexity in real-time • Move from classification to individual-level predicted probabilities • Increasing focus on calibration • • Calibration hierarchy and associated metrics 1 Discrimination Ability to separate cases and non-cases Supports risk stratification Calibration • • Strong Moderate Alignment between predicted and observed probabilities More difficult to assess, evolving metrics Weak Mean AMIA 2017 | amia. org • Agreement within each covariate pattern 1 • Agreement of prediction and outcome rate among similar patients • No systematic over/underprediction or over/underfitting • Agreement on average Van Calster et al. “A calibration hierarchy for risk models was defined: from utopia to empirical data. ” JCE 2016. 3
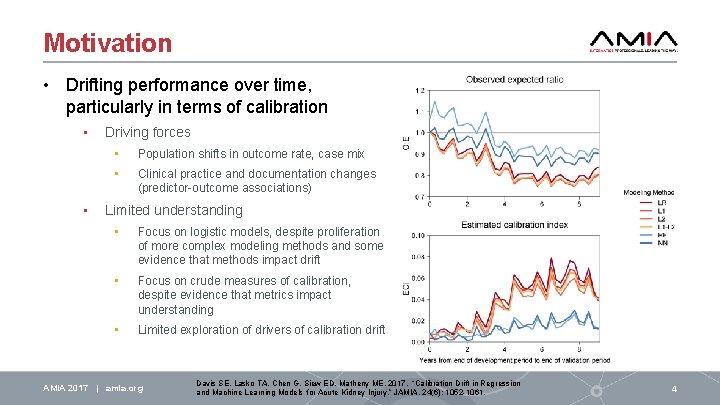
Motivation • Drifting performance over time, particularly in terms of calibration • • Driving forces • Population shifts in outcome rate, case mix • Clinical practice and documentation changes (predictor-outcome associations) Limited understanding • Focus on logistic models, despite proliferation of more complex modeling methods and some evidence that methods impact drift • Focus on crude measures of calibration, despite evidence that metrics impact understanding • Limited exploration of drivers of calibration drift AMIA 2017 | amia. org Davis SE, Lasko TA, Chen G, Siew ED, Matheny ME. 2017. “Calibration Drift in Regression and Machine Learning Models for Acute Kidney Injury. ” JAMIA. 24(6): 1052 -1061. 4
Objectives 1. Compare performance over time of prediction models developed using common frequentist statistical methods and machine learning techniques a. Expanded set of modeling methods b. Calibration measured at multiple levels of stringency 2. Link shifts in patient populations with model performance to identify drivers of calibration drift across models a. Event rate shift b. Case mix shift c. Predictor-outcome association shift AMIA 2017 | amia. org 5
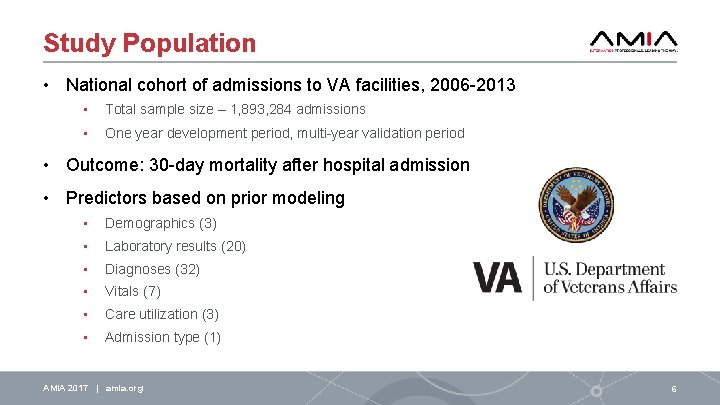
Study Population • National cohort of admissions to VA facilities, 2006 -2013 • Total sample size – 1, 893, 284 admissions • One year development period, multi-year validation period • Outcome: 30 -day mortality after hospital admission • Predictors based on prior modeling • Demographics (3) • Laboratory results (20) • Diagnoses (32) • Vitals (7) • Care utilization (3) • Admission type (1) AMIA 2017 | amia. org 6
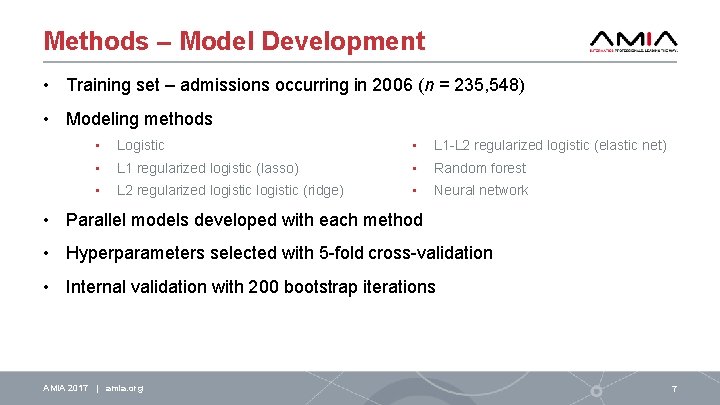
Methods – Model Development • Training set – admissions occurring in 2006 (n = 235, 548) • Modeling methods • Logistic • L 1 -L 2 regularized logistic (elastic net) • L 1 regularized logistic (lasso) • Random forest • L 2 regularized logistic (ridge) • Neural network • Parallel models developed with each method • Hyperparameters selected with 5 -fold cross-validation • Internal validation with 200 bootstrap iterations AMIA 2017 | amia. org 7
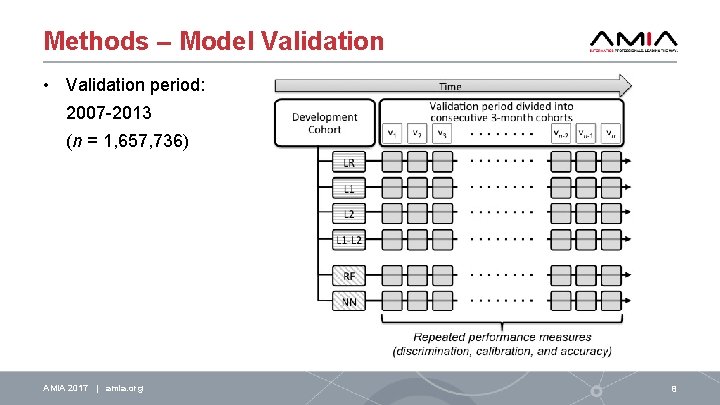
Methods – Model Validation • Validation period: 2007 -2013 (n = 1, 657, 736) AMIA 2017 | amia. org 8
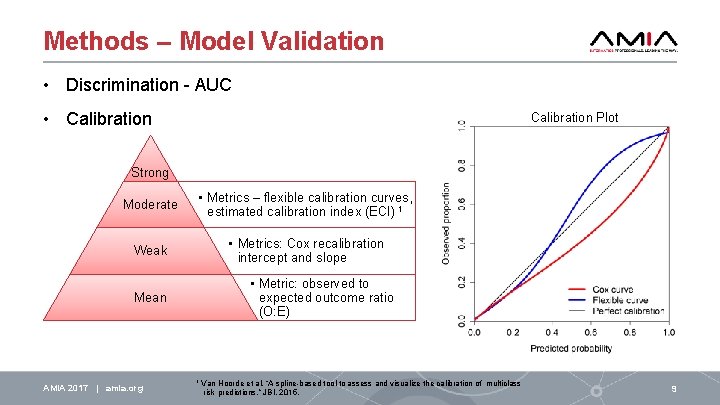
Methods – Model Validation • Discrimination - AUC • Calibration Plot Strong Moderate • Metrics – flexible calibration curves, estimated calibration index (ECI) 1 Weak • Metrics: Cox recalibration intercept and slope • Metric: observed to expected outcome ratio (O: E) Mean AMIA 2017 | amia. org 1 Van Hoorde et al. “A spline-based tool to assess and visualize the calibration of multiclass risk predictions. ” JBI. 2015. 9
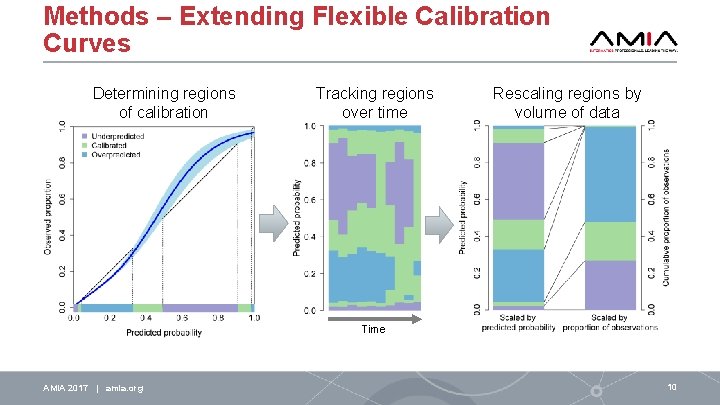
Methods – Extending Flexible Calibration Curves Determining regions of calibration Tracking regions over time Rescaling regions by volume of data Time AMIA 2017 | amia. org 10
Methods – Population Data Shifts • Event rate shift • Definition: Changes in the prevalence of the outcome • Assessment: Distribution of mortality rate over time • Case mix shift • Definition: Changes in the distribution of risk factors in the population • Assessment: • Distributions of predictors over time • Discrimination and model structure of membership models 1 • Predictor-outcome association shifts • Definition: Changes in form or magnitude of relationships between risk factors and the outcome • Assessment: Changes in the structure of models refit in each 3 -month period AMIA 2017 | amia. org 1 Debray et al. “A new framework to enhance the interpretation of external validation studies of clinical prediction models. ” JCE 2015. . 11
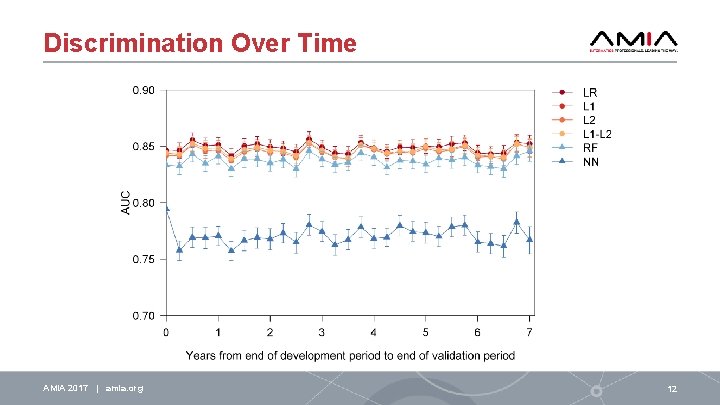
Discrimination Over Time AMIA 2017 | amia. org 12
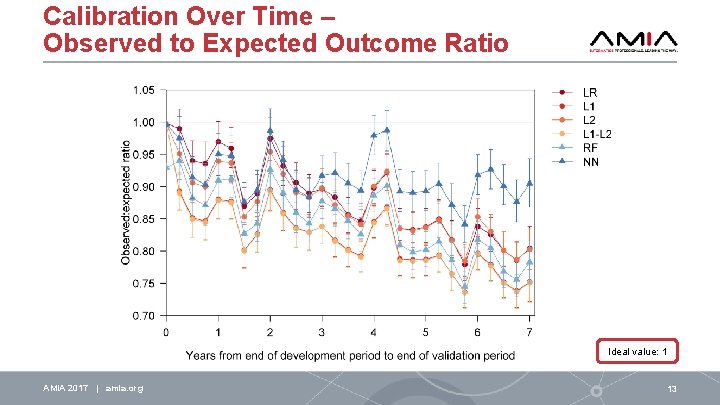
Calibration Over Time – Observed to Expected Outcome Ratio Ideal value: 1 AMIA 2017 | amia. org 13
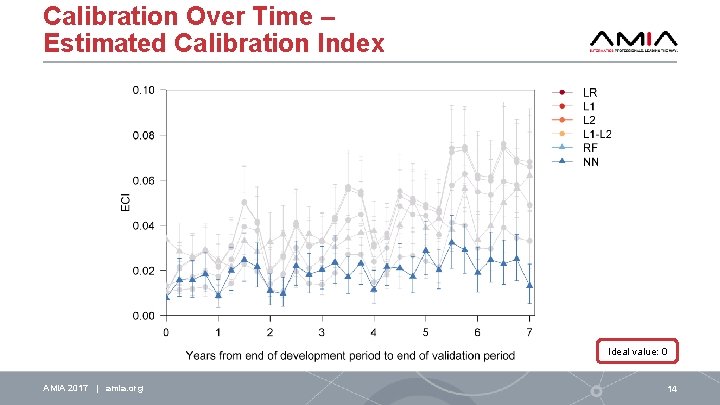
Calibration Over Time – Estimated Calibration Index Ideal value: 0 AMIA 2017 | amia. org 14
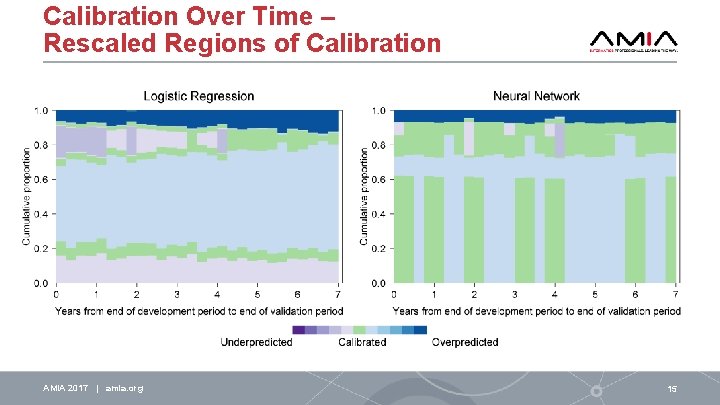
Calibration Over Time – Rescaled Regions of Calibration AMIA 2017 | amia. org 15
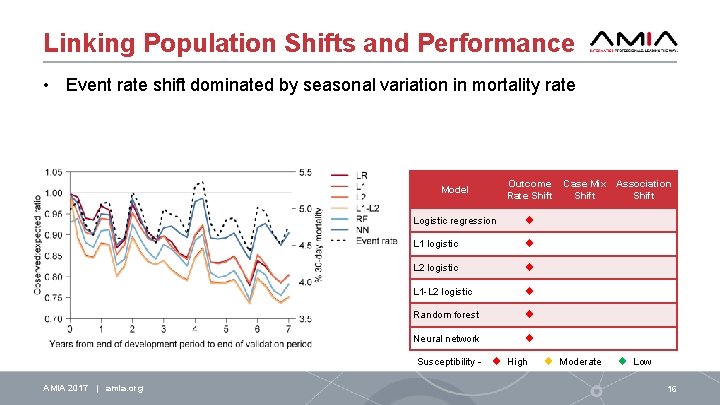
Linking Population Shifts and Performance • Event rate shift dominated by seasonal variation in mortality rate Model Outcome Rate Shift Logistic regression u L 1 logistic u L 2 logistic u L 1 -L 2 logistic u Random forest u Neural network u Susceptibility – AMIA 2017 | amia. org u High Case Mix Association Shift u Moderate u Low 16
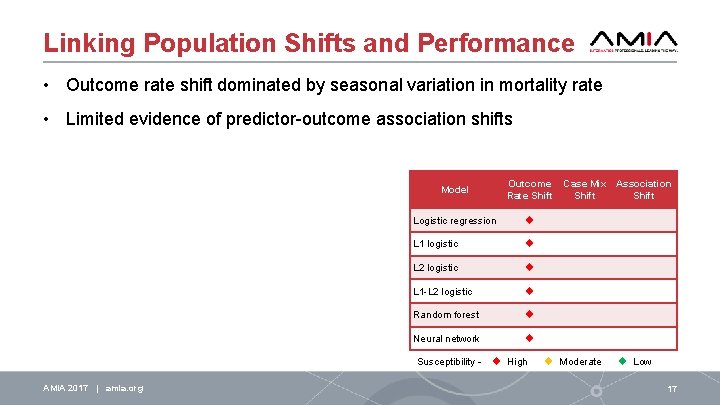
Linking Population Shifts and Performance • Outcome rate shift dominated by seasonal variation in mortality rate • Limited evidence of predictor-outcome association shifts Model Outcome Rate Shift Logistic regression u L 1 logistic u L 2 logistic u L 1 -L 2 logistic u Random forest u Neural network u Susceptibility – AMIA 2017 | amia. org u High Case Mix Association Shift u Moderate u Low 17
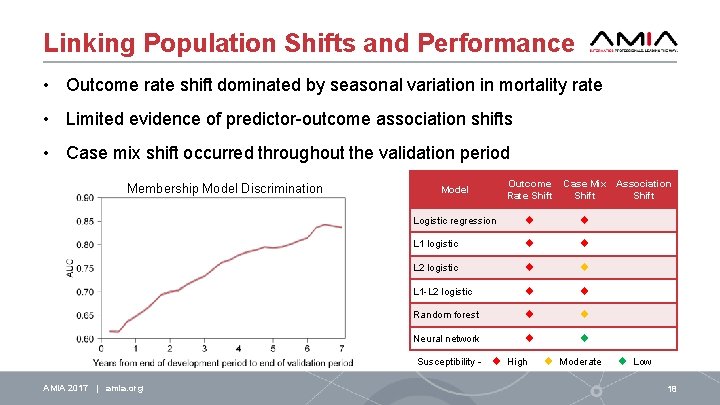
Linking Population Shifts and Performance • Outcome rate shift dominated by seasonal variation in mortality rate • Limited evidence of predictor-outcome association shifts • Case mix shift occurred throughout the validation period Membership Model Discrimination Model Outcome Rate Shift Logistic regression u u L 1 logistic u u L 2 logistic u u L 1 -L 2 logistic u u Random forest u u Neural network u u Susceptibility – AMIA 2017 | amia. org u High Case Mix Association Shift u Moderate u Low 18
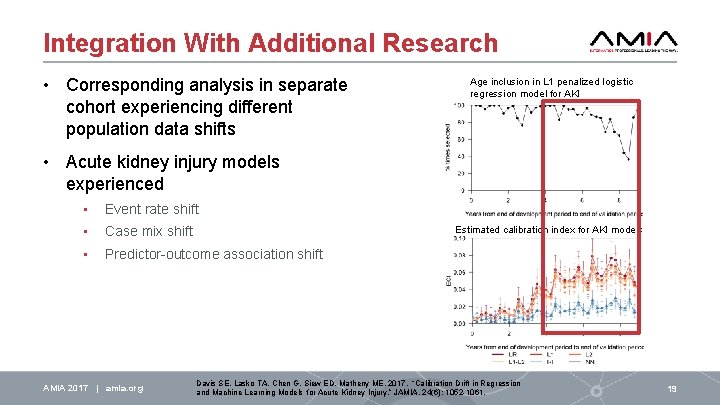
Integration With Additional Research • Corresponding analysis in separate cohort experiencing different population data shifts Age inclusion in L 1 penalized logistic regression model for AKI • Acute kidney injury models experienced • Event rate shift • Case mix shift • Predictor-outcome association shift AMIA 2017 | amia. org Estimated calibration index for AKI models Davis SE, Lasko TA, Chen G, Siew ED, Matheny ME. 2017. “Calibration Drift in Regression and Machine Learning Models for Acute Kidney Injury. ” JAMIA. 24(6): 1052 -1061. 19
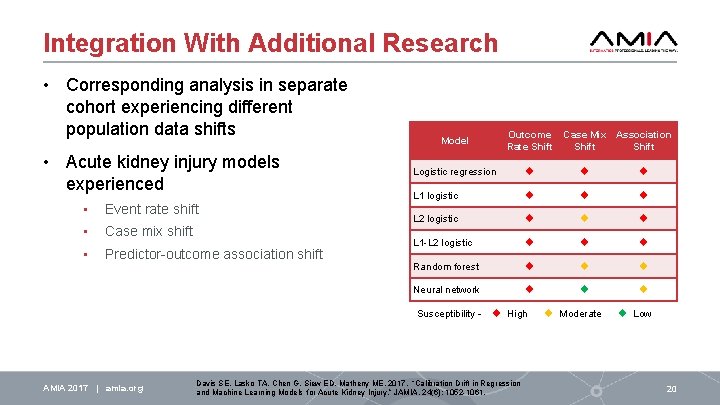
Integration With Additional Research • Corresponding analysis in separate cohort experiencing different population data shifts • Acute kidney injury models experienced • Event rate shift • Case mix shift • Predictor-outcome association shift Model Outcome Rate Shift Logistic regression u u u L 1 logistic u u u L 2 logistic u u u L 1 -L 2 logistic u u u Random forest u u u Neural network u u u Susceptibility – AMIA 2017 | amia. org u High Davis SE, Lasko TA, Chen G, Siew ED, Matheny ME. 2017. “Calibration Drift in Regression and Machine Learning Models for Acute Kidney Injury. ” JAMIA. 24(6): 1052 -1061. Case Mix Association Shift u Moderate u Low 20
Limitations • Statistical versus clinically meaningful miscalibration • Additional modeling methods remain to be considered • Limited population data shift scenarios explored • Variable magnitudes of population data shifts • Variable combinations of event rate, case mix, association shifts AMIA 2017 | amia. org 21
Conclusions • Calibration drift varies by modeling method and form of underlying population shifts • Selection of calibration metrics impacts understanding of drift across methods • Model updating strategies will need to be tailored to the unique vulnerabilities of modeling methods AMIA 2017 | amia. org 22

Funding Agencies Research Team • Michael Matheny, MD, MS, MPH • • VA HSR&D IIR 11 -292 VA HSR&D IIR 13 -052 • • NLM 5 T 15 LM 007450 NLM 1 R 21 LM 011664 -01 AMIA 2017 | amia. org • Guanhua Chen, Ph. D • Thomas Lasko, MD, Ph. D Department of Biomedical Informatics 23

Thank you! Email: sharon. e. davis@vanderbilt. edu Department of Biomedical Informatics
- Slides: 24