Calibration algorithm and detector monitoring TPC Marian Ivanov

Calibration algorithm and detector monitoring - TPC Marian Ivanov

Outlook ● ● TPC calibration algorithm in HLT TPC QA

TPC calibration algorithm ● ● TPC calibration components based on the Raw data successfully integrated and used in the HLT framework (Pedestal, Pulser and Laser calibration) – Possibility to use the same – tested code in OFFLINE, DAQ and HLT – Input data - Interface – raw data - Ali. Raw. Reader New TPC calibration components using tracks – Cluster error, shape fitting – Drift velocity monitoring, alignment – Gain calibration – Input data – Interface - Ali. TPCseed – array of clusters space points

Track based calibration components Ali. TPCcalib. Tracks ● ● ● Cluster error and shape parametrization Raw cluster charge spectra Ali. TPCcalib. Tracks. Gain ● ● Internal gain alignment Charge Angular correction calibration Sector gain equalization Ali. TPCcalib. Align + Ali. TPCcalib. Alignment (Optional argument CE plane) ● ● Sector alignment + QA histograms Status: ● ● ● Offline - developed on MC – partially used (when enough statistic) on real cosmic data HLT – to be interfaced
: ● Loops over all clusters of")
Ali. TPCcalib. Tracks analysis Fill. Resolution. Histo. Local(seed): ● Loops over all clusters of a given track ● For each cluster in a track a small tracklet is chosen (current cluster ± 10 rows) ● This tracklet is fitted in Y and Z direction with two lines to determine the curvature (to ignore clusters on kinks) 29 August 2007 5
: ● The tracklet is also fitted")
Ali. TPCcalib. Tracks analysis Fill. Resolution. Histo. Local(seed): ● The tracklet is also fitted with a polynomial 2 nd order in Y and Z direction ►The difference between cluster and polynomial is stored as delta (σ) in one of the resolution histograms ►Results of this analysis will be shown later on 29 August 2007 6
 function is available to merge Ali.")
Ali. TPCcalib. Tracks ● Merge(. . . ) function is available to merge Ali. TPCcalib. Tracks objects from different PROOF-slaves ►Necessary if the selector runs on PROOF to merge the objects coming from different PROOF-slaves ►All the contained histograms are merged via their Merge(. . . ) functions 29 August 2007 7
 Analyze() Component encapsulate data –")
Components ● Base Functionality: – – ● Process(data ) Analyze() Component encapsulate data – Histograms, graphs, parameterization – Getters in the component
 QA consist from two parts Raw data monitoring e.")
TPC QA The TPC (online) QA consist from two parts Raw data monitoring e. g. Amplitude spectra (1 D, Profiles) ->require noise map + primitive calibration Time dependence of mean Amplitude Monitoring of calibration parameters Check the detector behaviour Check the calibration algorithm itself The output of the calibration algorithm to be used in reconstruction, desirable no calibration reiteration needed

Quality assurance ● Process: ● Detect the problems - Define, what is the problem ● What do we expect? ● ● Until which point the detector the information form the detector is reasonable? ● ● How far we are from the expectation? – Define the limits of working conditions ● Modify expectation TPC Strategy – Enable Expert mode of the QA just from the beginning. ● ● Defined in the TDR and in the PPR on the basis of simulation Default histograms – views – configurable - generated by expert monitor More details about TPC QA https: //alisoft. cern. ch/Ali. Root/trunk/TPC/doc/calibration. TPC. pdf

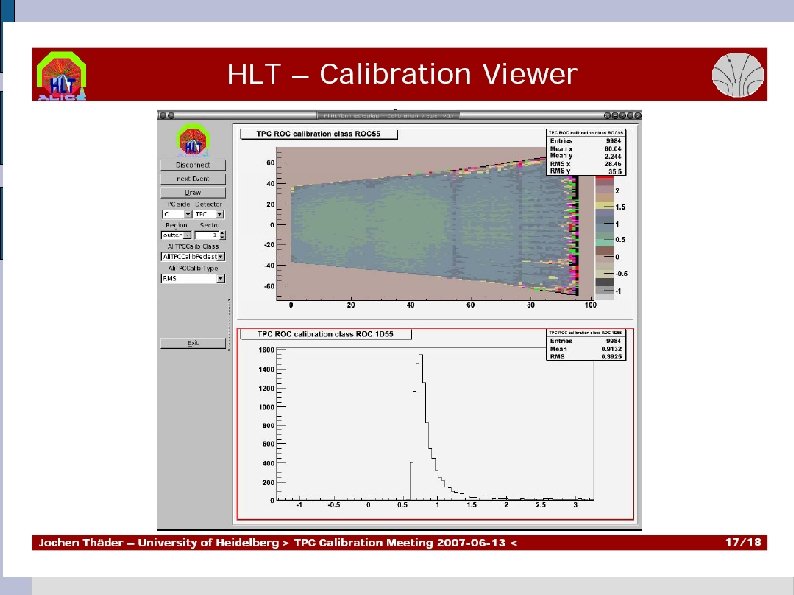
RAW data QA: Cosmic data from December run � Output can be viewed (and manipulated!) in TPC calibration browser online

Qmax with cuts on mean time bins

Q and Qmax plots with cuts
 ● Data quality monitoring based on statistical properties of data -")
Quality assurance (DA) ● Data quality monitoring based on statistical properties of data - Extracting in calibration procedure ● ● ● Low level – digit level: ● Noise and pedestal calibration ● Electronic gain calibration ● Time 0 calibration ● Laser calibration Direct answer ● Number of dead channels ● Percentage of suspicious channels Alarms:

Pulser Q measurement 31. 01. 2008

GUI in detail 22

GUI demonstration – Comparison with refernce data 23

Statistic – cumulative function 24

Monitoring using tracks 25

Cluster position resolution as function of inclination angle ● Left – MC data ● Right – TPC test 2007 data ●

Cluster position resolution as function of drift length ● Left – MC data ● Right – TPC test 2007 data ●

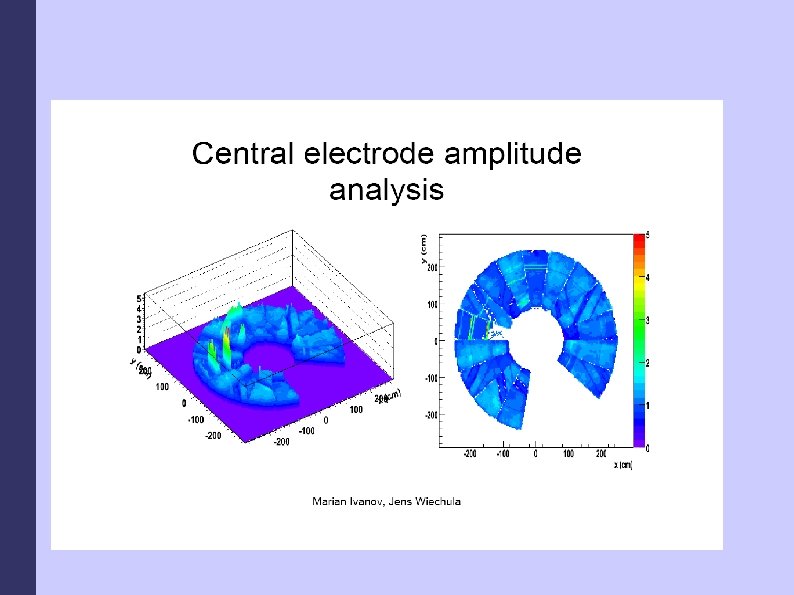
Alignment - Example

Alignment - Example
- Slides: 29