Calculating Sewer and Water Rates An EasytoUnderstand Guide


- Slides: 10

Calculating Sewer and Water Rates An Easy-to-Understand Guide for Southbridge, MA Residents Robert Reed Interim Town Manager

Simple Formula q Formula determined by a rate structure study, based on sound research FIXED COST + VARIABLE COST TOTAL COST

What is a fixed cost? q Debt Service q Capital q Indirect Improvements Costs ◦ Billing and administration of accounts since the services are contracted out ◦ No in-house infrastructure=another town department must perform duties q Contracts ◦ Any prior contracted amount with these companies must be honored

What is a variable cost? q Any cost that is subject to change o Utilities o Treatment Chemicals and Supplies q Consumption Rate o o o Overall consumption impacts rate Budget /Consumption Greater the consumption moderates the rate Lesser the consumption greater the rate Individual households use different amounts of water/sewer services

Current Rate Changes q q Rate changes are based on the changes in consumption and increases in costs Fixed Costs that have increased o Contracted increases with service providers o State mandates/increased regulations that cost extra money o Debt payments on facilities or capital improvements

Consumption and Revenue Fiscal Year 2014 (7 -1 -2013 to 6 -30 -2014) Water Consumption YTD Billed Revenue -2. 4% +1. 07% Sewer Consumption YTD Billed Revenue -. 03% +3. 86% * Comparison of Fiscal Years 2014 to 2013 through 4 quarters

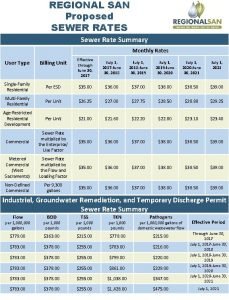
Bottom Line Water Rates +3% Sewer Rates +15% Combined Change With Both Services +9%

Southbridge Median Single Family Utility Usage per Quarter Median single family consumption amount in cubic feet with a 5/8 meter Current Water Charge Current Sewer Charge Total Charge if Both With New Rates Water Charge Sewer Charge Total Charge if Both Combined Change if Both Increase per Quarter Increase per Month Increase per Day 1, 400 CF per Quarter $109. 99 $100. 06 $210. 05 +3% +15% per Month $113. 29 $115. 07 $228. 36 $18. 31 $6. 10 $0. 20 Source: Wil Cournoyer, Chairman, Southbridge Board of Assessors (05/15/2014) $36. 66 $33. 35 $70. 01 $37. 76 $38. 36 $76. 12

2015 Budget 2015 Water Budget Change Capital Budget Operations Debt Indirect Costs ($11, 500) $24, 709 $16, 602 $10, 968 $40, 779

2015 Budget 2015 Sewer Budget Change------- $407, 492 Capital Budget Operations Debt Indirect Costs $100, 000 $91, 820 $204, 833 $10, 839
