Calculating and Interpreting Standard Deviation Objectives To calculate

Calculating and Interpreting Standard Deviation

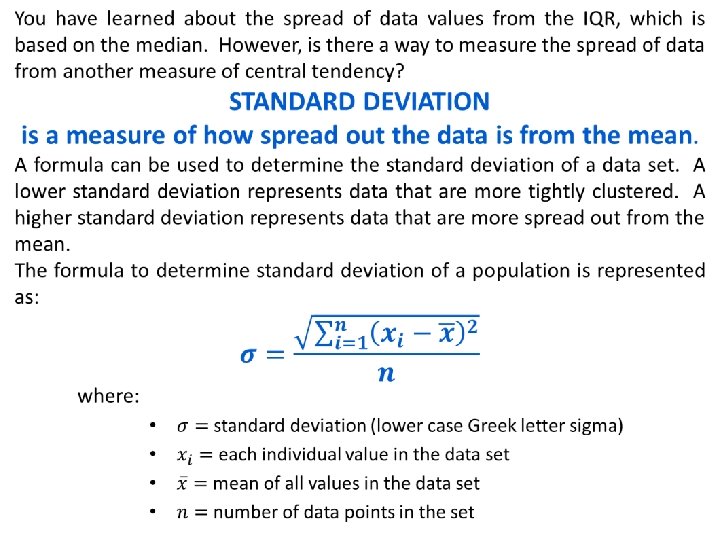
Objectives: • To calculate and interpret the standard deviation of a data set • To compare the standard deviation of data sets

Warm-up: Complete Problem 1, Questions 1 – 5, on pages 490 – 491. Use http: //www. shodor. org/interactivate/activities/Box. Plot/ followed by http: //www. imathas. com/stattools/boxplot. html to construct the box-and-whisker plots. 1. Determine the mean and median for each student’s spelling bee scores. Jack: Mean = 50 Median = 49. 5 Aleah: Mean = 50 Median = 50 Tymar: Mean = 50 Median = 50 2. What conclusions can you draw about the data from the mean and median scores?

3. Construct box-and-whisker plots of each student’s spelling bee scores using the same number line. 4. Interpret the test scores of each student. 5. Do you think these three students performed about the same on all the tests? Why or why not?

c. Complete the table to represent each part of the formula. The data values have been put in ascending order.

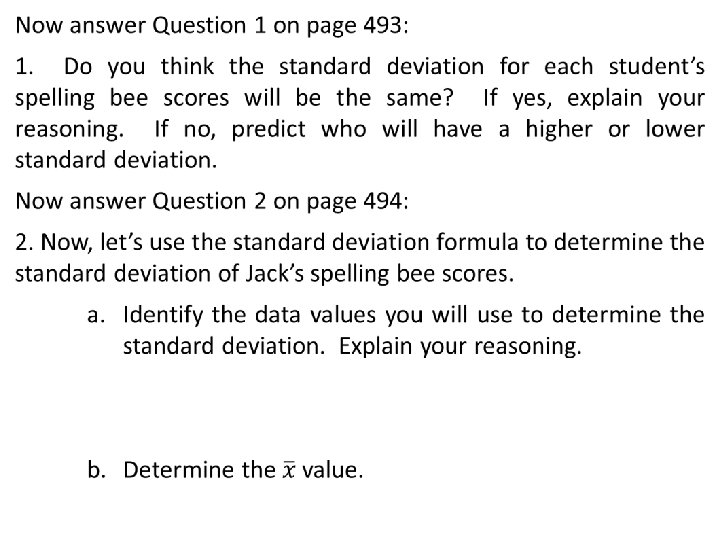
3. Determine the standard deviation for Jack’s spelling bee scores and interpret the meaning.
 the list of elements to paste (CTRL V) them")
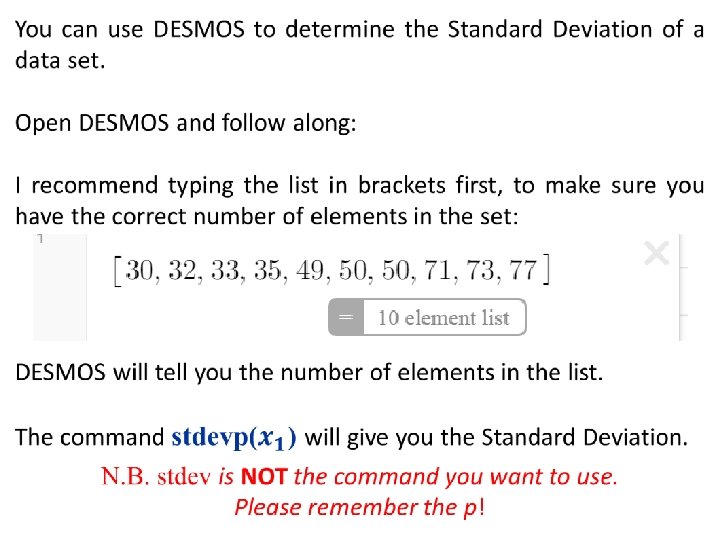
Highlight and copy (CTRL C) the list of elements to paste (CTRL V) them into the next line of DESMOS:

Now use DESMOS to complete Questions 4 – 6 on Page 495: 4. Use DESMOS to determine the standard deviation of Aleah’s and Tymar’s spelling bee scores. Aleah: Standard Deviation ≈ 14. 14 points Tymar: Standard Deviation ≈ 32. 23 points 5. Was the prediction you made in Question 1 correct? What do the standard deviations tell you about each student’s spelling bee scores? 6. Which student do you think Ms. Webb should add to the spelling bee roster? Use the standard deviation for the student you recommend to add to the roster to justify your answer.

Now use DESMOS to complete Problem 1, Question 4 on pages 497 – 498: Recall that Ms. Webb is the spelling bee coach in Problem 1, Spelling SUCCESS. Her class is preparing for their first spelling bee scrimmage. Ms. Webb needs to determine which student should be the spelling bee captain. Ms. Webb believes the captain should have the greatest mean score of the team. The two top spelling bee students’ scores are shown. 1. Analyze each student’s spelling bee scores. a. Determine the mean spelling bee score for each student.

Ms. Webb wants to also use the standard deviation to help her determine which student is a more consistent speller. b. Determine the standard deviation of Maria’s scores. Then determine the value of the spelling bee scores that are 1 standard deviation from the mean. Explain how you determined her spelling bee point values. c. Determine the standard deviation of Heidi’s scores. Then determine the value of the spelling bee scores that are 1 standard deviation from the mean. Explain how you determine her spelling bee point values.

Once you have found 1 standard deviation, it is easy to determine different numbers of standard deviations: 2 standard deviations = 2∙(1 standard deviation) 3 standard deviations = 3∙(1 standard deviation) When you determine the standard deviation of a data set, you can represent it graphically. You can also determine the general percent of data values that are within 1 standard deviation, and the percent of data values that lie within 2 standard deviations in normal distributions. A NORMAL DISTRIBUTION is a collection of many data points that form a bell-shaped curve.

Let’s follow along on pages 499 – 500 and utilize some technology to help: Visit: https: //www mathsisfun. com/ data/standarddeviationcalculator. html and type in the information for Maria’s spelling bee scores, found on page 497.

You will notice the added feature a the bottom of the page, that DESMOS does not provide: A number line with the mean and 1 standard deviation already plotted for you. You can use this information to help you to create your graph by marking the dotted lines needed for the first standard deviation.

51. 10 61. 71 104. 15 114. 76

Finally, draw a smooth bell-shaped curve starting from the far left minimum value to the far left maximum value. 51. 10 61. 71 104. 15 114. 76

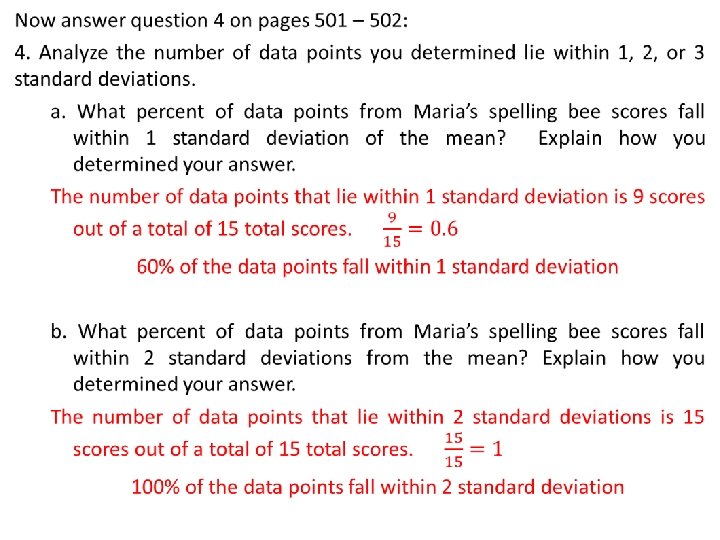
Now complete questions 2 – 3 on pages 500 – 501: 2. Describe some observations you can make about the graph of Maria’s spelling bee scores. 3. Plot each of Maria’s scores on the graph of the worked example. Mark an “x” for the approximate location on the number line for each score. a. Determine how many spelling bee scores are within 1 standard deviation of the mean for Maria’s spelling bee scores. 9 scores are within one standard deviation

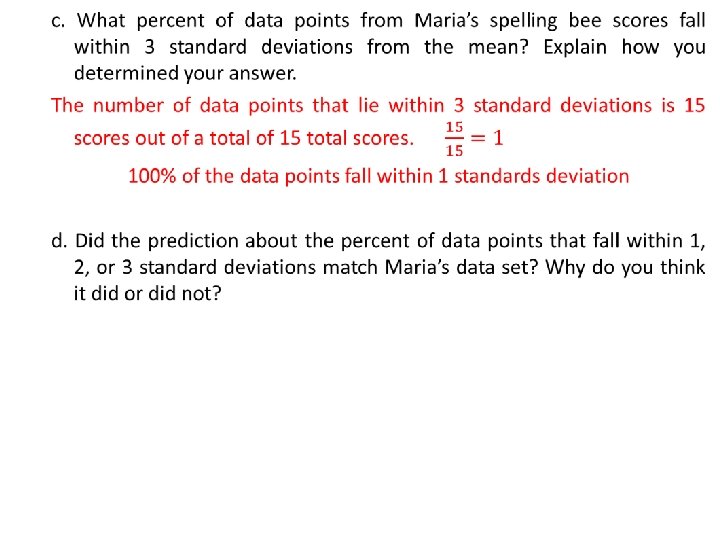
b. Determine how many spelling bee scores are within 2 standard deviations of the mean for Maria’s spelling bee scores. 15 scores are within two standard deviations. The entire data set falls within two standard deviations of the mean. c. Determine how many spelling bee scores are within 3 standard deviations of the mean for Maria’s spelling bee scores. Since the entire data set falls within two standard deviations, it also falls within three standard deviations.

Within the graph of a normal distribution, you can predict the percent of data points that are within one, two, or three standard deviations from the mean. Generally: • 68% of the data points of a data set will fall within one standard deviation of the mean • 95% of the data points of a data set will fall within two standard deviations of the mean • 99% of the data points of a data set will fall within three standard deviations of the mean

It is important to note that the guideline regarding 68%, 95% and 99% is a guideline. There are some data sets in which all of the data points lie within two standard deviations of the mean while other data sets may actually need four or greater standard deviations to encapsulate the entire data set. It is important to know that because standard deviation is based on the mean of a data set, outliers may affect the standard deviation of the data set. Compare these two data sets and see if you can come to any conclusions:

HOMEWORK: • Talk the Talk page 503 • Chapter 8. 5 (pages 505 – 511)
- Slides: 25