Calculating a multilevel index of dissimilarity in R
![Calculating a multilevel index of dissimilarity in R Richard Harris (with thanks to Dewi Calculating a multilevel index of dissimilarity in R Richard Harris (with thanks to Dewi](https://slidetodoc.com/presentation_image_h/208c345ac108bd01df2e2a853d800657/image-1.jpg)
![Introduction Measuring segregation with the Index of Dissimilarity (ID) Introduction Measuring segregation with the Index of Dissimilarity (ID)](https://slidetodoc.com/presentation_image_h/208c345ac108bd01df2e2a853d800657/image-2.jpg)
![Index of Dissimilarity “all of the segregation indexes have in common the assumption that Index of Dissimilarity “all of the segregation indexes have in common the assumption that](https://slidetodoc.com/presentation_image_h/208c345ac108bd01df2e2a853d800657/image-3.jpg)
![Index of Dissimilarity • • Measures spatial unevenness (spatial heterogeneity) and the numeric scale Index of Dissimilarity • • Measures spatial unevenness (spatial heterogeneity) and the numeric scale](https://slidetodoc.com/presentation_image_h/208c345ac108bd01df2e2a853d800657/image-4.jpg)
![Multiscale measures of segregation Segregation as a multiscale outcome of processes that themselves operate Multiscale measures of segregation Segregation as a multiscale outcome of processes that themselves operate](https://slidetodoc.com/presentation_image_h/208c345ac108bd01df2e2a853d800657/image-5.jpg)
![Multiscale measures of segregation Egocentric approaches § § § Group a neighbourhood with its Multiscale measures of segregation Egocentric approaches § § § Group a neighbourhood with its](https://slidetodoc.com/presentation_image_h/208c345ac108bd01df2e2a853d800657/image-6.jpg)
![Multiscale measures of segregation Egocentric approaches § § § Rooted in a view of Multiscale measures of segregation Egocentric approaches § § § Rooted in a view of](https://slidetodoc.com/presentation_image_h/208c345ac108bd01df2e2a853d800657/image-7.jpg)
![Multilevel Index of Dissimilarity Theory and Measurement Multilevel Index of Dissimilarity Theory and Measurement](https://slidetodoc.com/presentation_image_h/208c345ac108bd01df2e2a853d800657/image-8.jpg)
![Multilevel Index of Dissimilarity (MLID) Standard Index § Multilevel Index § Multilevel Index of Dissimilarity (MLID) Standard Index § Multilevel Index §](https://slidetodoc.com/presentation_image_h/208c345ac108bd01df2e2a853d800657/image-9.jpg)
![Two principal dimensions of segregation: Unevenness and clustering TL TR BL BR ID 1. Two principal dimensions of segregation: Unevenness and clustering TL TR BL BR ID 1.](https://slidetodoc.com/presentation_image_h/208c345ac108bd01df2e2a853d800657/image-10.jpg)
![Process of spatial diffusion TL TR BL BR ID 1. 00 0. 875 0. Process of spatial diffusion TL TR BL BR ID 1. 00 0. 875 0.](https://slidetodoc.com/presentation_image_h/208c345ac108bd01df2e2a853d800657/image-11.jpg)
![Implementation The MLID package for the open source software, R Implementation The MLID package for the open source software, R](https://slidetodoc.com/presentation_image_h/208c345ac108bd01df2e2a853d800657/image-12.jpg)
![The MLID package for R > require(MLID) > data(ethnicities) > # Standard ID > The MLID package for R > require(MLID) > data(ethnicities) > # Standard ID >](https://slidetodoc.com/presentation_image_h/208c345ac108bd01df2e2a853d800657/image-13.jpg)
![The MLID package for R White. Brit ~ Bangladeshi ID: 0. 852 Pvariance Holdback The MLID package for R White. Brit ~ Bangladeshi ID: 0. 852 Pvariance Holdback](https://slidetodoc.com/presentation_image_h/208c345ac108bd01df2e2a853d800657/image-14.jpg)
![The MLID package for R > model 1 <- id(ethnicities, c("White. Brit", "Bangladeshi"), levels The MLID package for R > model 1 <- id(ethnicities, c("White. Brit", "Bangladeshi"), levels](https://slidetodoc.com/presentation_image_h/208c345ac108bd01df2e2a853d800657/image-15.jpg)
![](https://slidetodoc.com/presentation_image_h/208c345ac108bd01df2e2a853d800657/image-16.jpg)
![The MLID package for R § § Offers a range of ways to explore The MLID package for R § § Offers a range of ways to explore](https://slidetodoc.com/presentation_image_h/208c345ac108bd01df2e2a853d800657/image-17.jpg)
![References § § § Harris R 2017 Measuring the scales of segregation: looking at References § § § Harris R 2017 Measuring the scales of segregation: looking at](https://slidetodoc.com/presentation_image_h/208c345ac108bd01df2e2a853d800657/image-18.jpg)
- Slides: 18
![Calculating a multilevel index of dissimilarity in R Richard Harris with thanks to Dewi Calculating a multilevel index of dissimilarity in R Richard Harris (with thanks to Dewi](https://slidetodoc.com/presentation_image_h/208c345ac108bd01df2e2a853d800657/image-1.jpg)
Calculating a multilevel index of dissimilarity in R Richard Harris (with thanks to Dewi Owen) School of Geographical Sciences University of Bristol
![Introduction Measuring segregation with the Index of Dissimilarity ID Introduction Measuring segregation with the Index of Dissimilarity (ID)](https://slidetodoc.com/presentation_image_h/208c345ac108bd01df2e2a853d800657/image-2.jpg)
Introduction Measuring segregation with the Index of Dissimilarity (ID)
![Index of Dissimilarity all of the segregation indexes have in common the assumption that Index of Dissimilarity “all of the segregation indexes have in common the assumption that](https://slidetodoc.com/presentation_image_h/208c345ac108bd01df2e2a853d800657/image-3.jpg)
Index of Dissimilarity “all of the segregation indexes have in common the assumption that segregation can be measured without regard to the spatial patterns of white and non-white residence in a city. ” Duncan and Duncan (1955, p. 215) ID =1 in all four cases (the segregation is equal in all cases)
![Index of Dissimilarity Measures spatial unevenness spatial heterogeneity and the numeric scale Index of Dissimilarity • • Measures spatial unevenness (spatial heterogeneity) and the numeric scale](https://slidetodoc.com/presentation_image_h/208c345ac108bd01df2e2a853d800657/image-4.jpg)
Index of Dissimilarity • • Measures spatial unevenness (spatial heterogeneity) and the numeric scale of segregation But not spatial clustering and the geographical scale of segregation ID =1 in all four cases (the segregation is equal in all cases)
![Multiscale measures of segregation Segregation as a multiscale outcome of processes that themselves operate Multiscale measures of segregation Segregation as a multiscale outcome of processes that themselves operate](https://slidetodoc.com/presentation_image_h/208c345ac108bd01df2e2a853d800657/image-5.jpg)
Multiscale measures of segregation Segregation as a multiscale outcome of processes that themselves operate across geographic scales
![Multiscale measures of segregation Egocentric approaches Group a neighbourhood with its Multiscale measures of segregation Egocentric approaches § § § Group a neighbourhood with its](https://slidetodoc.com/presentation_image_h/208c345ac108bd01df2e2a853d800657/image-6.jpg)
Multiscale measures of segregation Egocentric approaches § § § Group a neighbourhood with its k 1 nearest neighbours – make the calculation, z Repeat with k 2 nearest neighbours (k 2 > k 1) And with k 3 nearest neighbours (k 3 > k 2 > k 1) Etc. Look at z ƒ k Multilevel approaches §
![Multiscale measures of segregation Egocentric approaches Rooted in a view of Multiscale measures of segregation Egocentric approaches § § § Rooted in a view of](https://slidetodoc.com/presentation_image_h/208c345ac108bd01df2e2a853d800657/image-7.jpg)
Multiscale measures of segregation Egocentric approaches § § § Rooted in a view of geographic space as continuous (a field-based view) Flexible But examining aggregation effects not scale effects per se Multilevel approaches § § Rooted in a view of geographic space with discrete boundaries (an object-based view) More rigid Does measure the residuals at each level net of those at others (so disentangling what is due to each distinct level) But is conflating levels with scales
![Multilevel Index of Dissimilarity Theory and Measurement Multilevel Index of Dissimilarity Theory and Measurement](https://slidetodoc.com/presentation_image_h/208c345ac108bd01df2e2a853d800657/image-8.jpg)
Multilevel Index of Dissimilarity Theory and Measurement
![Multilevel Index of Dissimilarity MLID Standard Index Multilevel Index Multilevel Index of Dissimilarity (MLID) Standard Index § Multilevel Index §](https://slidetodoc.com/presentation_image_h/208c345ac108bd01df2e2a853d800657/image-9.jpg)
Multilevel Index of Dissimilarity (MLID) Standard Index § Multilevel Index §
![Two principal dimensions of segregation Unevenness and clustering TL TR BL BR ID 1 Two principal dimensions of segregation: Unevenness and clustering TL TR BL BR ID 1.](https://slidetodoc.com/presentation_image_h/208c345ac108bd01df2e2a853d800657/image-10.jpg)
Two principal dimensions of segregation: Unevenness and clustering TL TR BL BR ID 1. 0 σ1× 1 100% 1. 56% σ2× 2 0% 98. 4% 0% 0% σ4× 4 0% 0% 98. 4% 0% σ8× 8 0% 0% 0% 98. 4%
![Process of spatial diffusion TL TR BL BR ID 1 00 0 875 0 Process of spatial diffusion TL TR BL BR ID 1. 00 0. 875 0.](https://slidetodoc.com/presentation_image_h/208c345ac108bd01df2e2a853d800657/image-11.jpg)
Process of spatial diffusion TL TR BL BR ID 1. 00 0. 875 0. 719 0. 561 σ1× 1 100% 16. 1% 29. 5% 22. 0% σ2× 2 0% 83. 9% 60. 3% 51. 4% σ4× 4 0% 0% 10. 2% 26. 7%
![Implementation The MLID package for the open source software R Implementation The MLID package for the open source software, R](https://slidetodoc.com/presentation_image_h/208c345ac108bd01df2e2a853d800657/image-12.jpg)
Implementation The MLID package for the open source software, R
![The MLID package for R requireMLID dataethnicities Standard ID The MLID package for R > require(MLID) > data(ethnicities) > # Standard ID >](https://slidetodoc.com/presentation_image_h/208c345ac108bd01df2e2a853d800657/image-13.jpg)
The MLID package for R > require(MLID) > data(ethnicities) > # Standard ID > id(ethnicities, c("White. Brit", "Bangladeshi")) > # Multilevel ID > id(ethnicities, c("White. Brit", "Bangladeshi“), levels = c("LSOA", "MSOA", "LAD", "RGN"))
![The MLID package for R White Brit Bangladeshi ID 0 852 Pvariance Holdback The MLID package for R White. Brit ~ Bangladeshi ID: 0. 852 Pvariance Holdback](https://slidetodoc.com/presentation_image_h/208c345ac108bd01df2e2a853d800657/image-14.jpg)
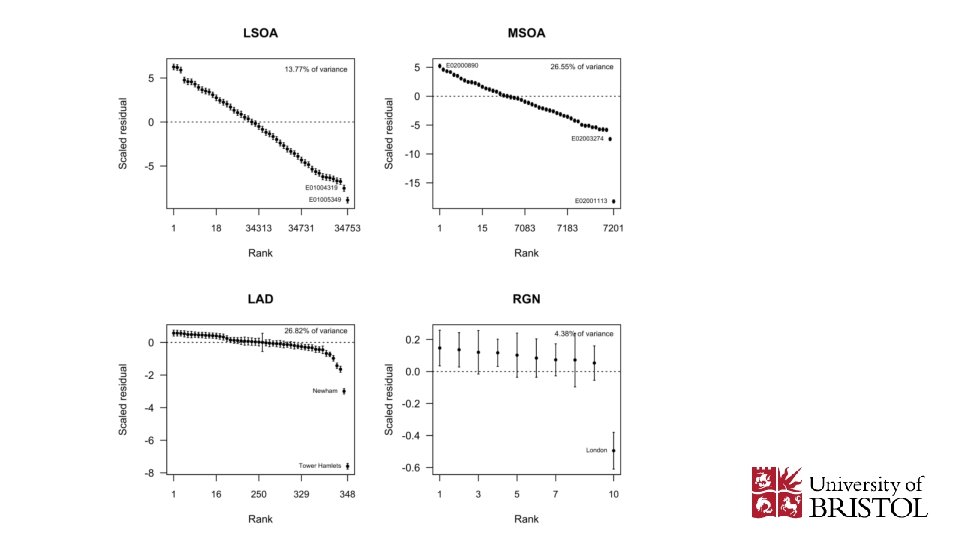
The MLID package for R White. Brit ~ Bangladeshi ID: 0. 852 Pvariance Holdback Base 28. 48 -12. 16 LSOA 13. 77 -3. 14 MSOA 26. 55 -4. 66 LAD 26. 82 -1. 72 RGN 4. 38 -12. 32
![The MLID package for R model 1 idethnicities cWhite Brit Bangladeshi levels The MLID package for R > model 1 <- id(ethnicities, c("White. Brit", "Bangladeshi"), levels](https://slidetodoc.com/presentation_image_h/208c345ac108bd01df2e2a853d800657/image-15.jpg)
The MLID package for R > model 1 <- id(ethnicities, c("White. Brit", "Bangladeshi"), levels = c("LSOA", "MSOA", "LAD", "RGN")) > ci <- confint(model 1) > catplot(ci)
![](https://slidetodoc.com/presentation_image_h/208c345ac108bd01df2e2a853d800657/image-16.jpg)
![The MLID package for R Offers a range of ways to explore The MLID package for R § § Offers a range of ways to explore](https://slidetodoc.com/presentation_image_h/208c345ac108bd01df2e2a853d800657/image-17.jpg)
The MLID package for R § § Offers a range of ways to explore effect sizes, to consider the impact of various places upon the overall ID, to see what happens if specific places are omitted, etc. See the tutorial (vignette) at https: //cran. rproject. org/web/packages/MLID/vignettes/MLID. html
![References Harris R 2017 Measuring the scales of segregation looking at References § § § Harris R 2017 Measuring the scales of segregation: looking at](https://slidetodoc.com/presentation_image_h/208c345ac108bd01df2e2a853d800657/image-18.jpg)
References § § § Harris R 2017 Measuring the scales of segregation: looking at the residential separation of White British and other schoolchildren in England using a multilevel index of dissimilarity Transactions of the Institute of British Geographers http: //onlinelibrary. wiley. com/doi/10. 1111/tran. 12181/abstract Harris R 2017 MLID: Tools and functions to fit a multilevel index of dissimilarity School of Geographical Sciences, University of Bristol https: //cran. r-project. org/web/packages/MLID/ Harris R & Owen D 2018 Developing a multilevel index of dissimilarity in R with a case study looking at the changing scales of residential ethnic segregation in England Wales between 2001 and 2011 Environment and Planning B http: //journals. sagepub. com/doi/full/10. 1177/2399808317748328
Index of dissimilarity
Similarity and dissimilarity in data mining
Data matrix and dissimilarity matrix
Similarity and dissimilarity measures in data mining
Proximity measures for binary attributes
Multi level instruction
Multilevel page tables
Teaching multilevel esl classes
Celia oyler
Multilevel nand gate
Priority scheduling
Multilevel paging in os
Contoh multilevel inheritance
Mfq scheduling
Multilevel modeling spss
Mlfq
Multilevel scheme in data communication
Pengertian dari inheritance
Multilevel bus architecture in embedded systems