
Caesarean section 19 november 2007 Evelyne Martens Trends
Caesarean section 19 november 2007 Evelyne Martens
Trends in caesarean section rate in Flanders (1987 -2006)
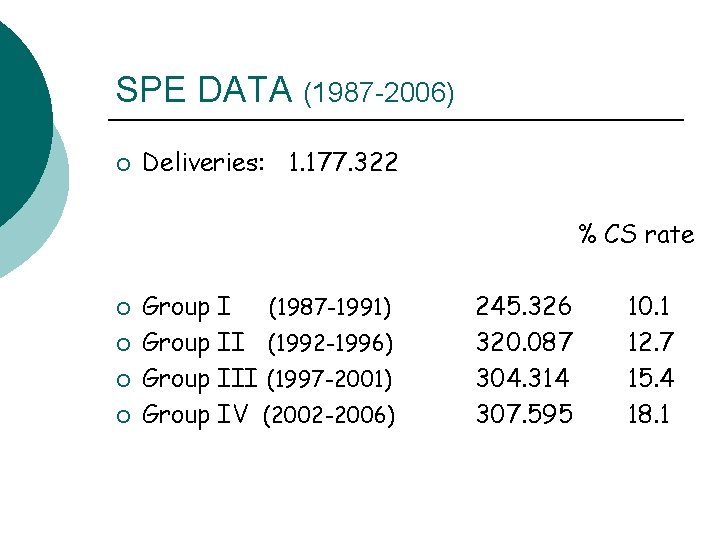
SPE DATA (1987 -2006) ¡ Deliveries: 1. 177. 322 % CS rate ¡ ¡ Group I (1987 -1991) Group II (1992 -1996) Group III (1997 -2001) Group IV (2002 -2006) 245. 326 320. 087 304. 314 307. 595 10. 1 12. 7 15. 4 18. 1
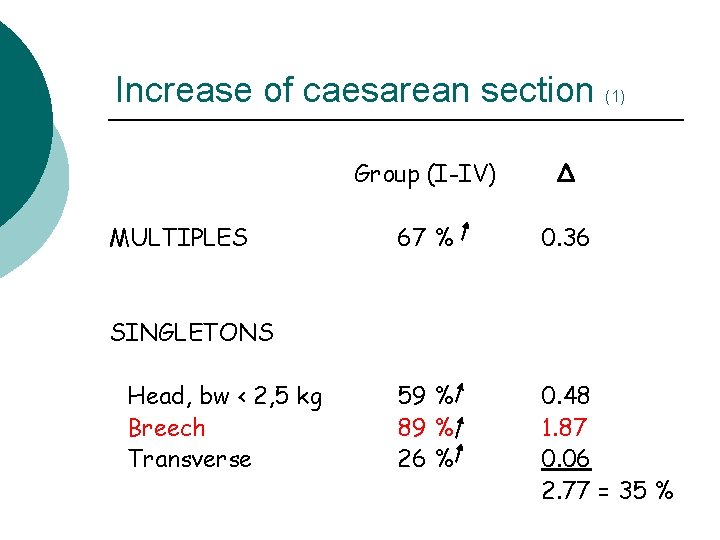
Increase of caesarean section (1) MULTIPLES Group (I-IV) Δ 67 % 0. 36 59 % 89 % 26 % 0. 48 1. 87 0. 06 2. 77 = 35 % SINGLETONS Head, bw < 2, 5 kg Breech Transverse
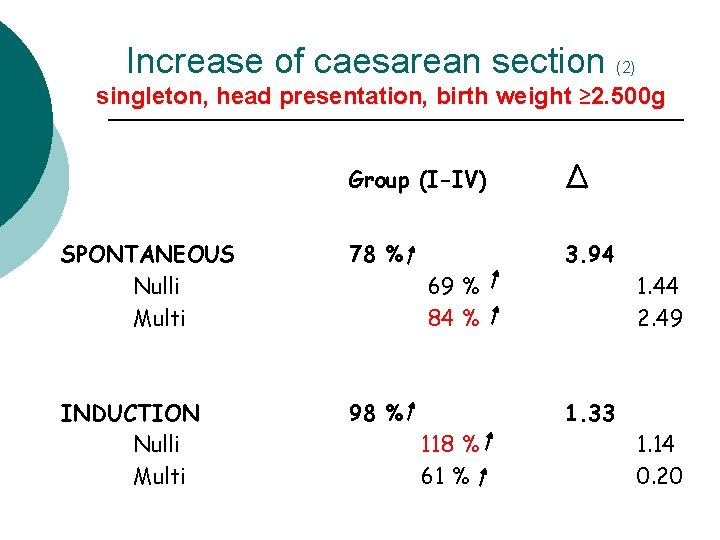
Increase of caesarean section (2) singleton, head presentation, birth weight ≥ 2. 500 g Group (I-IV) Δ SPONTANEOUS Nulli Multi 78 % 3. 94 INDUCTION Nulli Multi 98 % 69 % 84 % 1. 44 2. 49 1. 33 118 % 61 % 1. 14 0. 20
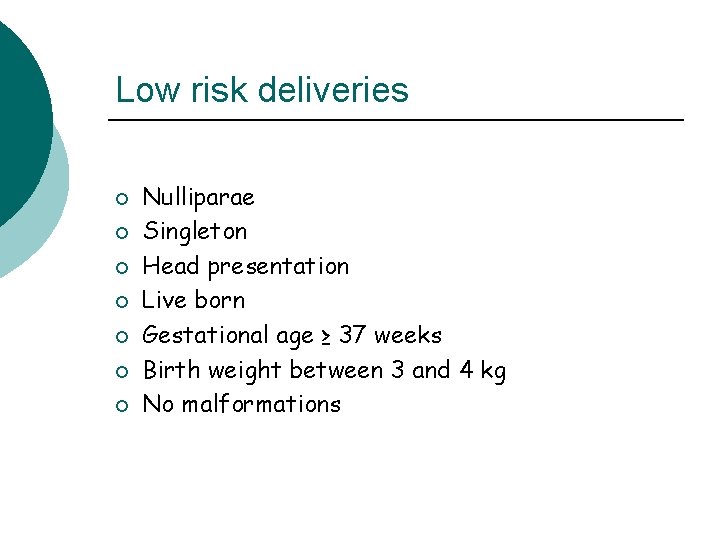
Low risk deliveries ¡ ¡ ¡ ¡ Nulliparae Singleton Head presentation Live born Gestational age ≥ 37 weeks Birth weight between 3 and 4 kg No malformations
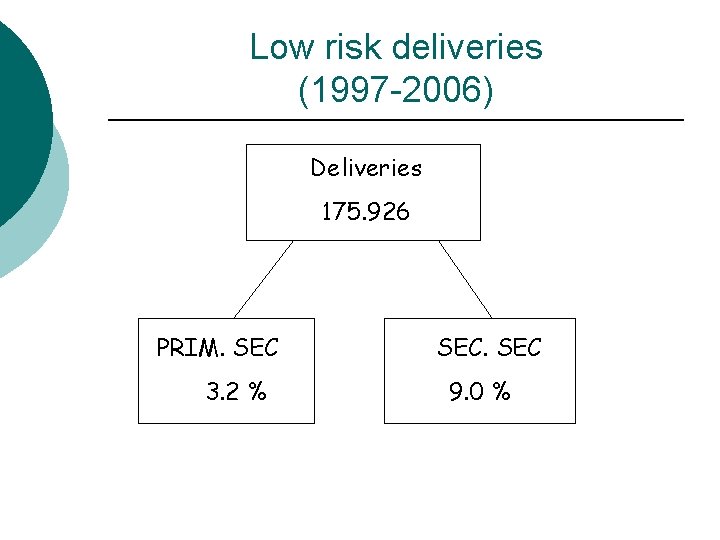
Low risk deliveries (1997 -2006) Deliveries 175. 926 PRIM. SEC 3. 2 % SEC 9. 0 %
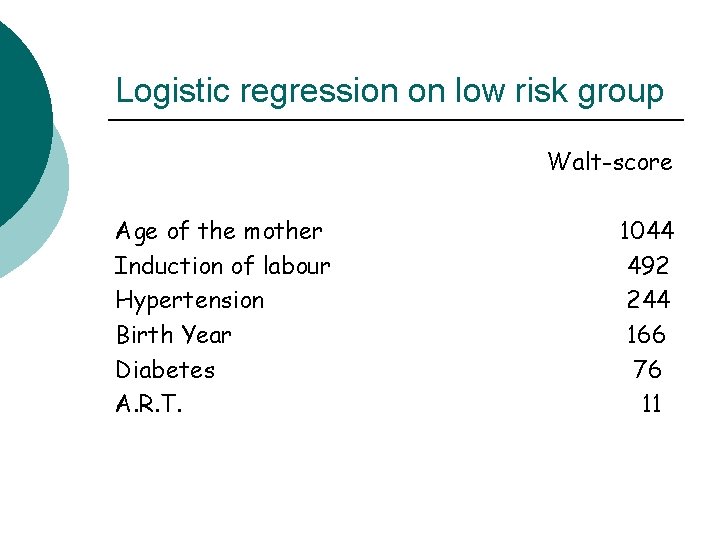
Logistic regression on low risk group Walt-score Age of the mother Induction of labour Hypertension Birth Year Diabetes A. R. T. 1044 492 244 166 76 11
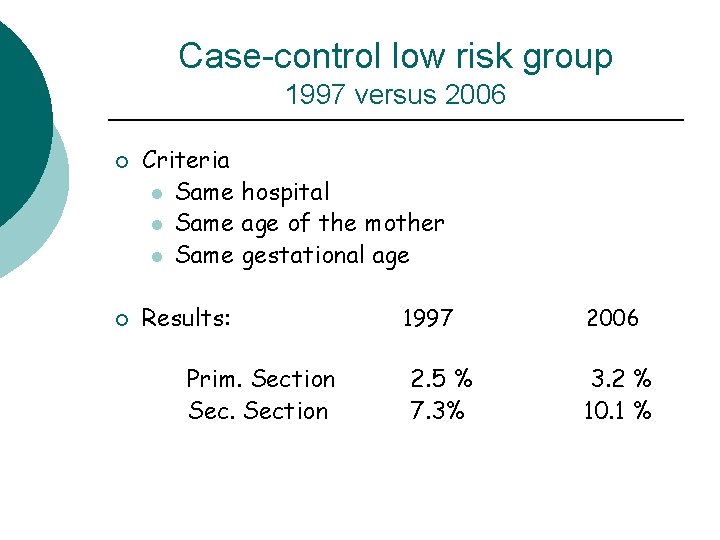
Case-control low risk group 1997 versus 2006 ¡ ¡ Criteria l Same hospital l Same age of the mother l Same gestational age Results: Prim. Section Section 1997 2. 5 % 7. 3% 2006 3. 2 % 10. 1 %
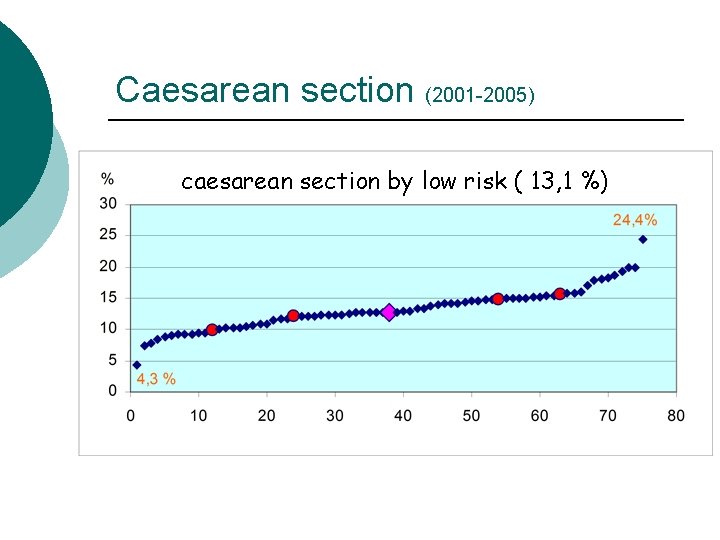
Caesarean section (2001 -2005) caesarean section by low risk ( 13, 1 %)

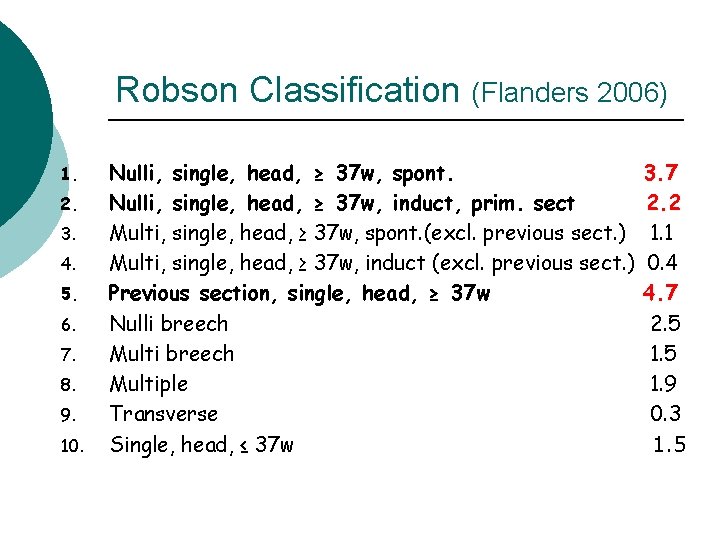
Robson Classification (Flanders 2006) 1. 2. 3. 4. 5. 6. 7. 8. 9. 10. Nulli, single, head, ≥ 37 w, spont. Nulli, single, head, ≥ 37 w, induct, prim. sect Multi, single, head, ≥ 37 w, spont. (excl. previous sect. ) Multi, single, head, ≥ 37 w, induct (excl. previous sect. ) Previous section, single, head, ≥ 37 w Nulli breech Multiple Transverse Single, head, ≤ 37 w 3. 7 2. 2 1. 1 0. 4 4. 7 2. 5 1. 9 0. 3 1. 5
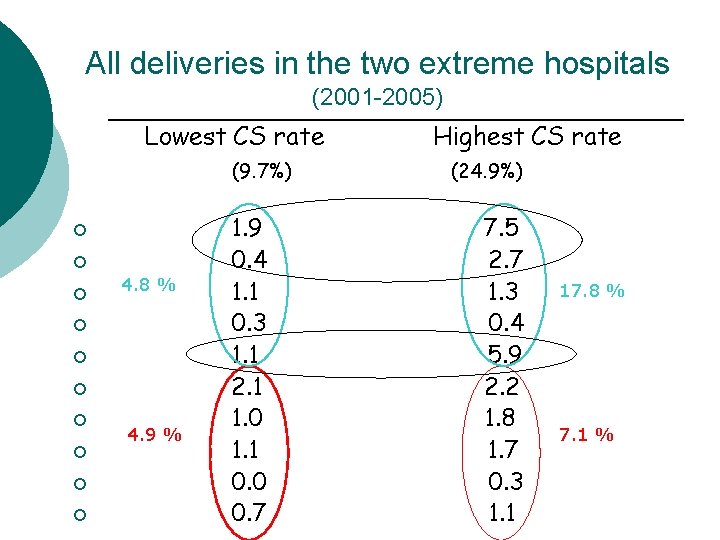
All deliveries in the two extreme hospitals (2001 -2005) Lowest CS rate (9. 7%) ¡ ¡ ¡ 4. 8 % ¡ ¡ ¡ ¡ 4. 9 % 1. 9 0. 4 1. 1 0. 3 1. 1 2. 1 1. 0 1. 1 0. 0 0. 7 Highest CS rate (24. 9%) 7. 5 2. 7 1. 3 0. 4 5. 9 2. 2 1. 8 1. 7 0. 3 1. 1 17. 8 % 7. 1 %
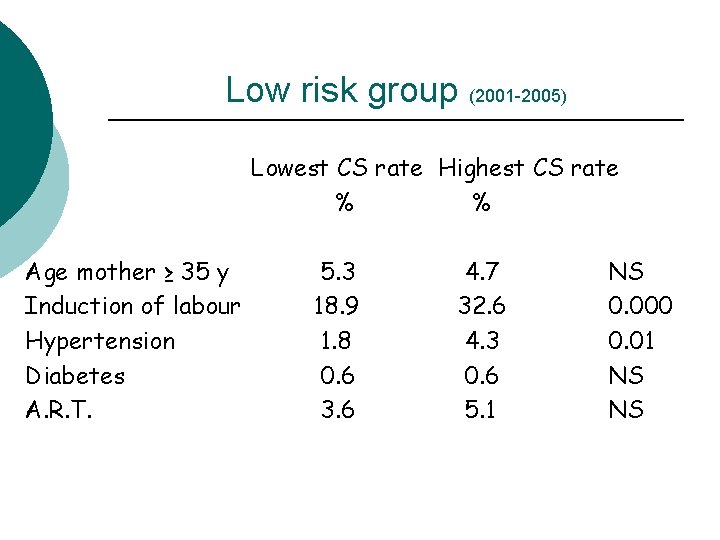
Low risk group (2001 -2005) Lowest CS rate Highest CS rate % % Age mother ≥ 35 y Induction of labour Hypertension Diabetes A. R. T. 5. 3 18. 9 1. 8 0. 6 3. 6 4. 7 32. 6 4. 3 0. 6 5. 1 NS 0. 000 0. 01 NS NS
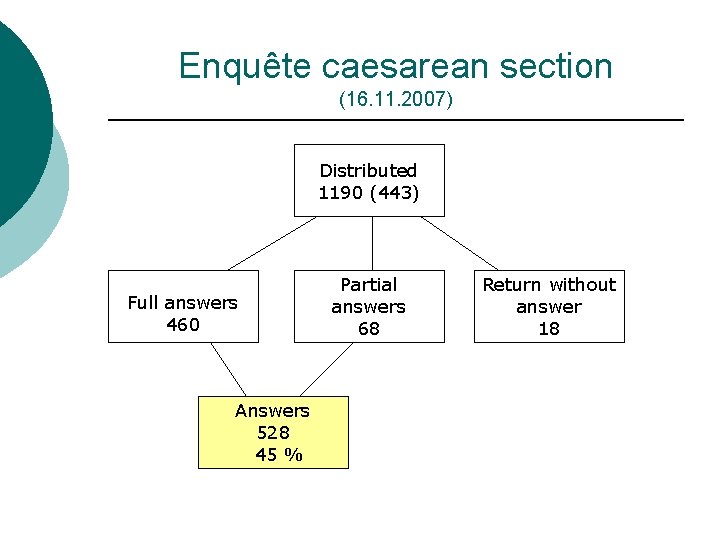
Enquête caesarean section (16. 11. 2007) Distributed 1190 (443) Full answers 460 Answers 528 45 % Partial answers 68 Return without answer 18
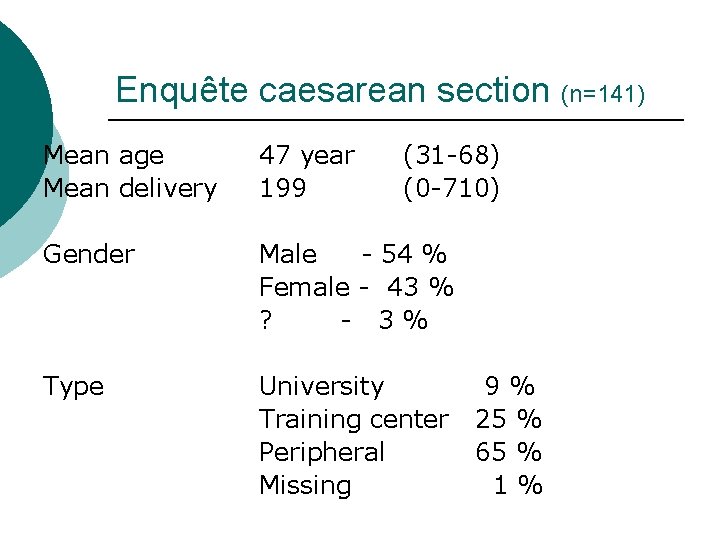
Enquête caesarean section (n=141) Mean age Mean delivery 47 year 199 (31 -68) (0 -710) Gender Male - 54 % Female - 43 % ? - 3% Type University Training center Peripheral Missing 9% 25 % 65 % 1%
Enquête caesarean section
Enquête caesarean section
Enquête caesarean section
- Slides: 19