C 3 Ternary Systems Example 1 Ternary Eutectic


: bulk = a FFirst melt at M (1270 o. C)")


- Slides: 19
C = 3: Ternary Systems: Example 1: Ternary Eutectic Note three binary eutectics No solid solution Ternary eutectic = M Di - An - Fo As add components, becomes increasingly difficult to depict. F 1 -C: P - T diagrams easy F 2 -C: isobaric T-X, isothermal P-X… F 3 -C: ? ? s. Still need T or P variable s. Projection? Hard to use as shown Anorthite M T Forsterite Diopside
T - X Projection of Di - An - Fo X-X diagram with T contours (P constant) Liquidus surface works like topographic map Red lines are ternary Cotectic troughs Run from binary eutectics down T to ternary eutectic M Separate fields labeled for phases in that field Figure 7 -2. Isobaric diagram illustrating the liquidus temperatures in the Di-An-Fo system at atmospheric pressure (0. 1 MPa). After Bowen (1915), A. J. Sci. , and Morse (1994), Basalts and Phase Diagrams. Krieger Publishers. Cotectic: multiple solid phases crystallize from a single liquid
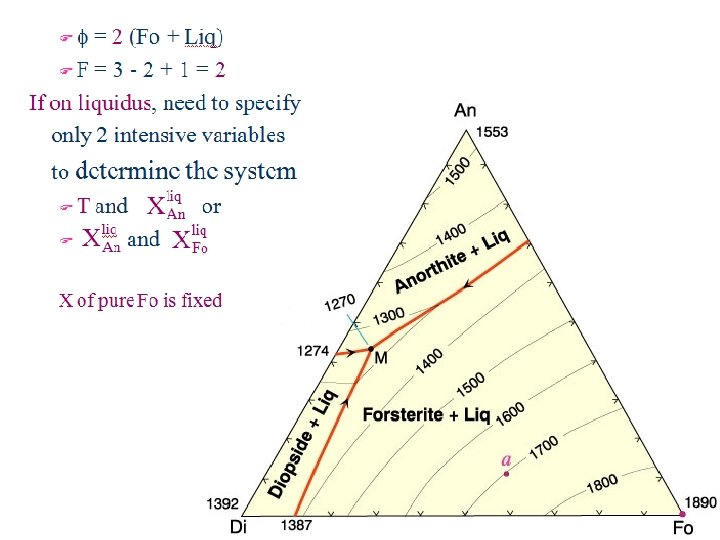
Cool composition a from 2000 o. C Still liquid At 2000 o. C: phi = 1 (liquid) F = C - phi + 1 =3 -1+1=3 = T, X(An)Liq, X(Di)Liq, and X(Fo)Liq only 2 of 3 X’s are independent Crystallization Relationships Next cool to 1700 o. C Intersects liquidus surface Solids form
Pressure fixed at 0. 1 MPa Pure Fo forms Just as in binary f=? F=?
Lever principle ® relative proportions of liquid & Fo l At 1500 C o
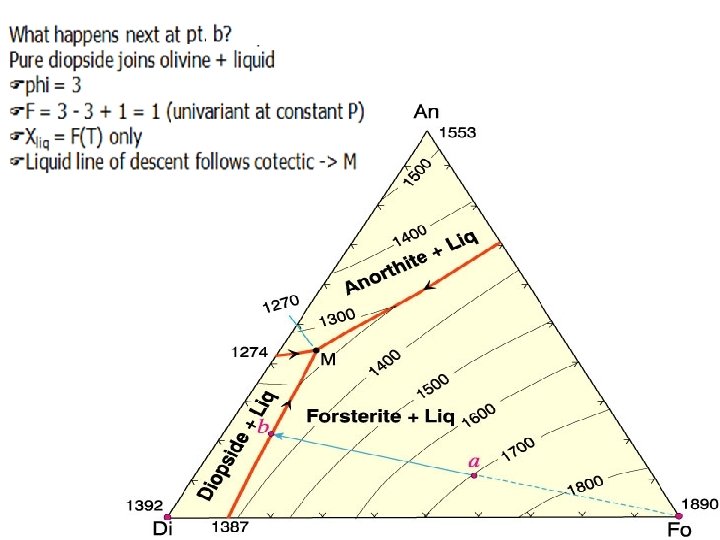
F o At 1300 C liquid = x Imagine triangular plane X - Di - Fo balanced on bulk a F Draw a working line from x through a to the opposite side, m = total solids F Liq x a Di / m / total Di/Fo = m-Fo/Di-m Liq total solids = a-m Liq-a Total amounts of three phases at any T can be determined by a modified lever principle Fo
At 1270 o. C reach M the ternary eutectic Fanorthite joins liquid + forsterite + diopside Fphi = 4 (3 solids 1 liq) FF = 3 - 4 + 1 = 0 (invariant) Fdiscontinuous reaction: s. Liq = Di + An + Fo sstay at 1270 o. C until consume liquid Below 1270 o. C have all solid Fo + Di + An Fphi = 3 FF = 3 - 3 + 1 = 1
Partial Melting (remove melt): bulk = a FFirst melt at M (1270 o. C) FStay at M until consume one phase (An) FOnly Di and Fo left FJump to Di-Fo binary FNo further melt until at 1387 o. C mp of Diopside FStay at 1387 o. C until consume one phase (Di) FOnly Fo left FNo further melt until 1890 o. C mp of Fo FSuppose
The Effect of Pressure You recall the Clapeyron Equation if d. G =0, then d. P/d. T = ΔS / ΔV OR d. P ΔV = d. T ΔS For d. G to stay zero, higher pressure requires lower volume so d. T ΔS stays constant which phase should be stable at high P? The one where volume decreases as pressure increases, a solid. Notice then that the melting point increases with temperature, i. e. solid is stable at higher temperatures. P 2 Pressure ~All solid - liquid (melting) reactions have a positive slope Solid Liquid P 1 T 2 Temperature
Increasing pressure decreases volume, and the liquid state, which usually needs more volume, is less likely at high P, so the Melting Point occurs at Higher Temperature For example, in a eutectic system, increasing pressure will raise the eutectic melting point The magnitude of the effect will vary for different minerals Change in An liquidus small Change in Diopside liquidus large • Anorthite compresses less than Diopside • Thus the elevation of the melting point is less for An than Di along the liquidus • The only way to do that is to move the eutectic toward An as the liquidi rise. Eutectic system Figure 7 -16. Effect of lithostatic pressure on the liquidus and eutectic composition in the diopsideanorthite system. 1 GPa data from Presnall et al. (1978). Contr. Min. Pet. , 66, 203 -220.
The Effect of Water on Melting Dry melting: solid ® liquid Add water- some water enters the melt Reaction becomes: solid + water = melt + water (right side is an aqueous solution) Figure 7 -19. The effect of H 2 O saturation on the melting of Albite, from the experiments by Burnham and Davis (1974). A J Sci 274, 902 -940. The “dry” melting curve is from Boyd and England (1963). JGR 68, 311 -323.
The Effect of Water on Melting • The reaction was Solid => Liquid. Adding water “drives the reaction to the right”, in the sense that it melts (goes to liquid) at a lower temp than it would if dry • Liquid is stabilized at the expense of the solid. • The result is to lower the melting point. • Pressure is required to hold the water in the melt, so increased pressure allows more water to enter the melt and this increases the melting point depression THE SLOPE CHANGES TO NEGATIVE Figure 7 -19. The effect of H 2 O saturation on the melting of albite, from the experiments by Burnham and Davis (1974). A J Sci 274, 902940. The “dry” melting curve is from Boyd and England (1963). JGR 68, 311 -323.
Note the difference in the dry melting temperature and the melting interval of a basalt as compared to the watersaturated equivalents The melting point depression is quite dramatic, especially at low to intermediate Pressures 1 – 1. 5 GPa Figure 7 -20. Experimentally determined melting intervals of gabbro under H 2 O-free (“dry”), and H 2 O-saturated conditions. After Lambert and Wyllie (1972). J. Geol. , 80, 693 -708.
Dry and water-saturated solids for some common rock types The more mafic the rock the higher the melting point All solidi are greatly lowered by water Figure 7 -21. H 2 O-saturated (solid) and H 2 O-free (dashed) solidi (beginning of melting) for granodiorite (Robertson and Wyllie, 1971), gabbro (Lambert and Wyllie, 1972) and peridotite (H 2 Osaturated: Kushiro et al. , 1968; dry: Ito and Kennedy, 1967). Granite is only a crustal rock (not found deeper than 2. 2 GPa) ~80 km MAX cont. crust
The solubility of water in a melt depends on the structure of the melt (which reflects the structure of the mineralogical equivalent) Water dissolves more in polymerized melts (An > Di) Thus the melting point depression effect is greater for An than Di The eutectic moves toward An Figure 7 -25. The effect of H 2 O on the diopside-anorthite liquidus. Dry and 1 atm from Figure 7 -16, PH 2 O = Ptotal curve for 1 GPa from Yoder (1965). CIW Yb 64.
Two principal types of basalt in the ocean basins Tholeiitic Basalt and Alkaline Basalt Ocean Islands such as Hawaii have both Tholeitic AND Alkaline Basalts Table 10 -1 Common petrographic differences between tholeiitic and alkaline basalts Subalkaline: Tholeiitic-type Basalt Groundmass Usually fine-grained, intergranular Usually fairly coarse, intergranular to ophitic No olivine Olivine common Clinopyroxene = augite (plus possibly pigeonite) Titaniferous augite (reddish) Orthopyroxene (hypersthene) common, may rim ol. Orthopyroxene absent No alkali feldspar Interstitial alkali feldspar or feldspathoid may occur Interstitial glass and/or quartz common Interstitial glass rare, and quartz absent Olivine rare, unzoned, and may be partially resorbed Phenocrysts Alkaline Basalt Olivine common and zoned or show reaction rims of orthopyroxene Orthopyroxene uncommon Orthopyroxene absent Early plagioclase common Plagioclase later in sequence, uncommon Clinopyroxene is pale brown augite Clinopyroxene is titaniferous augite, reddish rims after Hughes (1982) and Mc. Birney (1993). A third is hi-Al, or calc-alkaline basalt, usually continental
Effect of Pressure, Water, and CO 2 on the position of the eutectic in the basalt system Increased pressure moves the ternary eutectic (first melt) from silica-saturated to highly undersat. alkaline basalts Water moves the (2 GPa) eutectic toward higher silica, while CO 2 moves it to more alkaline types Ne Ne Increasing pressure From Tholeiitic to Alkaline Volatile-free 3 GPa 2 GPa d ate lts r u a at s erstic ba d Unoleii th En CO 2 dry 1 GPa Highly undesaturated (nepheline-bearing) alkali olivine basalts Fo P = 2 GPa Ab Highly undesaturated (nepheline-bearing) alkali olivine basalts 1 atm ted ts a r atu basal s r de ic Unoleiit th Oversaturated (quartz-bearing) tholeiitic basalts Si. O 2 Fo En Constant P H 2 O down CO 2 up H 2 O Ab Oversaturated (quartz-bearing) tholeiitic basalts Si. O 2