
By Hamizah Hanim Hamzah Helen Ellwood and Zoltn
By: Hamizah Hanim Hamzah, Helen Ellwood, and Zoltán Erdős
Contents • Obtaining measurements • Processing data • Results • Interpretation
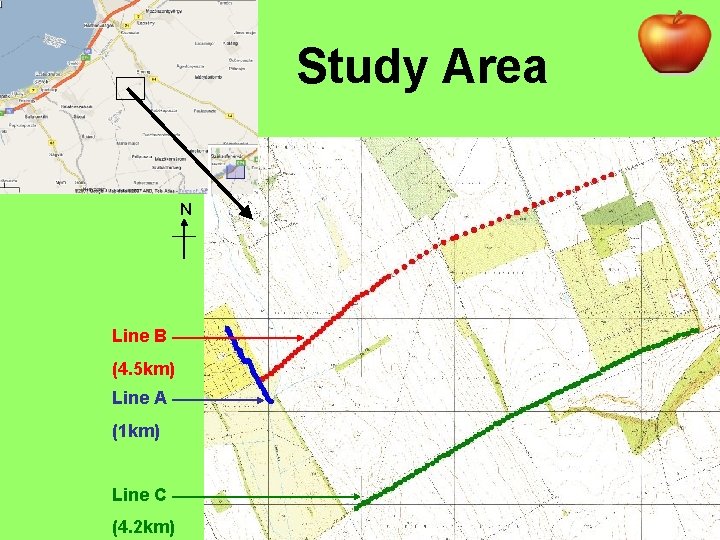
Study Area N Line B (4. 5 km) Line A (1 km) Line C (4. 2 km)
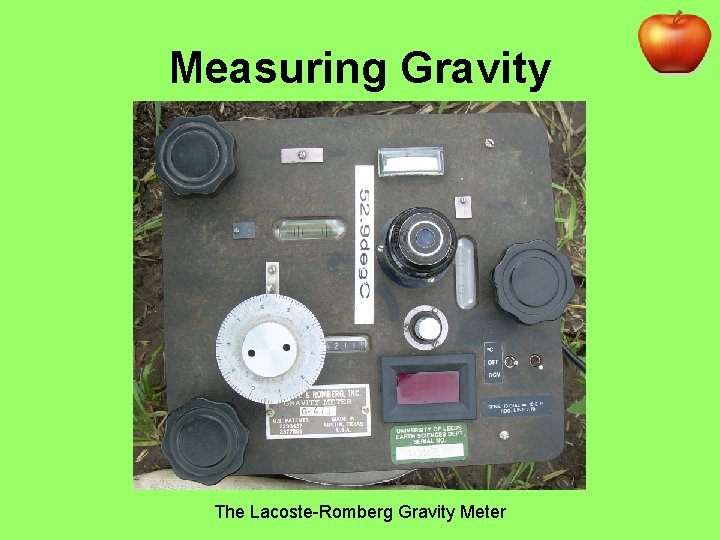
Measuring Gravity The Lacoste-Romberg Gravity Meter
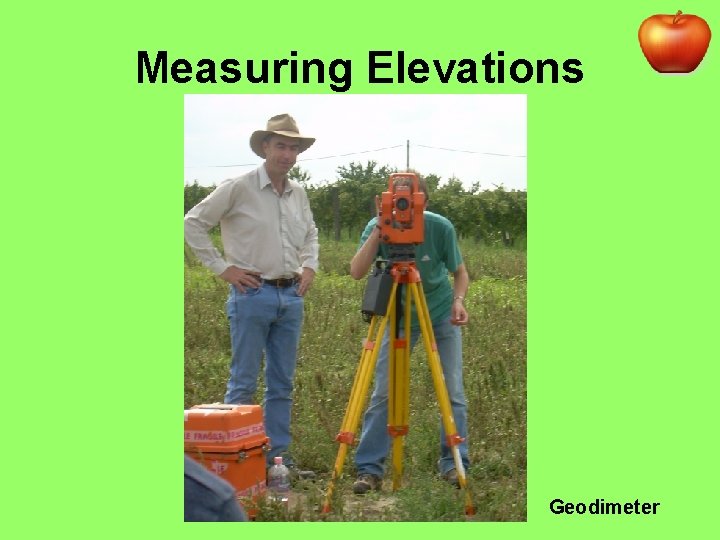
Measuring Elevations Geodimeter
Processing Method Corrections needed for: 1. Tides 2. Instrument drift Due to elastic creep in springs 3. Differences in latitude g increases towards poles
Processing Method 4. Height of measurement above reference datum: Free-Air Correction = +0. 308 m. Gal/m 5. Extra mass between measurement and reference datum: Bouguer Correction = -0. 4185ρh Where ρ=density (gm/cm 3) and h = height above datum (m) 6. Effect of surrounding terrain
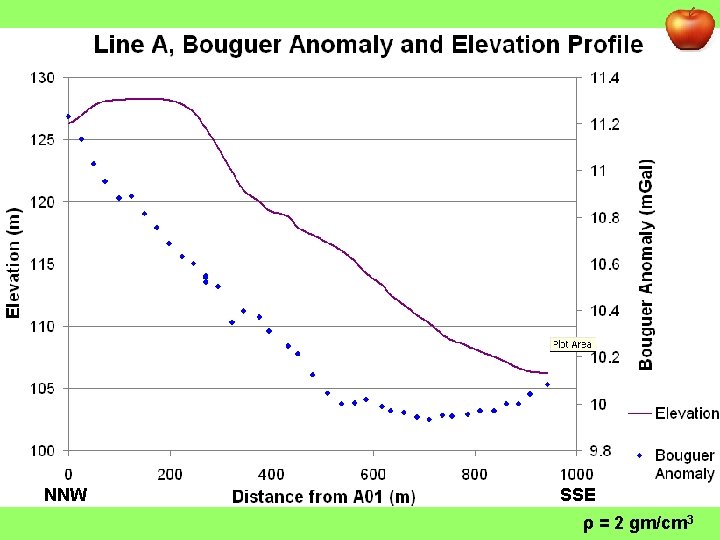
NNW SSE ρ = 2 gm/cm 3
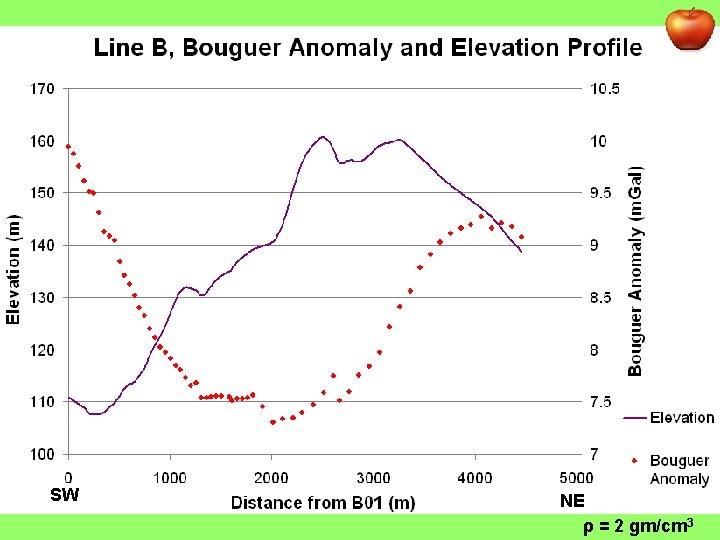
SW NE ρ = 2 gm/cm 3
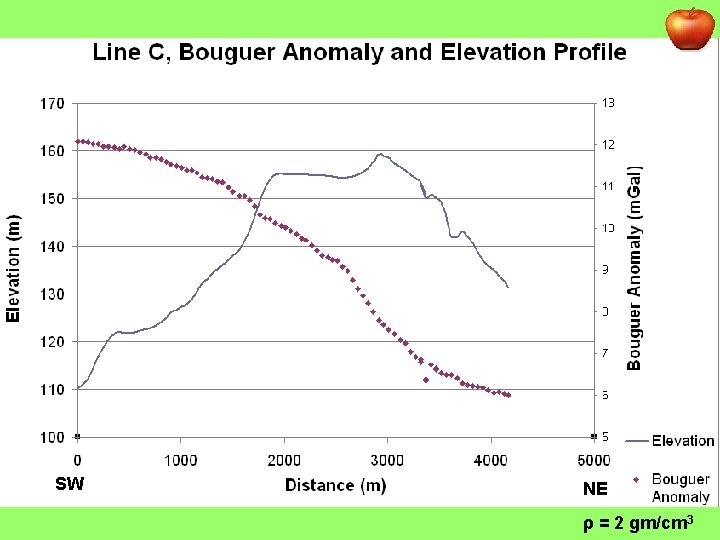
SW NE ρ = 2 gm/cm 3
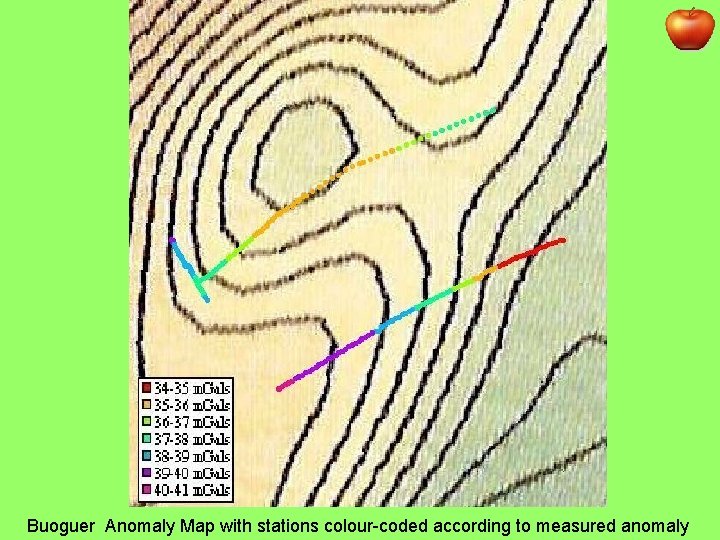
Buoguer Anomaly Map with stations colour-coded according to measured anomaly
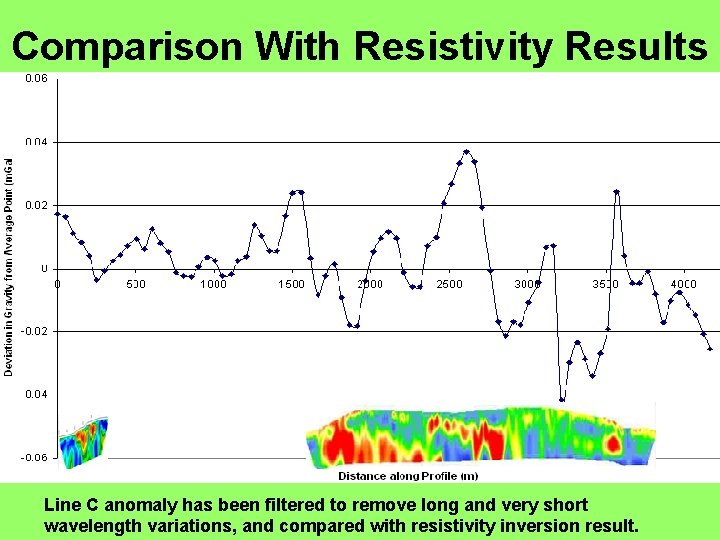
Comparison With Resistivity Results Line C anomaly has been filtered to remove long and very short wavelength variations, and compared with resistivity inversion result.
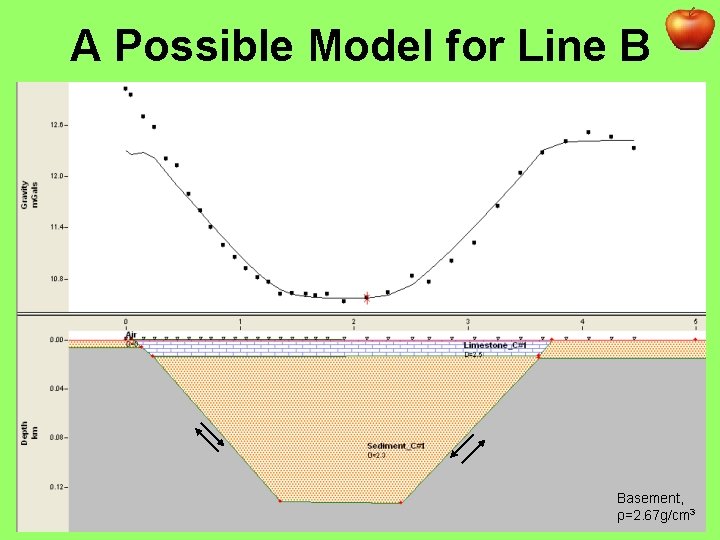
A Possible Model for Line B Basement, ρ=2. 67 g/cm 3
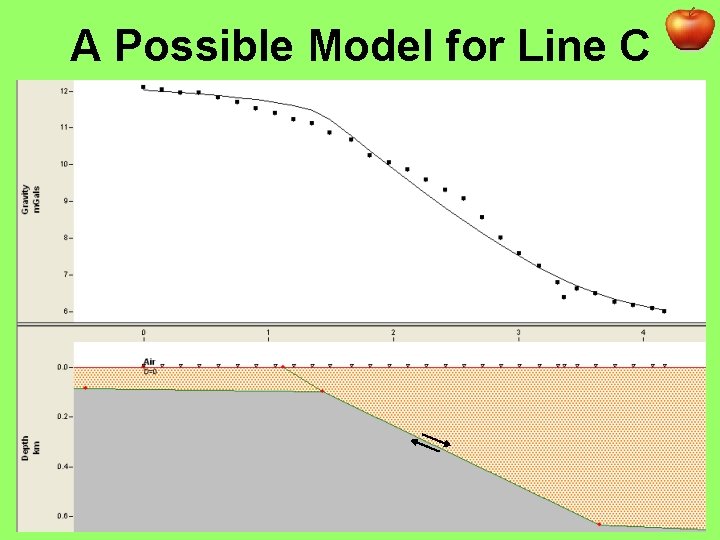
A Possible Model for Line C
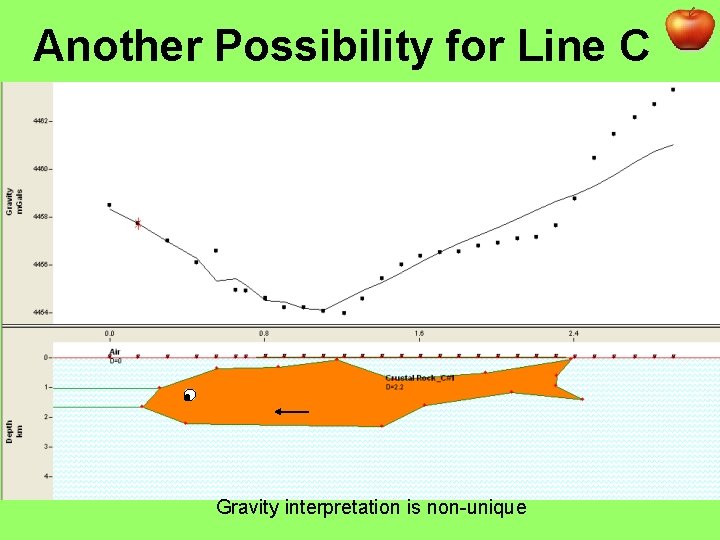
Another Possibility for Line C Gravity interpretation is non-unique
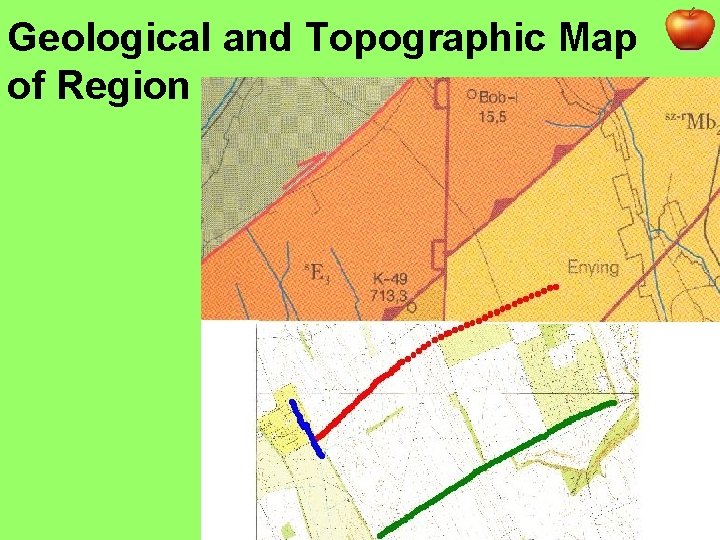
Geological and Topographic Map of Region
Summary • 3 lines: A – Oreg-Hegy, B&C – traversing Enying Ridge; • Various corrections needed to produce relative Bouguer Anomaly map; • Anomaly profiles each represent complex structures on many different scales; • There is no evidence for a tectonic origin for the Enying Ridge formation. • Acknowledgements: Res 1 and Res 2 for their results; Greg Houseman and Piroska Lorinczi for all their help.
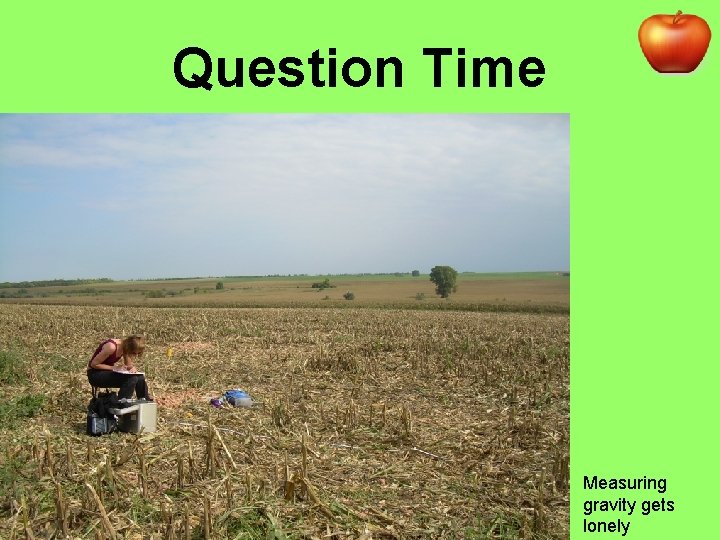
Question Time Measuring gravity gets lonely
- Slides: 18