Business Research Methods William G Zikmund Chapter 17

Business Research Methods William G. Zikmund Chapter 17: Determination of Sample Size

Copyright © 2000 by Harcourt, Inc. All rights reserved. Requests for permission to make copies of any part of the work should be mailed to the following address: Permissions Department, Harcourt, Inc. , 6277 Sea Harbor Drive, Orlando, Florida 32887 -6777.

WHAT DOES STATISTICS MEAN? • DESCRIPTIVE STATISTICS – NUMBER OF PEOPLE – TRENDS IN EMPLOYMENT – DATA • INFERENTIAL STATISTICS – MAKE AN INFERENCE ABOUT A POPULATION FROM A SAMPLE

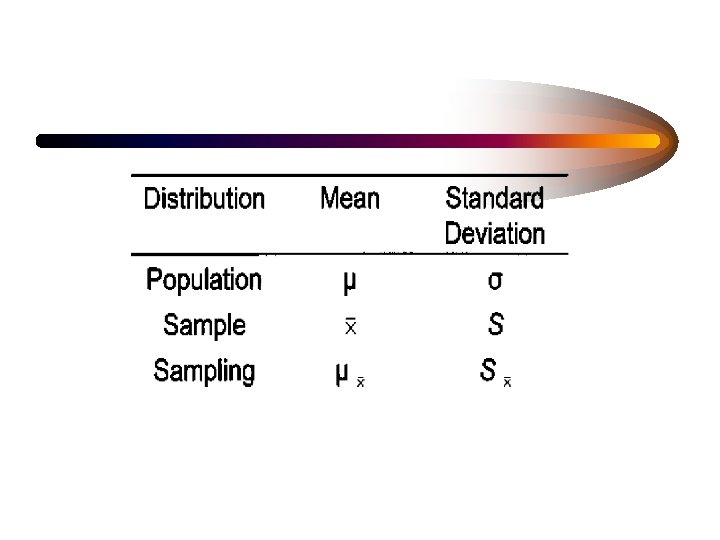
POPULATION PARAMATER • VARIABLES IN A POPULATION • MEASURED CHARACTERISTICS OF A POPULATION • GREEK LOWER-CASE LETTERS AS NOTATION

SAMPLE STATISTICS • VARIABLES IN A SAMPLE • MEASURES COMPUTED FROM SAMPLE DATA • ENGLISH LETTERS FOR NOTATION

MAKING DATA USABLE • FREQUENCY DISTRIBUTIONS • PROPORTIONS • CENTRAL TENDENCY – MEAN – MEDIAN – MODE • MEASURES OF DISPERSION

Frequency Distribution of Deposits Frequency (number of Amount less than $3, 000 - $4, 999 $5, 000 - $9, 999 $10, 000 - $14, 999 $15, 000 or more people making deposits in each range) 499 530 562 718 811 3, 120

Percentage Distribution of Amounts of Deposits Amount less than $3, 000 - $4, 999 $5, 000 - $9, 999 $10, 000 - $14, 999 $15, 000 or more Percent 16 17 18 23 26 100

Probability Distribution of Amounts of Deposits Amount less than $3, 000 - $4, 999 $5, 000 - $9, 999 $10, 000 - $14, 999 $15, 000 or more Probability. 16. 17. 18. 23. 26 1. 00

MEASURES OF CENTRAL TENDENCY • MEAN - ARITHMETIC AVERAGE – µ, population; , sample • MEDIAN - MIDPOINT OF THE DISTRIBUTION • MODE - THE VALUE THAT OCCURS MOST OFTEN

POPULATION MEAN

SAMPLE MEAN

Number of Sales Calls Per Day by Salespersons Salesperson Mike Patty Billie Bob John Frank Chuck Samantha Number of Sales calls 4 3 2 5 3 3 1 5 26

Sales for Products A and B, Both Average 200 Product A 196 198 199 200 200 201 201 202 Product B 150 160 176 181 192 200 201 202 213 224 240 261

MEASURES OF DISPERSION • THE RANGE • STANDARD DEVIATION

Measures of Dispersion or Spread • • Range Mean absolute deviation Variance Standard deviation

THE RANGE AS A MEASURE OF SPREAD • The range is the distance between the smallest and the largest value in the set. • Range = largest value – smallest value

DEVIATION SCORES • the differences between each observation value and the mean:

Low Dispersion Verses High Dispersion Frequency 5 Low Dispersion 4 3 2 1 150 160 170 180 190 Value on Variable 200 210

High dispersion Frequency 5 4 3 2 1 150 160 170 180 190 Value on Variable 200 210

AVERAGE DEVIATION

MEAN SQUARED DEVIATION

THE VARIANCE

VARIANCE

• The variance is given in squared units • The standard deviation is the square root of variance:

SAMPLE STANDARD DEVIATION

POPULATION STANDARD DEVIATION

SAMPLE STANDARD DEVIATION

SAMPLE STANDARD DEVIATION

THE NORMAL DISTRIBUTION • NORMAL CURVE • BELL-SHAPPED • ALMOST ALL OF ITS VALUES ARE WITHIN PLUS OR MINUS 3 STANDARD DEVIATIONS • I. Q. IS AN EXAMPLE

NORMAL DISTRIBUTION MEAN

Normal Distribution 13. 59% 2. 14% 34. 13% 13. 59% 2. 14%

Normal Curve: IQ Example 70 85 100 115 145

STANDARDIZED NORMAL DISTRIBUTION • SYMETRICAL ABOUT ITS MEAN • MEAN IDENFITIES HIGHEST POINT • INFINITE NUMBER OF CASES - A CONTINUOUS DISTRIBUTION • AREA UNDER CURVE HAS A PROBABLITY DENSITY = 1. 0 • MEAN OF ZERO, STANDARD DEVIATION OF 1

STANDARD NORMAL CURVE • The curve is bell-shaped or symmetrical • about 68% of the observations will fall within 1 standard deviation of the mean, • about 95% of the observations will fall within approximately 2 (1. 96) standard deviations of the mean, • almost all of the observations will fall within 3 standard deviations of the mean.

A STANDARDIZED NORMAL CURVE -2 -1 0 1 2 z

The Standardized Normal is the Distribution of Z –z +z

STANDARDIZED SCORES

Standardized Values • Used to compare an individual value to the population mean in units of the standard deviation

Linear Transformation of Any Normal Variable into a Standardized Normal Variable s s m m Sometimes the scale is stretched X Sometimes the scale is shrunk -2 -1 0 1 2

• Population Distribution • Sample Distribution • Sampling Distribution

POPULATION DISTRIBUTION -s m s x

SAMPLE DISTRIBUTION _ C S X

SAMPLING DISTRIBUTION

STANDARD ERROR OF THE MEAN • STANDARD DEVIATION OF THE SAMPLING DISTRIBUTION

STANDARD ERROR OF THE MEAN

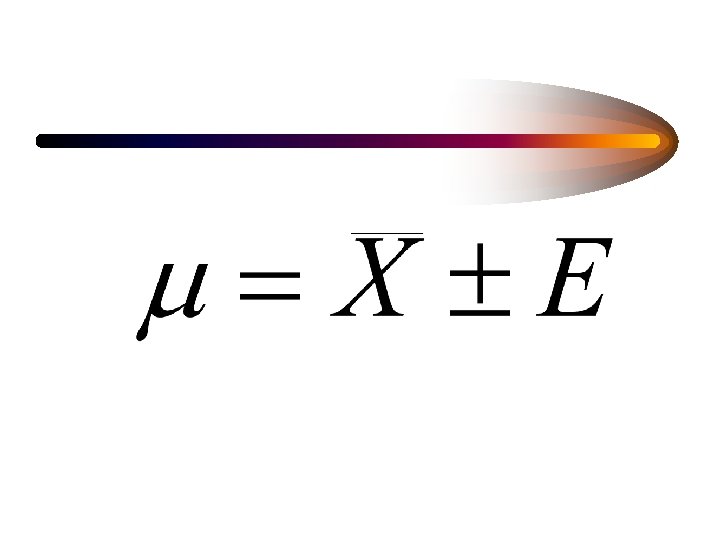
PARAMETER ESTIMATES • POINT ESTIMATES • CONFIDENCE INTERVAL ESTIMATES

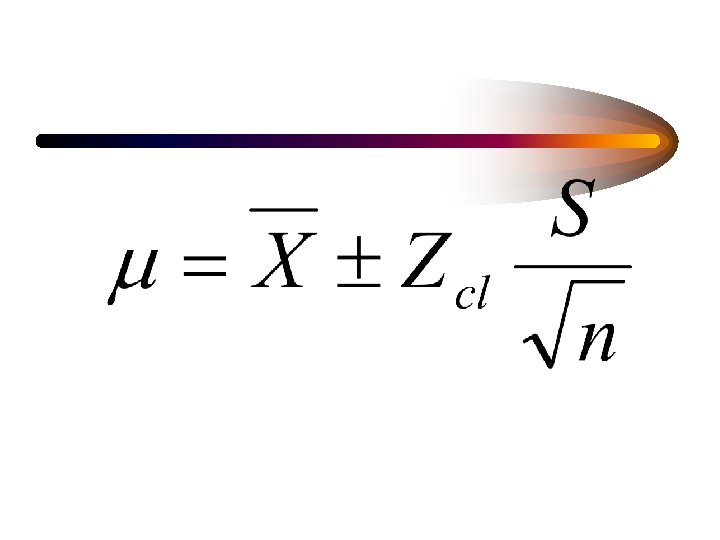
CONFIDENCE INTERVAL
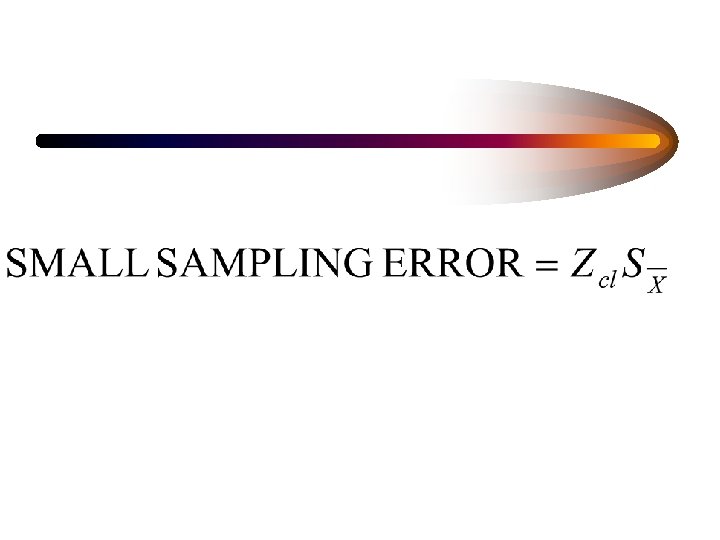

ESTIMATING THE STANDARD ERROR OF THE MEAN

RANDOM SAMPLING ERROR AND SAMPLE SIZE ARE RELATED
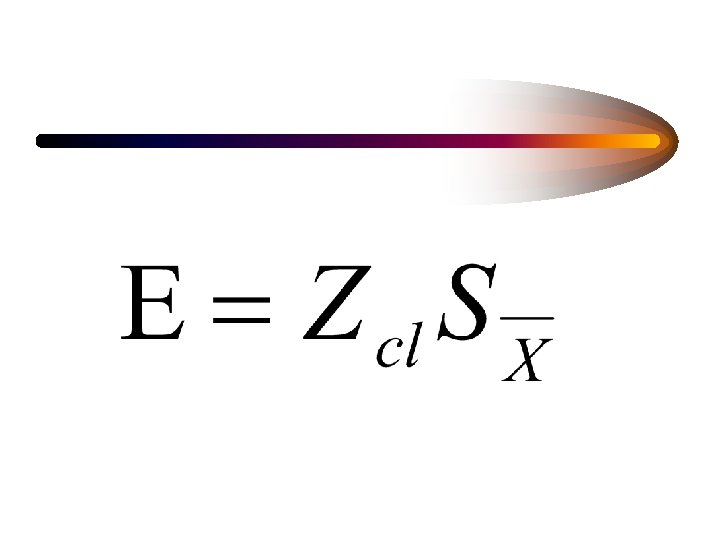
 • MAGNITUDE OF ERROR • CONFIDENCE LEVEL")
SAMPLE SIZE • VARIANCE (STANDARD DEVIATION) • MAGNITUDE OF ERROR • CONFIDENCE LEVEL

Sample Size Formula

Sample Size Formula - example Suppose a survey researcher, studying expenditures on lipstick, wishes to have a 95 percent confident level (Z) and a range of error (E) of less than $2. 00. The estimate of the standard deviation is $29. 00.

Sample Size Formula - example

Sample Size Formula - example Suppose, in the same example as the one before, the range of error (E) is acceptable at $4. 00, sample size is reduced.

Sample Size Formula - example
(29) ù n=ê ú 2 ë û é")
Calculating Sample Size 99% Confidence é(2. 57)(29) ù n=ê ú 2 ë û é 74. 53 ù =ê ú ë 2 û 2 = [37. 265] = 1389 2 2 é(2. 57)(29) ù n=ê ú 4 ë û é 74. 53 ù =ê ú ë 4 û 2 = [18. 6325] = 347 2 Copyright © 2000 by Harcourt, Inc. All rights reserved. 2

STANDARD ERROR OF THE PROPORTION

CONFIDENCE INTERVAL FOR A PROPORTION

SAMPLE SIZE FOR A PROPORTION

The Sample Size Formula for a Proportion z 2 pq n= 2 E Where n = Number of items in samples Z 2 = The square of the confidence interval in standard error units. p = Estimated proportion of success q = (1 -p) or estimated the proportion of failures E 2 = The square of the maximum allowance for error between the true proportion and sample proportion or zsp squared.

Calculating Sample Size at the 95% Confidence Level p =. 6 q =. 4 (1. 96 )2(. 6)(. 4 ) n= (. 035 )2 (3. 8416)(. 24) 001225. 922 =. 001225 = 753 =
- Slides: 67