Business Process Management BPM cont Process Modelling Quality
 – cont.")
Business Process Management (BPM) – cont.

Process Modelling Quality n Most process analysis and design efforts require the use of models to describe what is happening during the process n Useful to have some standards and measures of quality as it relates to process modeling n Quality of model defined by its accuracy, amount of detail and completeness

Requirements of a Process Model n n Business environment Organisational structure Business rules Process structure

Model Validation and Simulation n Useful or necessary to validate the model through simulation n Validate the model through simulation is to compare simulated outputs to real-world results

Modelling Perspectives n Processes can be modelled from many perspectives n All perspectives are maintained in a process repository

Modelling Approaches n n n Bottom-up Top-down Middle-out

Capturing Information for Process Modelling n n n Direct Observation Interviews Survey/Written Feedback Structured Workshops Web-Based Conferencing

Modelling Participants n n n n n Business strategists Business managers Financial analysts Auditors Compliance analysts Process performance analysts Requirements analysts Systems analysts Business analysts

Modelling Techniques and Tools n n White Boarding and Flip Charts Paper and Post-Its Drawing Tools and Reports (e. g. Visio, Power. Point) Electronic Modelling and Projection: q Repository-based tools allow the reuse of objects or patterns that have already been defined in previous efforts

Process Simulation n Form of models which provide valuable insight to process dynamics n Simulations require sufficient data which typically allows the process to be mathematically simulated under various scenarios, loads, etc. n Simulations can be manual or electronic using process simulation tools n Various benefits

3. Process Analysis

Process Analysis

Purpose of Process Analysis n Process analysis is an essential tool to show well the business is meeting its objectives n Due to business change the processes of an organisation can quickly become inconsistent to their original design and no longer meet the needs of the business n Analysis generates an understanding and measurement of process effectiveness and its efficiency n Information generated from analysis includes: q Strategy, culture and environment of the organisation that uses the process (why the process exists) q Inputs and outputs of the process q Stakeholders, both internal and external, including suppliers, customers and their needs and expectations q Inefficiencies within the current process q Scalability of the process to meet customer demands q Business rules that control the process and why they must exist q What performance metrics should monitor the process, who is interested in those metrics and what they mean q What activities make up the process and their dependencies across departments and business functions q Improved resource utilisation q Opportunities to reduce constraints and increase capacity

When to Perform Process Analysis n Can be the result of continuous monitoring of processes or can be triggered by specific events, such as: q q q Strategic Planning Performance Issues New Technologies Startup Venture Merger/Acquisition Regulatory Requirements

Process Analysis Roles n n Performed by a single individual or by a cross-functional team Analyst q Decide the depth and scope of the analysis q How it is analysed q Perform the analysis q Provide documentation and final reports to the stakeholders and executive leadership Facilitator q Lead process analysis teams with an unbiased view Subject Matter Experts q Individuals closest to the process with knowledge and expertise q Familiar with both the business and technical infrastructure that supports the process

Preparing the Analysis n Choose process the n Determine the scope of the depth of analysis n Choose analytical frameworks

Performing the Analysis

4. Process Design

Process Design
 n n n Design around customer interactions Design around value-adding")
Process Design Principles (1) n n n Design around customer interactions Design around value-adding activities Minimise/ automate handoffs Work is performed where it makes the most sense Provide a single point of contact Ensure a continuous flow Reduce batch size: batching causes wait time for items at the end of the batch Capture information once at the source and share it: eliminate data redundancy Involve as few as possible Redesign, then automate Ensure quality at the beginning
 n n Standardise processes: when there is no standardisation there")
Process Design Principles (2) n n Standardise processes: when there is no standardisation there cannot be process control Use co-located or networked teams for complex issues q q n Consider outsourcing business processes q n n If complex problems occur regularly, consider co-locating team members If co-location does not make sense, then network the team so information can smoothly flow Compare to the costs of designing the process in-house as well as compared to the risks associated with outsourcing Process Compliance Process Design Considerations

5. Process Performance Measurement

Process Performance Measurement

Business Process Action Hierarchy

Process Hierarchy Example

n Key Process Performance Definitions All processes have a metric or measurement associated with the work or output of the process that is performed n Metrics are based on the following fundamental metric dimensions: time, cost, capacity, quality n When a process is value-added? q When it is required to generate the output required by the customer of the process q When the customer is willing to pay for the process q When it enhances customer experience
")
Key Performance Indicators (KPIs)

Examples of KPIs

Measurement Methods n Several common measurement methodologies used in BPM implementations q q q Value Stream Mapping Activity Based Costing (ABC) Statistical Methods

6. Process Transformation

Process Transformation

BPM Improvement Methodologies n An approach with principles, procedures and practices that provide guidelines for designing and executing the different components within BPM
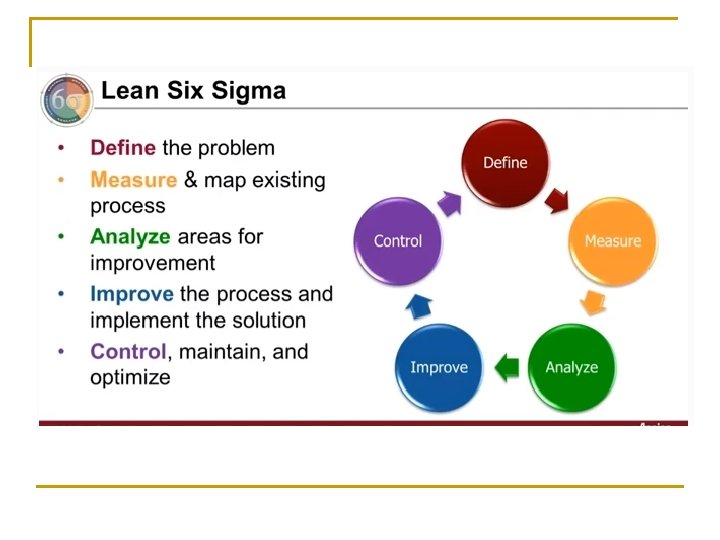

Other Methodologies n n n Lean: q originated by Toyota q Focus on reduction of process wastes TQM (Total Quality Management) q focus on process measurement and controls as a megans of continuous improvement q statistical analysis Performance Improvement Model q developed in the early 1990 s q framework aligns processes at three distinct three levels of performance: organisational, process and job/ performer Redesign q although it may lead to significant changes, these changes continue to be based on the fundamental concepts of the existing process Reengineering q Mike Hammer’s 1993 book Reengineering the Corporation q radical change of process

7. Process Implementation

Process Implementation

Activity Specification n Each implementation activity specification should include: q q q Objectives, performance metrics and list of deliverables—all related to delivering improved customer value Risks for completion and how to be minimised Accountability for completion Financial, personnel, any IT support and other resources required Length of time for completion Any implementation task cross-functional interdependencies

Orchestrating Change

8. Process Quality

Are these all of the same quality? Do they cost the same?

What is good quality? n Please list 3 characteristics of a good quality car.

What about these?

What is a “good quality” mobile phone? n List 3 characteristics of a good quality phone. n How about the characteristics of a process to make a phone?
 : q the degree to")
Definition of Quality n n IEEE (IEEE_Std_610. 12 -1990) : q the degree to which a system, component, or process meets specified requirements/ customer or user needs or expectations Fault (according to ISO/CD 10303 -226): q n Failure: q n “an abnormal condition or defect at the component, equipment, or sub-system level which may lead to a failure” the state or condition of not meeting a desirable or intended objective Defect: q see fault
 n n RCA is used to find the root causes")
Root Cause Analysis (RCA) n n RCA is used to find the root causes of defects – what is the cause of the failure RCA can be done using a number of methods: q q q q Barrier analysis Causal factor tree analysis Change analysis Failure mode and effects analysis Fault tree analysis 5 Whys Ishikawa diagram Pareto analysis

5 Whys: Example n Problem Statement: You are on your way home from work and your car stops in the middle of the road. 1. Why did your car stop? - Because it ran out of gas. 2. Why did it run out of gas? - Because I didn't buy any gas on my way to work. 3. Why didn't you buy any gas this morning? - Because I didn't have any money. 4. Why didn't you have any money? - Because I lost it all last night in a poker game. 5. Why did you lose your money in last night's poker game? - Because I'm not very good at "bluffing" when I don't have a good hand.

Ishikawa Diagram: Principles n n Causes are grouped into categories and linked together (primary and secondary causes) The list of categories is not definite, the figure shows the “typical” • Relationships are used to backtrack the cause of a particular problem. • The analysis requires more effort than 5 whys but still no statistics is necessary.

Example

Exercise n Imagine the following situation: You are a quality manager in a software development project in a new version of the Hyunday i 30 car. A new version of the software for the ABS (Anti-Block System) brakes has been delivered and it does not work. Please draw the Ishikawa diagram that would help you do Root Cause Analysis.

Pareto Analysis: Principles n Pareto analysis is based on the assumption that 20% of the units contributes with 80% of the effect, e. g. : q q n 20% of the modules contain 80% of errors 80% of failures are caused by 20% of the defects The basis of Pareto Analysis is Pareto diagram

Pareto Diagram: Example

Absence of defects = good quality? n n n What is a quality process? How would you recognize a quality process in a restaurant? How about software development?
 RUP is a quality process… Well defined phases Well defined")
Rational Unified Process (RUP) RUP is a quality process… Well defined phases Well defined activites Well defined tasks Well defined deliverables Templates Team support Tool support …
 n is a detailed process description for small teams, containing:")
Team Software Process (TSP) n is a detailed process description for small teams, containing: q q q n details of activities QA … Organizations implementing TSP announced: q q q productivity improvements of 25% or more reductions in cost and schedule variance to less than +/- 10% testing costs and schedule reductions of up to 80%
 n CMMI can be used to guide process improvement")
Capability Maturity Model Integration (CMMI) n CMMI can be used to guide process improvement across a project, a division, or an entire organization n Processes are rated according to their maturity levels n CMMI best practices are published in documents called models, each of which addresses a different area of interest: development, acquisition, services n Capability Maturity Model describes how good an organization is in its processes n Starts from unpredictable and reactive (ad-hoc) processes n Ends with processes focused on the continuous improvement n http: //www. sei. cmu. edu/cmmi/

CMM Levels
 n Each maturity level has some associated KPAs n KPAs")
Key Process Area (KPA) n Each maturity level has some associated KPAs n KPAs are from 4 categories: project management, process management, engineering, support n The relationship is: q Maturity level => KPA q Not vice versa!!! • The assumption is that the more advanced the organization is => the more mature its processes are => the more difficult KPAs it implements

CMMI’s relationship to quality n Level 1 “expects” the following process areas q q n Level 2 “expects” the following process areas q q n Quality assurance (PPQA) Measurement and analysis Verification Validation Level 3 “expects” q Automation, processes including automated measurement

PPQA’s main specific goals related to QA n SG 1: Objectively Evaluate Processes and Work Products q q n SP 1. 1: Objectively Evaluate processes SP 1. 2: Objectively evaluate work products and services SG 2: Provide objective insight q q SP 2. 1: Communicate and Ensure Resolution of Noncompliance issues SP 2. 2: Establish records

Objectivity: Examples n Examples of measurement data q q q n Estimated/planned vs. actual data on software size, cost, and schedule Productivity data Coverage and efficiency of peer reviews Organization’s measurement program includes q q Definition of the organization-wide measurements Collection of the organization’s measurement data Analysis of the organization’s measurement data Quantitative measurement goals for the organization

CMMI Assessment n n Checking the CMMI level is done ‘manually’ during an assessment q Has to be done by an accredited auditor q Is supported by methods like SCAMPI (Standard CMMI Appraisal Method for Process Improvement) Capability vs. maturity – continuous representation vs. staged one

Practical considerations about CMMI n n CMMI is a comparison framework and a descriptive maturity level framework q If you want to improve your organization, CMMI does not tell you HOW to do it q CMMI describes areas which the organizations should consider CMMI level 5 does NOT guarantee that the software will be free of errors q The projects might be on budget, requirements correct, testing correct, but… n n n … one needs to know the “Garbage in – garbage out” principle CMMI is very good and well-known, but not the only framework like this CMMI is very high level q If an organization wants to focus on a specific area, say QM, then CMMI is not very helpful

Process Management Maturity There are several Process Management Maturity Models Levels n n Process Maturity Models define levels of awareness for business process best practices and automation with some assessing the management of operational processes

SPICE n • SPICE is a major international initiative to support the development of an International Standard for Software Process Assessment http: //www. sqi. gu. edu. au/spice/what. html

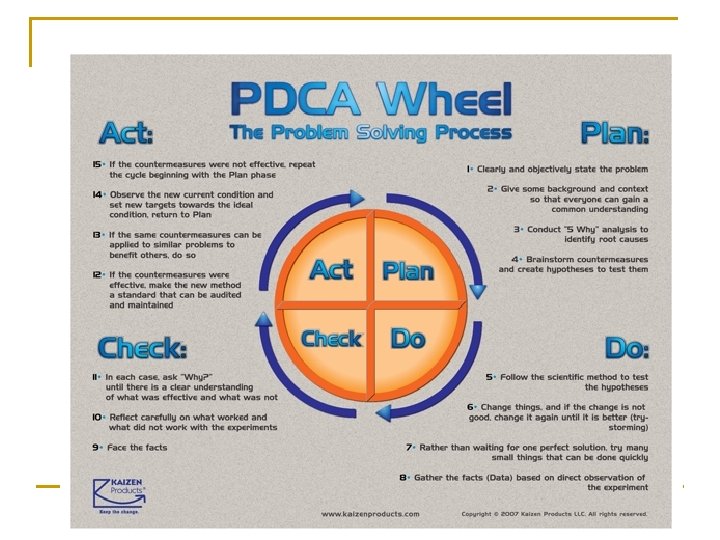
Deming’s PDCA: Plan-Do-Check. Act • Iterative problem solving process used for process improvement

How to improve processes? n Rational Unified Process has its own improvement framework: q n http: //www-01. ibm. com/software/rational/mcif/ Deming’s PDCA: Plan-Do-Check-Act: q iterative problem solving process

Measures of Software Process Quality: Example n Fault-Slip Through: q this measure helps to understand the efficiency of testing in each phase

Conclusions so-far… n “The quality of a product is largely determined by the quality of the process that is used to develop and maintain it. ” (Shewhart, Juran, Deming and Humphrey), but… n Once the process is of a good quality this does not mean that the product is of a good quality n No product QA -> no quality Process is not followed -> no quality n
 is")
Quality Metrics n n According to standard ISO/IEC 15939, measure (i. e. metric) is a q ”variable to which a value is assigned as the result of measurement” “Categories” of metrics: q q q n n n Simple Statistics Key performance indicators (KPI) Measurement Systems: set of metrics that present the status and/or progress of a specific area Can anything/everything be measured? Can we trust metrics/statistics?
 n an international standard that defines a measurement process for software")
ISO/IEC 15939 (1) n an international standard that defines a measurement process for software development and systems engineering: q ”This international standard identifies the activities and tasks that are necessary to successfully identify, define, select, apply and improve measurement within an overall project or organizational measurement structure. ”
")
ISO/IEC 15939 (2)

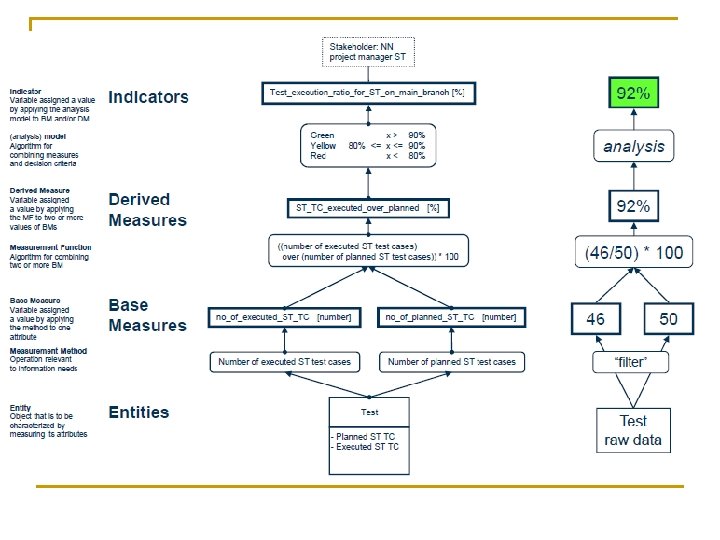
Measurement System: the Principles

Measurement System: the Conceptual Model An optimal measurement information model has to be defined!!!

Measurement Information Model n “is a structure linking information needs to the relevant entities and attributes of concern” – from Annex A (ISO/IEC 15939) n defines measurement constructs which link information needs with attributes of entities
 A framework for developing measurement systems and its industrial evaluation -")
Ericsson Example (*) A framework for developing measurement systems and its industrial evaluation - Miroslaw Staron , Wilhelm Meding, Christer Nilsson

Main Benefices of Using Measurement Systems n New means of communication: common language, based on an ISO standard n Automation (data presentation) n Reliability (assured by check-indicators) collection, analysis,

More on: “Ensuring Reliability of Information Provided by Measurement Systems” – M. Staron, W. Meding

9. Process Management Organisation

Process Management Organisation

Cross Functional Processes – Crossing “Vertical” Operational Organisational Units

Enterprise Process Management n Assures alignment of the portfolio of end-to-end business processes and process architecture with the organisation’s business strategy and resource allocation n Provides a governance model for the management and evaluation of initiatives n Involves the deliberate, collaborative and increasingly technology -aided definition, improvement, innovation and management of end-to-end business processes that drives business agility

10. Enterprise Process Management

11. Process Management Technology

n Process Management Increasing use of computer applications to assist with the analysis, Technology design, implementation, execution, management and monitoring of business processes n Business Process Management Systems (BPMS) include a large number of computer applications that continue to evolve as our understanding of business processes matures and requirements for handling complex issues and large volumes of information increase n All studies of successful BPM programs have found that BPM Systems are important and necessary components of any BPM effort n BPM technology can encompass some or all of BPM lifecycle: modelling and design, simulation, implementation - publish designed processes to controlling platform, management and control

Software Components Supporting BPM Activities

Free BPM Software n n n ADONIS ARIS Express Bonita. Soft Biz. Agi Intalio Process. Maker

Process Management Conclusions
 n Launch Voyager space craft, in order")
Examples of processes you can model (1) n Launch Voyager space craft, in order to to extend the exploration of the solar system beyond the furthest point that has ever been reached
 n Control a smart home")
Examples of processes you can model (2) n Control a smart home
 n Buy something")
Examples of processes you can model (3) n Buy something
 n Print a 3 D object with")
Examples of processes you can model (4) n Print a 3 D object with a bio-printer
 n Print a 3 D object with")
Examples of processes you can model (5) n Print a 3 D object with a bio-printer
- Slides: 96