
Business PLAN Real estate social media is here
Business PLAN Real estate social media is here… BROKER END USER BUILDER
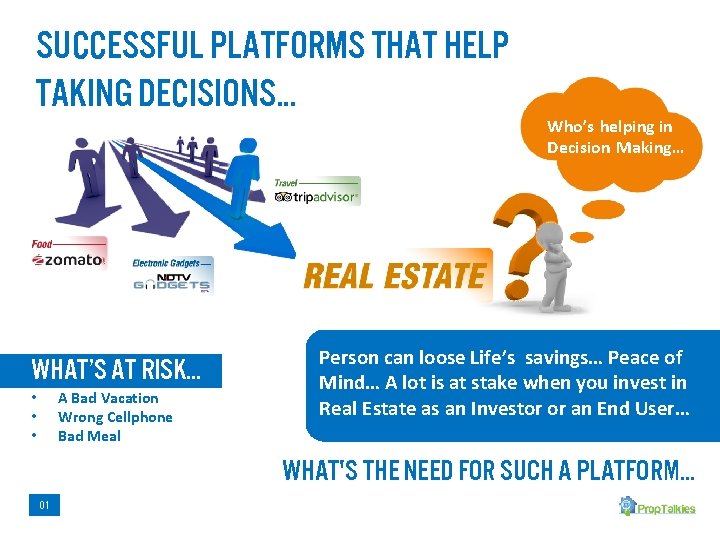
Successful Platforms that Help Taking Decisions… What’s at RISK… A Bad Vacation Wrong Cellphone Bad Meal • • • Who’s helping in Decision Making… Person can loose Life’s savings… Peace of Mind… A lot is at stake when you invest in Real Estate as an Investor or an End User… What's the need for such a Platform… 01
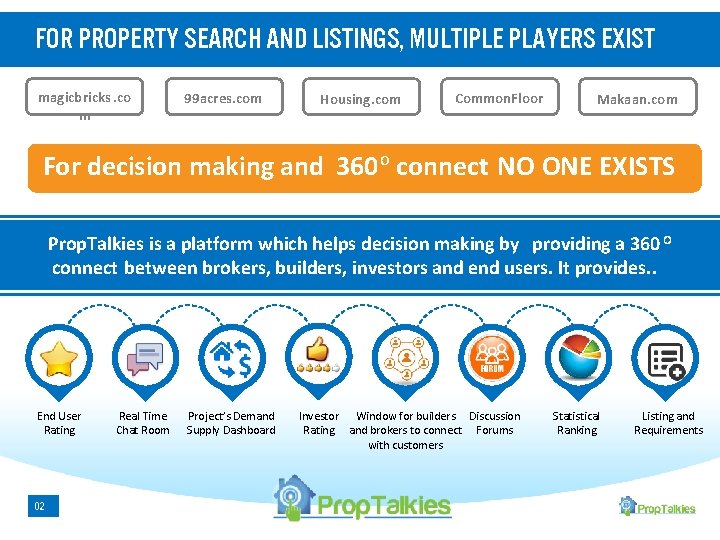
For property search and listings, multiple players exist magicbricks. co m 99 acres. com Housing. com Common. Floor Makaan. com For decision making and 360 O connect NO ONE EXISTS Prop. Talkies is a platform which helps decision making by providing a 360 O connect between brokers, builders, investors and end users. It provides. . End User Rating 02 Real Time Chat Room Project’s Demand Supply Dashboard Investor Window for builders Discussion Rating and brokers to connect Forums with customers Statistical Ranking Listing and Requirements
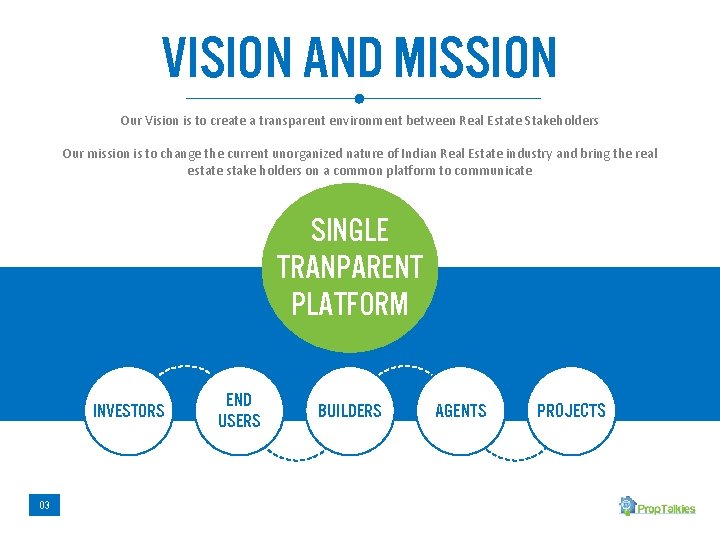
Vision and mission Our Vision is to create a transparent environment between Real Estate Stakeholders Our mission is to change the current unorganized nature of Indian Real Estate industry and bring the real estate stake holders on a common platform to communicate SINGLE TRANPARENT PLATFORM INVESTORS 03 END USERS BUILDERS AGENTS Projects
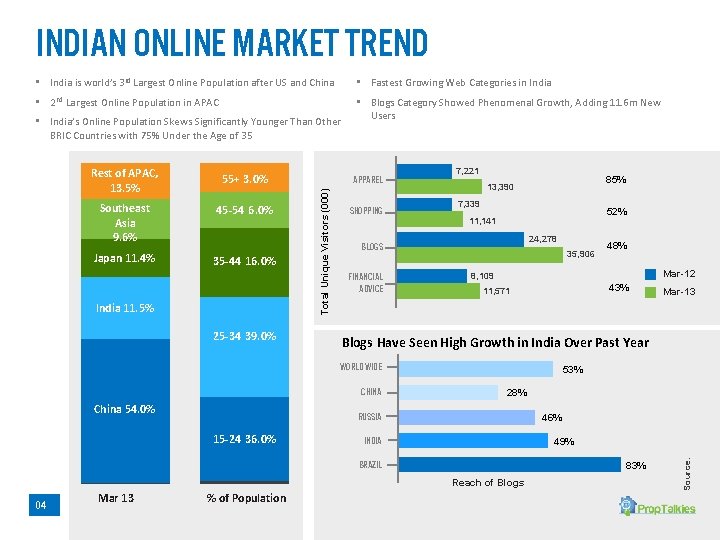
INDIAn ONLINE MARKET TREND • India is world’s 3 rd Largest Online Population after US and China • Fastest Growing Web Categories in India • 2 nd Largest Online Population in APAC • Blogs Category Showed Phenomenal Growth, Adding 11. 6 m New Users • India’s Online Population Skews Significantly Younger Than Other BRIC Countries with 75% Under the Age of 35 Southeast Asia 9. 6% 45 -54 6. 0% Japan 11. 4% 35 -44 16. 0% India 11. 5% 25 -34 39. 0% Apparel Shopping 7, 221 7, 339 52% 11, 141 24, 278 Blogs Financial Advice 85% 13, 390 35, 906 Mar-12 8, 109 43% 11, 571 China 53% 28% Russia 15 -24 36. 0% 46% India 49% Brazil 83% Reach of Blogs 04 Mar 13 % of Population Mar-13 Blogs Have Seen High Growth in India Over Past Year World Wide China 54. 0% 48% Source: 55+ 3. 0% Total Unique Visitors (000) Rest of APAC, 13. 5%
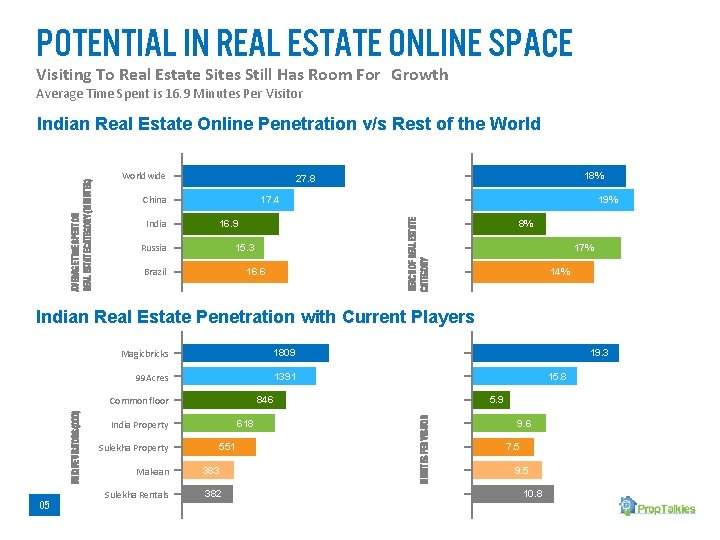
Potential In Real Estate Online Space Visiting To Real Estate Sites Still Has Room For Growth Average Time Spent is 16. 9 Minutes Per Visitor Worldwide China India 18% 27. 8 17. 4 16. 9 Russia 15. 3 Brazil 19% Reach of Real Estate Category Average Time Spent on Real Estate Category (Minutes) Indian Real Estate Online Penetration v/s Rest of the World 16. 6 8% 17% 14% Indian Real Estate Penetration with Current Players Magicbricks 1809 99 Acres 1391 618 India Property 551 Makaan 383 Sulekha Rentals 382 5. 9 Minutes Per Visitor Unique Visitors (000) 05 15. 8 846 Common floor Sulekha Property 19. 3 9. 6 7. 5 9. 5 10. 8
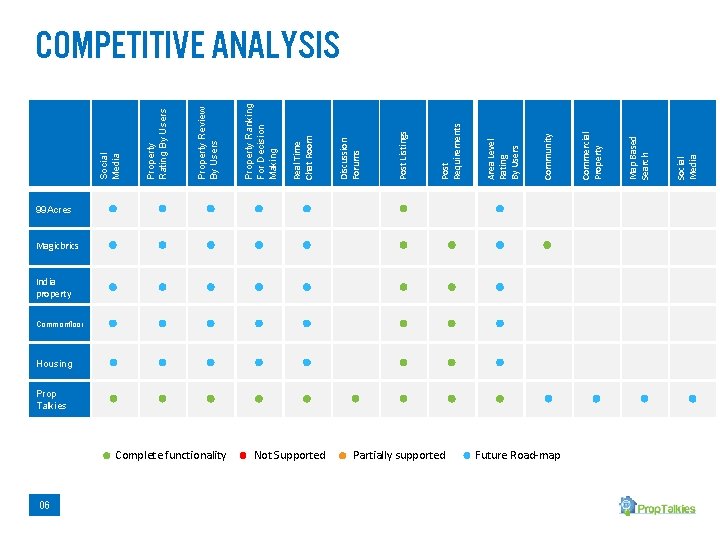
06 Complete functionality Not Supported Partially supported 99 Acres Magicbrics India property Commonfloor Housing Prop Talkies Future Road-map Social Media Map Based Search Commercial Property Community Area Level Rating By Users Post Requirements Post Listings Discussion Forums Real Time Chat Room Property Ranking For Decision Making Property Review By Users Property Rating By Users Social Media Competitive analysis
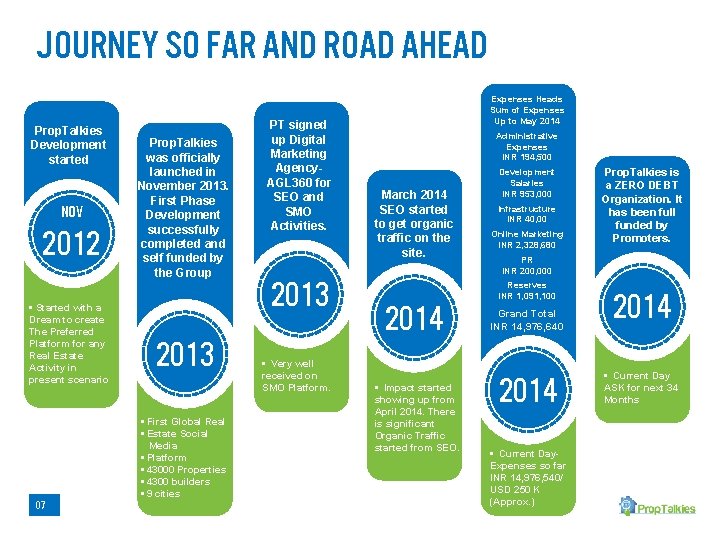
Journey so far and road ahead Prop. Talkies Development started nov 2012 • Started with a Dream to create The Preferred Platform for any Real Estate Activity in present scenario 07 Prop. Talkies was officially launched in November 2013. First Phase Development successfully completed and self funded by the Group 2013 • First Global Real • Estate Social Media • Platform • 43000 Properties • 4300 builders • 9 cities PT signed up Digital Marketing Agency. AGL 360 for SEO and SMO Activities. 2013 • Very well received on SMO Platform. Expenses Heads Sum of Expenses Up to May 2014 Administrative Expenses INR 194, 500 March 2014 SEO started to get organic traffic on the site. 2014 • Impact started showing up from April 2014. There is significant Organic Traffic started from SEO. Development Salaries INR 953, 000 Infrastructure INR 40, 00 Online Marketing INR 2, 328, 680 Prop. Talkies is a ZERO DEBT Organization. It has been full funded by Promoters. PR INR 200, 000 Reserves INR 1, 091, 100 Grand Total INR 14, 976, 640 2014 • Current Day. Expenses so far INR 14, 976, 540/ USD 250 K (Approx. ) 2014 • Current Day ASK for next 34 Months
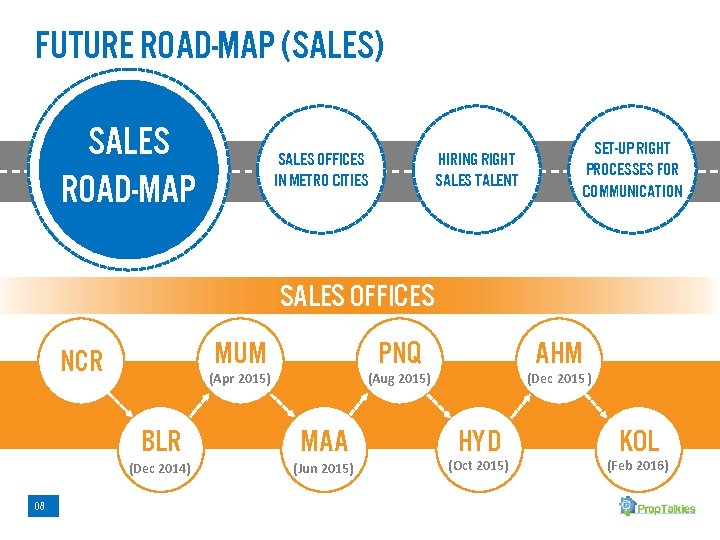
Future road-map (sales) Sales Road-Map Sales Offices In Metro Cities Hiring Right Sales Talent Set-up Right Processes For Communication Sales Offices MUM NCR 08 PNQ (Apr 2015) AHM (Aug 2015) BLR MAA (Dec 2014) (Jun 2015) (Dec 2015) HYD (Oct 2015) KOL (Feb 2016)
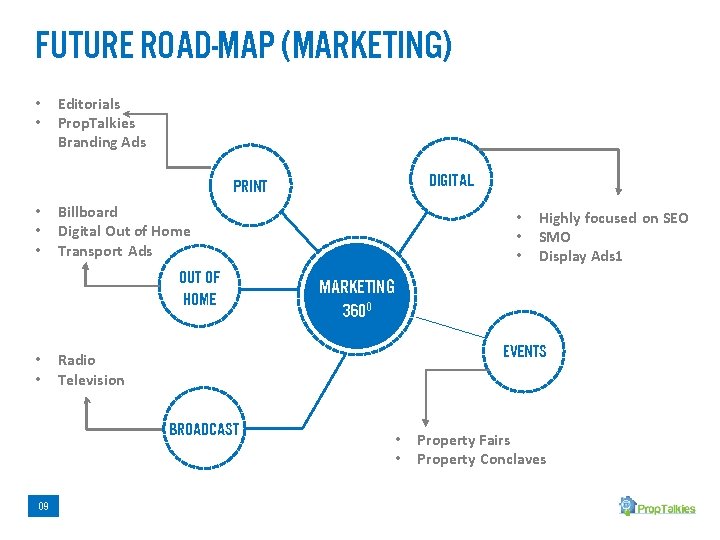
Future road-map (marketing) • • Editorials Prop. Talkies Branding Ads Digital Print • • • Billboard Digital Out of Home Transport Ads Out of Home • • Highly focused on SEO SMO Display Ads 1 Marketing 360 o Events Radio Television Broadcast 09 • • • Property Fairs Property Conclaves
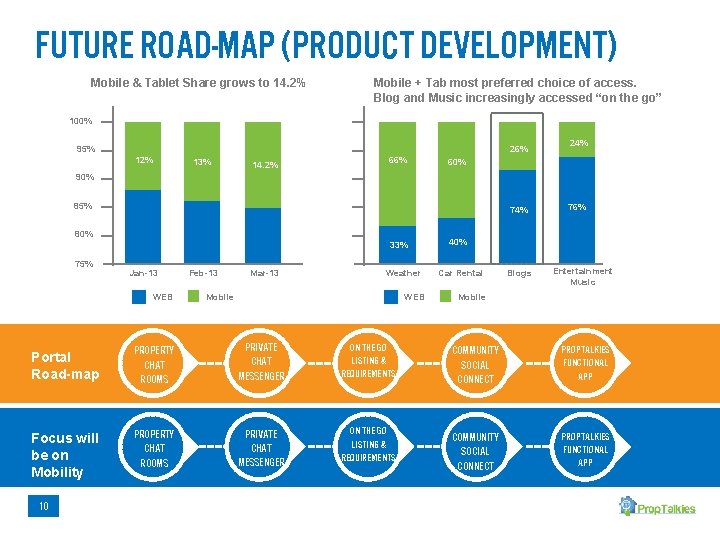
Future road-map (Product Development) Mobile & Tablet Share grows to 14. 2% Mobile + Tab most preferred choice of access. Blog and Music increasingly accessed “on the go” 100% 95% 26% 12% 13% 14. 2% 66% 24% 60% 90% 85% 74% 80% 33% 75% Jan-13 WEB Feb-13 Mar-13 Weather Mobile WEB Portal Road-map Property Chat Rooms Private Chat Messenger On The Go Listing & Requirements Focus will be on Mobility Property Chat Rooms Private Chat Messenger On The Go Listing & Requirements 10 76% 40% Car Rental Blogs Entertainment Music Mobile Community Social Connect Prop. Talkies Functional App
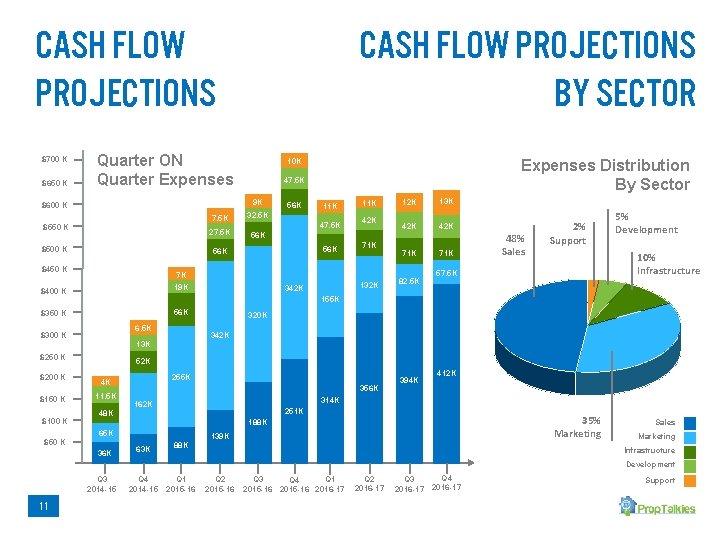
Cash Flow Projections BY sector Cash Flow Projections $700 K $650 K Quarter ON Quarter Expenses $550 K $500 K $400 K $350 K 56 K 6. 5 K 56 K 42 K 71 K 132 K 342 K 13 K 42 K 71 K 82. 5 K 71 K 48% Sales 2% Support 5% Development 10% Infrastructure 57. 5 K 320 K 342 K 13 K $250 K $50 K 27. 5 K 47. 5 K 11 K 155 K $300 K $100 K 32. 5 K 11 K 7 K 19 K $150 K 7. 5 K 56 K $450 K $200 K 47. 5 K 9 K $600 K Expenses Distribution By Sector 10 K 52 K 255 K 4 K 11. 5 K 48 K 356 K 394 K 412 K 314 K 162 K 251 K 35% Marketing 188 K 65 K 36 K 63 K 88 K 139 K Sales Marketing Infrastructure Development Q 3 2014 -15 11 Q 4 2014 -15 Q 1 2015 -16 Q 2 2015 -16 Q 3 Q 1 Q 4 2015 -16 2016 -17 Q 2 2016 -17 Q 4 Q 3 2016 -17 Support
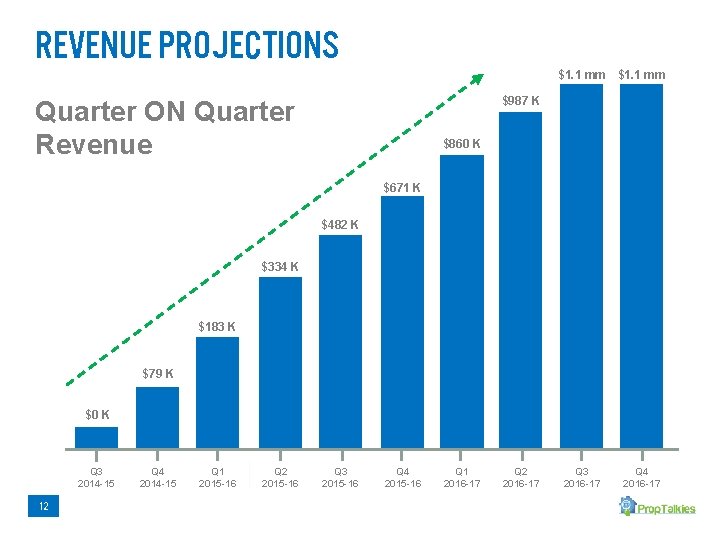
Revenue projections $1. 1 mm $987 K Quarter ON Quarter Revenue $860 K $671 K $482 K $334 K $183 K $79 K $0 K Q 3 2014 -15 12 Q 4 2014 -15 Q 1 2015 -16 Q 2 2015 -16 Q 3 2015 -16 Q 4 2015 -16 Q 1 2016 -17 Q 2 2016 -17 Q 3 2016 -17 Q 4 2016 -17
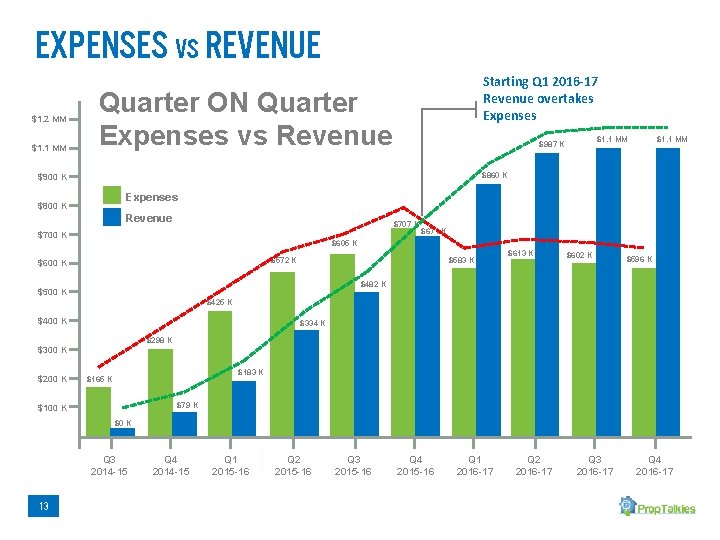
Expenses vs Revenue $1. 2 MM $1. 1 MM Starting Q 1 2016 -17 Revenue overtakes Expenses Quarter ON Quarter Expenses vs Revenue $1. 1 MM $987 K $860 K $900 K Expenses $800 K Revenue $707 K $700 K $671 K $605 K $583 K $572 K $600 K $613 K $602 K $596 K $482 K $500 K $425 K $400 K $334 K $298 K $300 K $200 K $183 K $165 K $79 K $100 K $0 K Q 3 2014 -15 13 Q 4 2014 -15 Q 1 2015 -16 Q 2 2015 -16 Q 3 2015 -16 Q 4 2015 -16 Q 1 2016 -17 Q 2 2016 -17 Q 3 2016 -17 Q 4 2016 -17
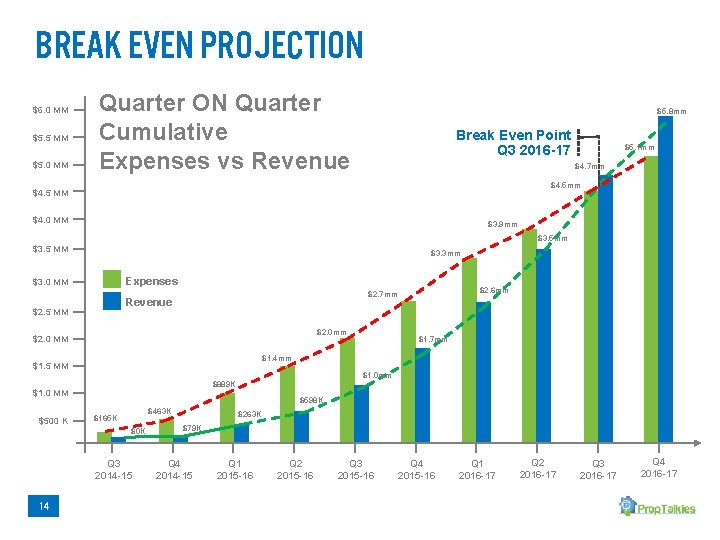
Break even projection $6. 0 MM $5. 5 MM $5. 0 MM Quarter ON Quarter Cumulative Expenses vs Revenue $5. 8 mm Break Even Point Q 3 2016 -17 $5. 1 mm $4. 7 mm $4. 5 MM $4. 0 MM $3. 9 mm $3. 5 MM $3. 3 mm Expenses $3. 0 MM $2. 5 MM $2. 0 mm $2. 0 MM $1. 0 mm $889 K $1. 0 MM $598 K $463 K $165 K $0 K Q 3 2014 -15 14 $1. 7 mm $1. 4 mm $1. 5 MM $500 K $2. 6 mm $2. 7 mm Revenue $263 K $79 K Q 4 2014 -15 Q 1 2015 -16 Q 2 2015 -16 Q 3 2015 -16 Q 4 2015 -16 Q 1 2016 -17 Q 2 2016 -17 Q 3 2016 -17 Q 4 2016 -17
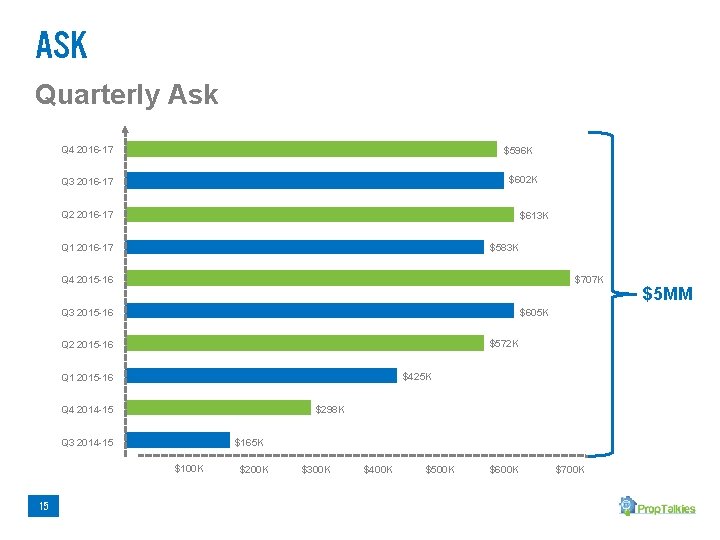
Ask Quarterly Ask Q 4 2016 -17 $596 K $602 K Q 3 2016 -17 Q 2 2016 -17 $613 K Q 1 2016 -17 $583 K $707 K Q 4 2015 -16 Q 3 2015 -16 $605 K $572 K Q 2 2015 -16 $425 K Q 1 2015 -16 $298 K Q 4 2014 -15 $165 K Q 3 2014 -15 $100 K 15 $200 K $300 K $400 K $500 K $600 K $700 K $5 MM
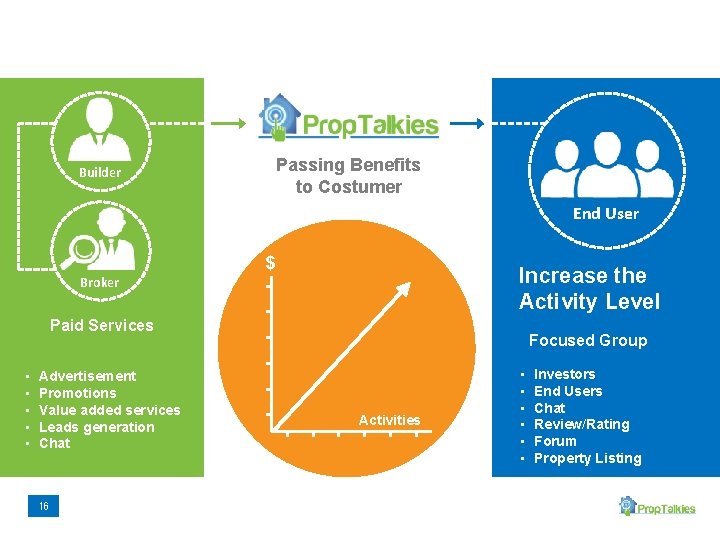
Passing Benefits to Costumer Builder End User $ Increase the Activity Level Broker Paid Services • • • Advertisement Promotions Value added services Leads generation Chat 16 Focused Group Activities • • • Investors End Users Chat Review/Rating Forum Property Listing
THANKYOU Thanks for your valuable time
- Slides: 18