Business Mathematics MTH367 Lecture 5 Chapter 4 Mathematical

Business Mathematics MTH-367 Lecture 5

Chapter 4 Mathematical functions Cont’d

Review • • Functions Domain and Range of a function Multivariate functions Types of functions

Today’s topics • • Graphical representation of functions Vertical line test Characteristics of linear function Applications of linear functions as a Cost, Revenue and Profit function
 can")
Graphical Representation of Functions • The function of one or two variables (independent) can be represented graphically. • The functions of one independent variable are graphed in two dimensions, 2 -space. • The functions in two independent variables are graphed in three dimension, 3 -space. • For the case of more than two independent variables, graphical representation is lost.

Method of graphing •

Examples • Linear functions

Examples • Quadratic functions

Examples • Cubic functions

Vertical Line Test By definition of a function, to each element in the domain there should correspond only one element in the range. This allows a simple graphical check to determine whether a graph represents a function or not. • If a vertical line is drawn through any value in the domain, it will intersect the graph of the function at one point only. • If the vertical line intersects at more than one point then, the graph depicts a relation and not a function.

Examples • Determine whether the given graph represents a function or not?

Example Cont’d

Chapter 5 Linear functions, Applications

Objectives • Present a discussion of the characteristics of linear functions • Present a wide variety of applications of linear functions

Linear function •

Example •
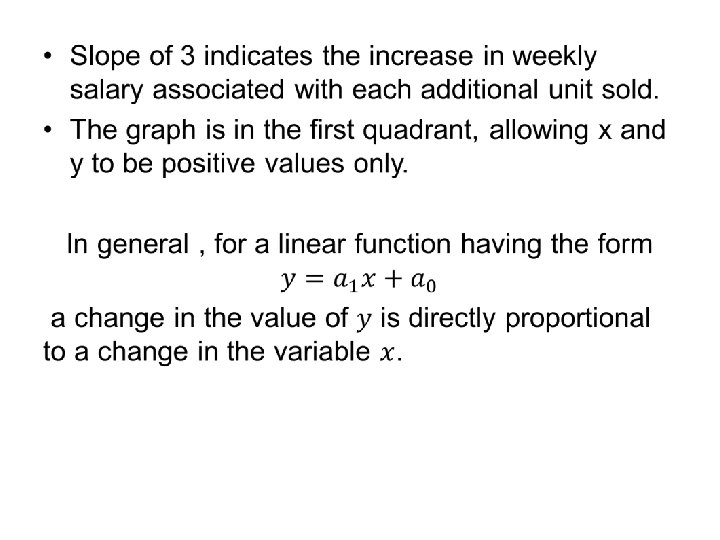

Linear function in two independent variables •
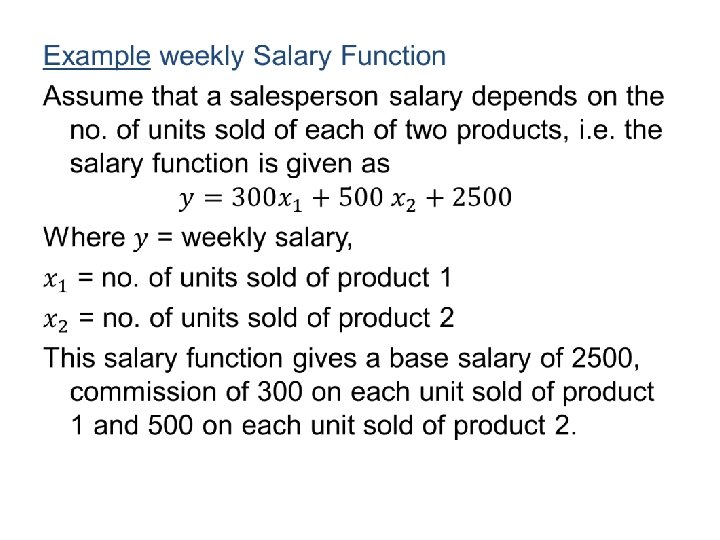

Linear function in n-independent variables

Linear cost function Cost: The organizations are concerned with the costs as they reflect the money flowing out of the organisation. The total cost usually consists on two components: total variable cost and total fixed cost. These two components determines the total cost of the organisation.
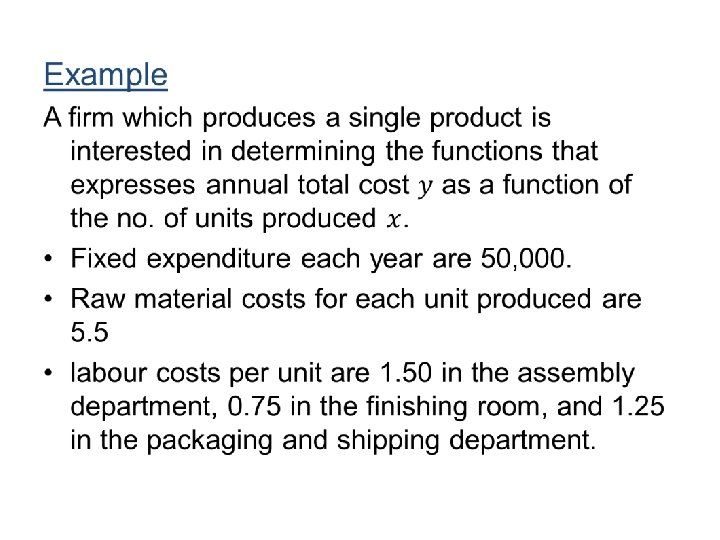

Solution: The total cost function will be in the form: =total variable cost + total fixed cost Total fixed cost = 50, 000 Total variable cost = total raw material cost + total labour cost

Linear Revenue function •

Linear Profit function •

Linear Profit function • If total revenue exceeds total cost the profit is positive • In such case, profit is referred as net gain or net profit • On the other hand the negative profit is referred to as a net loss or net deficit.

Example •

Example Cont’d

Review • • Graphical representation of functions Vertical line test Characteristics of linear function Applications of linear functions as a Cost, Revenue and Profit function

Next Lecture • • • Linear Depreciation Linear demand functions Linear supply functions Market equilibrium Break-even models Graphical analysis
- Slides: 30