
Business in strict confidence COVID19 Economic Brief Assessing

Business in strict confidence COVID-19: Economic Brief Assessing implications for economies, sectors and markets 7 August 2020 Grant Colquhoun, Marie-Louise Deshaires and Roxane Osuna
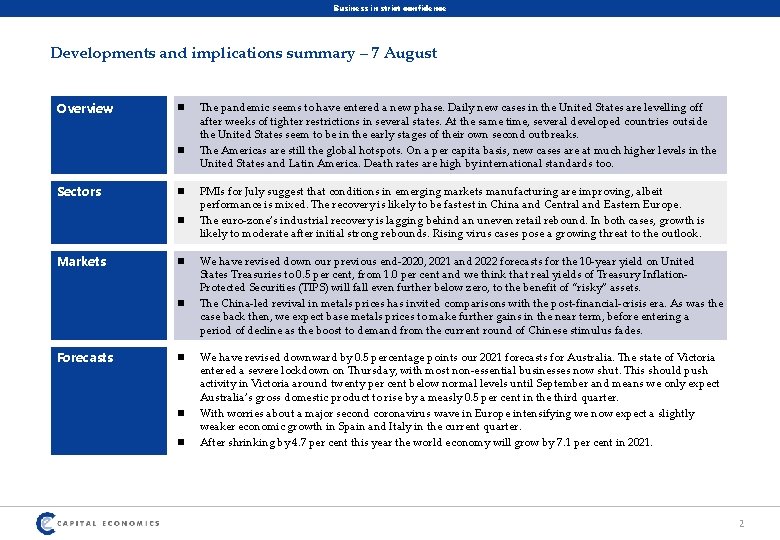
Business in strict confidence Developments and implications summary – 7 August Overview n n Sectors n n Markets n n Forecasts n n n The pandemic seems to have entered a new phase. Daily new cases in the United States are levelling off after weeks of tighter restrictions in several states. At the same time, several developed countries outside the United States seem to be in the early stages of their own second outbreaks. The Americas are still the global hotspots. On a per capita basis, new cases are at much higher levels in the United States and Latin America. Death rates are high by international standards too. PMIs for July suggest that conditions in emerging markets manufacturing are improving, albeit performance is mixed. The recovery is likely to be fastest in China and Central and Eastern Europe. The euro-zone’s industrial recovery is lagging behind an uneven retail rebound. In both cases, growth is likely to moderate after initial strong rebounds. Rising virus cases pose a growing threat to the outlook. We have revised down our previous end-2020, 2021 and 2022 forecasts for the 10 -year yield on United States Treasuries to 0. 5 per cent, from 1. 0 per cent and we think that real yields of Treasury Inflation. Protected Securities (TIPS) will fall even further below zero, to the benefit of “risky” assets. The China-led revival in metals prices has invited comparisons with the post-financial-crisis era. As was the case back then, we expect base metals prices to make further gains in the near term, before entering a period of decline as the boost to demand from the current round of Chinese stimulus fades. We have revised downward by 0. 5 percentage points our 2021 forecasts for Australia. The state of Victoria entered a severe lockdown on Thursday, with most non-essential businesses now shut. This should push activity in Victoria around twenty per cent below normal levels until September and means we only expect Australia’s gross domestic product to rise by a measly 0. 5 per cent in the third quarter. With worries about a major second coronavirus wave in Europe intensifying we now expect a slightly weaker economic growth in Spain and Italy in the current quarter. After shrinking by 4. 7 per cent this year the world economy will grow by 7. 1 per cent in 2021. 2
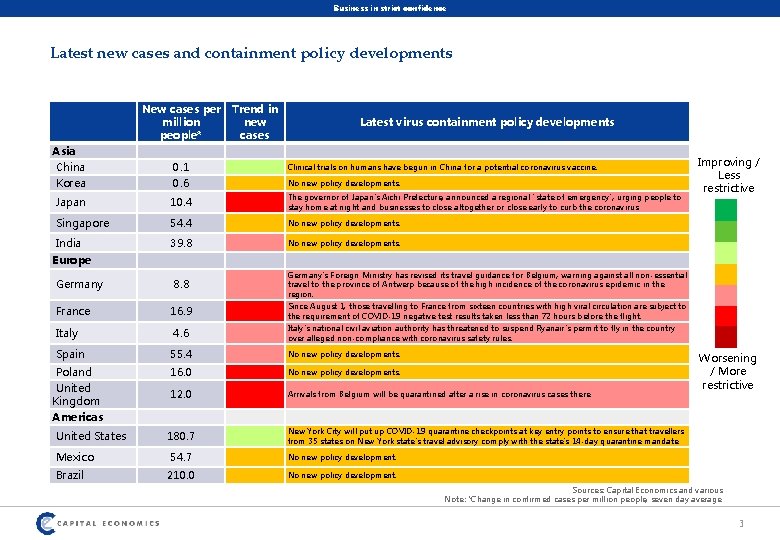
Business in strict confidence Latest new cases and containment policy developments New cases per million people* Trend in new cases Latest virus containment policy developments Asia China Korea 0. 1 0. 6 Japan 10. 4 The governor of Japan's Aichi Prefecture, announced a regional "state of emergency", urging people to stay home at night and businesses to close altogether or close early to curb the coronavirus. Singapore 54. 4 No new policy developments. India 39. 8 No new policy developments. Clinical trials on humans have begun in China for a potential coronavirus vaccine. No new policy developments. Improving / Less restrictive Europe Germany 8. 8 Germany's Foreign Ministry has revised its travel guidance for Belgium, warning against all non-essential travel to the province of Antwerp because of the high incidence of the coronavirus epidemic in the region. France 16. 9 Since August 1, those travelling to France from sixteen countries with high viral circulation are subject to the requirement of COVID-19 negative test results taken less than 72 hours before the flight. Italy 4. 6 Spain 55. 4 No new policy developments. Poland United Kingdom Americas 16. 0 No new policy developments. 12. 0 Arrivals from Belgium will be quarantined after a rise in coronavirus cases there. United States 180. 7 Mexico 54. 7 No new policy development. Brazil 210. 0 No new policy development. Italy's national civil aviation authority has threatened to suspend Ryanair's permit to fly in the country over alleged non-compliance with coronavirus safety rules. Worsening / More restrictive New York City will put up COVID-19 quarantine checkpoints at key entry points to ensure that travellers from 35 states on New York state's travel advisory comply with the state's 14 -day quarantine mandate. Sources: Capital Economics and various Note: *Change in confirmed cases per million people, seven day average. 3
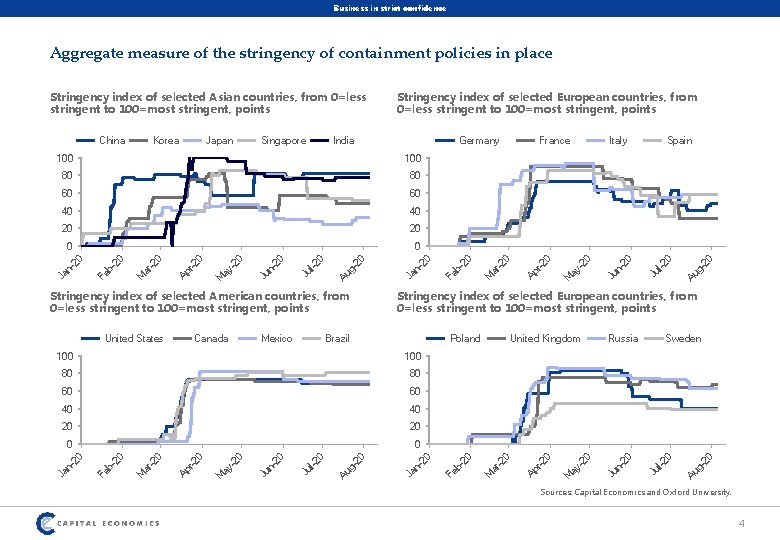
Business in strict confidence Aggregate measure of the stringency of containment policies in place Au g 20 l-2 0 Ju 20 n. Ju 0 -2 ay M Spain g 20 Au l-2 0 Sweden Ju 20 n- 0 Russia Ju n. Ja Au Ju n. Ju 0 -2 ay M r-2 Ap M ar b. Fe n- -2 0 ay 0 M 20 20 20 g 20 40 l-2 0 40 20 60 -2 0 80 20 100 United Kingdom 0 Poland 100 Ja r-2 n- Brazil r-2 Mexico Ap Canada Italy Stringency index of selected European countries, from 0=less stringent to 100=most stringent, points -2 0 United States Ja Au Ju n. Ju 0 -2 M ay r-2 Ap M ar b. Fe n. Ja Stringency index of selected American countries, from 0=less stringent to 100=most stringent, points Ap 0 -2 0 0 M ar 20 b- 20 20 40 g 20 40 l-2 0 60 20 60 0 80 -2 0 80 20 100 France 0 Germany 20 India 20 Singapore Fe Japan b- Korea Fe China Stringency index of selected European countries, from 0=less stringent to 100=most stringent, points M ar Stringency index of selected Asian countries, from 0=less stringent to 100=most stringent, points Sources: Capital Economics and Oxford University. 4
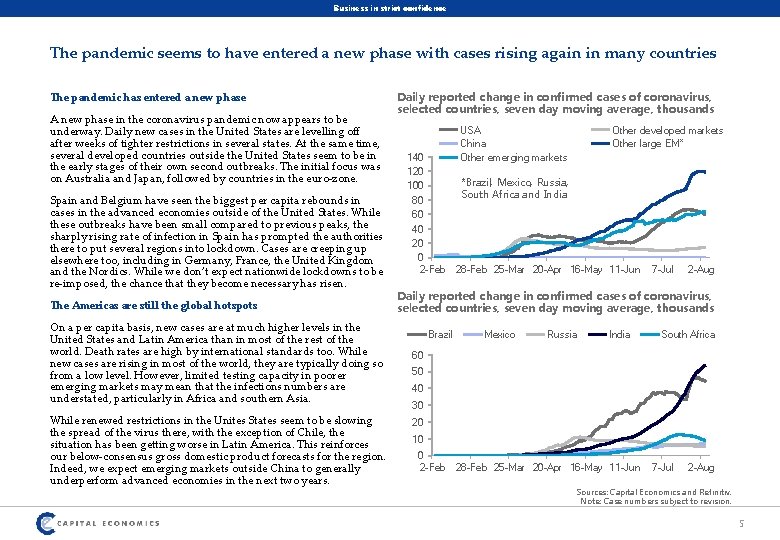
Business in strict confidence The pandemic seems to have entered a new phase with cases rising again in many countries The pandemic has entered a new phase A new phase in the coronavirus pandemic now appears to be underway. Daily new cases in the United States are levelling off after weeks of tighter restrictions in several states. At the same time, several developed countries outside the United States seem to be in the early stages of their own second outbreaks. The initial focus was on Australia and Japan, followed by countries in the euro-zone. Spain and Belgium have seen the biggest per capita rebounds in cases in the advanced economies outside of the United States. While these outbreaks have been small compared to previous peaks, the sharply rising rate of infection in Spain has prompted the authorities there to put several regions into lockdown. Cases are creeping up elsewhere too, including in Germany, France, the United Kingdom and the Nordics. While we don’t expect nationwide lockdowns to be re-imposed, the chance that they become necessary has risen. The Americas are still the global hotspots On a per capita basis, new cases are at much higher levels in the United States and Latin America than in most of the rest of the world. Death rates are high by international standards too. While new cases are rising in most of the world, they are typically doing so from a low level. However, limited testing capacity in poorer emerging markets may mean that the infections numbers are understated, particularly in Africa and southern Asia. While renewed restrictions in the Unites States seem to be slowing the spread of the virus there, with the exception of Chile, the situation has been getting worse in Latin America. This reinforces our below-consensus gross domestic product forecasts for the region. Indeed, we expect emerging markets outside China to generally underperform advanced economies in the next two years. Daily reported change in confirmed cases of coronavirus, selected countries, seven day moving average, thousands USA China Other emerging markets Other developed markets Other large EM* 140 120 *Brazil, Mexico, Russia, 100 South Africa and India 80 60 40 20 0 2 -Feb 28 -Feb 25 -Mar 20 -Apr 16 -May 11 -Jun 7 -Jul 2 -Aug Daily reported change in confirmed cases of coronavirus, selected countries, seven day moving average, thousands Brazil Mexico Russia India South Africa 60 50 40 30 20 10 0 2 -Feb 28 -Feb 25 -Mar 20 -Apr 16 -May 11 -Jun 7 -Jul 2 -Aug Sources: Capital Economics and Refinitiv. Note: Case numbers subject to revision. 5
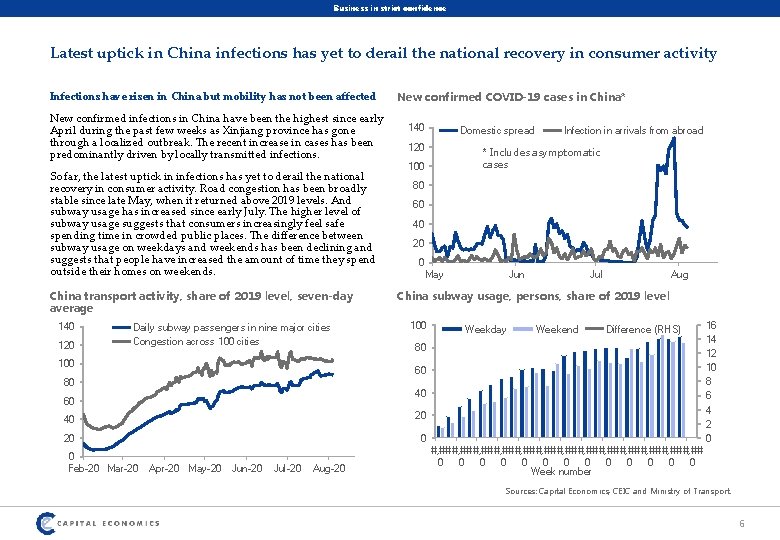
Business in strict confidence Latest uptick in China infections has yet to derail the national recovery in consumer activity Infections have risen in China but mobility has not been affected New confirmed infections in China have been the highest since early April during the past few weeks as Xinjiang province has gone through a localized outbreak. The recent increase in cases has been predominantly driven by locally transmitted infections. So far, the latest uptick in infections has yet to derail the national recovery in consumer activity. Road congestion has been broadly stable since late May, when it returned above 2019 levels. And subway usage has increased since early July. The higher level of subway usage suggests that consumers increasingly feel safe spending time in crowded public places. The difference between subway usage on weekdays and weekends has been declining and suggests that people have increased the amount of time they spend outside their homes on weekends. China transport activity, share of 2019 level, seven-day average 140 120 Daily subway passengers in nine major cities Congestion across 100 cities 100 New confirmed COVID-19 cases in China* 140 Domestic spread 120 * Includes asymptomatic cases 100 80 60 40 20 0 May Jun Jul Aug China subway usage, persons, share of 2019 level 100 Weekday Weekend Difference (RHS) 80 60 80 40 60 40 20 20 0 0 Feb-20 Mar-20 Infection in arrivals from abroad Apr-20 May-20 Jun-20 Jul-20 Aug-20 16 14 12 10 8 6 4 2 0 #, ## #, ## #, ## #, ## 0 0 0 0 Week number Sources: Capital Economics, CEIC and Ministry of Transport. 6
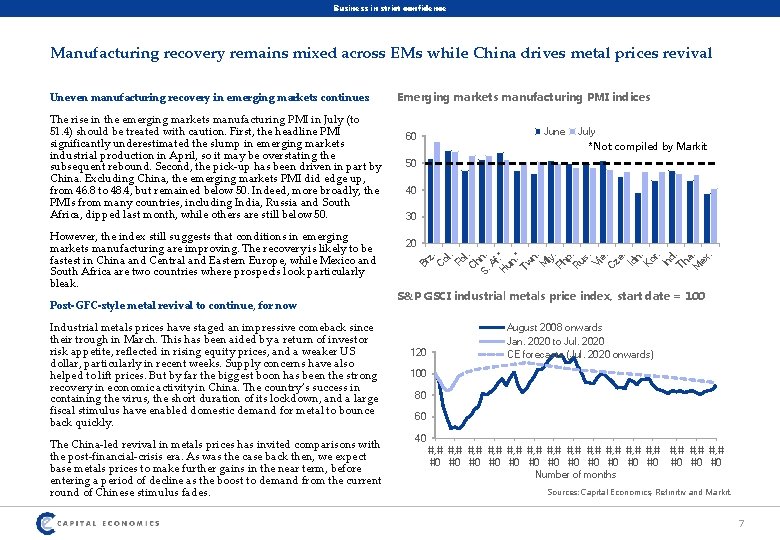
Business in strict confidence Manufacturing recovery remains mixed across EMs while China drives metal prices revival However, the index still suggests that conditions in emerging markets manufacturing are improving. The recovery is likely to be fastest in China and Central and Eastern Europe, while Mexico and South Africa are two countries where prospects look particularly bleak. Post-GFC-style metal revival to continue, for now Industrial metals prices have staged an impressive comeback since their trough in March. This has been aided by a return of investor risk appetite, reflected in rising equity prices, and a weaker US dollar, particularly in recent weeks. Supply concerns have also helped to lift prices. But by far the biggest boon has been the strong recovery in economic activity in China. The country’s success in containing the virus, the short duration of its lockdown, and a large fiscal stimulus have enabled domestic demand for metal to bounce back quickly. The China-led revival in metals prices has invited comparisons with the post-financial-crisis era. As was the case back then, we expect base metals prices to make further gains in the near term, before entering a period of decline as the boost to demand from the current round of Chinese stimulus fades. June 60 July *Not compiled by Markit 50 40 30 20 z. C ol. Po l C. hn S. . Af H. * un. * Tw n. M ly Ph. p R. us. Vi e. C ze. Id n. Ko r. In d. Th a M. ex. The rise in the emerging markets manufacturing PMI in July (to 51. 4) should be treated with caution. First, the headline PMI significantly underestimated the slump in emerging markets industrial production in April, so it may be overstating the subsequent rebound. Second, the pick-up has been driven in part by China. Excluding China, the emerging markets PMI did edge up, from 46. 8 to 48. 4, but remained below 50. Indeed, more broadly, the PMIs from many countries, including India, Russia and South Africa, dipped last month, while others are still below 50. Emerging markets manufacturing PMI indices Br Uneven manufacturing recovery in emerging markets continues S&P GSCI industrial metals price index, start date = 100 120 August 2008 onwards Jan. 2020 to Jul. 2020 CE forecasts (Jul. 2020 onwards) 100 80 60 40 #, # #, # #, # #, # #0 #0 #0 #0 Number of months Sources: Capital Economics, Refinitiv and Markit. 7
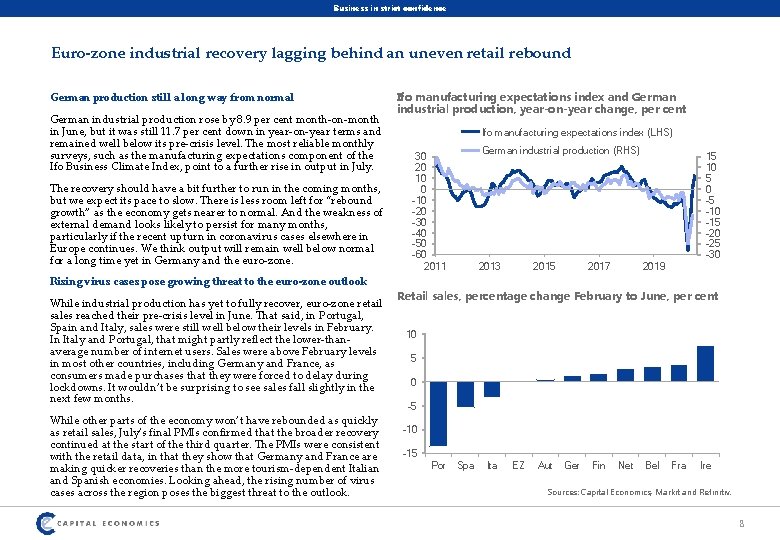
Business in strict confidence Euro-zone industrial recovery lagging behind an uneven retail rebound German production still a long way from normal German industrial production rose by 8. 9 per cent month-on-month in June, but it was still 11. 7 per cent down in year-on-year terms and remained well below its pre-crisis level. The most reliable monthly surveys, such as the manufacturing expectations component of the Ifo Business Climate Index, point to a further rise in output in July. The recovery should have a bit further to run in the coming months, but we expect its pace to slow. There is less room left for “rebound growth” as the economy gets nearer to normal. And the weakness of external demand looks likely to persist for many months, particularly if the recent upturn in coronavirus cases elsewhere in Europe continues. We think output will remain well below normal for a long time yet in Germany and the euro-zone. Rising virus cases pose growing threat to the euro-zone outlook While industrial production has yet to fully recover, euro-zone retail sales reached their pre-crisis level in June. That said, in Portugal, Spain and Italy, sales were still well below their levels in February. In Italy and Portugal, that might partly reflect the lower-thanaverage number of internet users. Sales were above February levels in most other countries, including Germany and France, as consumers made purchases that they were forced to delay during lockdowns. It wouldn’t be surprising to see sales fall slightly in the next few months. While other parts of the economy won’t have rebounded as quickly as retail sales, July’s final PMIs confirmed that the broader recovery continued at the start of the third quarter. The PMIs were consistent with the retail data, in that they show that Germany and France are making quicker recoveries than the more tourism-dependent Italian and Spanish economies. Looking ahead, the rising number of virus cases across the region poses the biggest threat to the outlook. Ifo manufacturing expectations index and German industrial production, year-on-year change, per cent Ifo manufacturing expectations index (LHS) German industrial production (RHS) 30 20 10 0 -10 -20 -30 -40 -50 -60 2011 2013 2015 2017 15 10 5 0 -5 -10 -15 -20 -25 -30 2019 Retail sales, percentage change February to June, per cent 10 5 0 -5 -10 -15 Por Spa Ita EZ Aut Ger Fin Net Bel Fra Ire Sources: Capital Economics, Markit and Refinitiv. 8
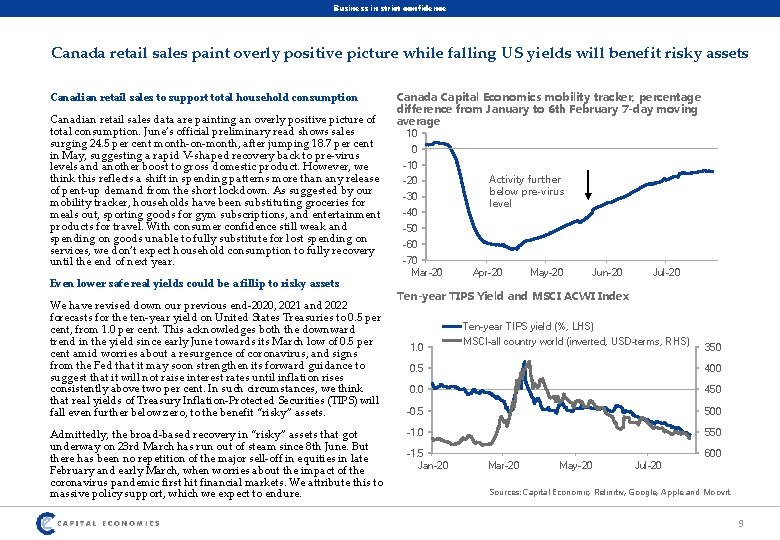
Business in strict confidence Canada retail sales paint overly positive picture while falling US yields will benefit risky assets Canadian retail sales to support total household consumption Canadian retail sales data are painting an overly positive picture of total consumption. June’s official preliminary read shows sales surging 24. 5 per cent month-on-month, after jumping 18. 7 per cent in May, suggesting a rapid V-shaped recovery back to pre-virus levels and another boost to gross domestic product. However, we think this reflects a shift in spending patterns more than any release of pent-up demand from the short lockdown. As suggested by our mobility tracker, households have been substituting groceries for meals out, sporting goods for gym subscriptions, and entertainment products for travel. With consumer confidence still weak and spending on goods unable to fully substitute for lost spending on services, we don’t expect household consumption to fully recovery until the end of next year. Even lower safe real yields could be a fillip to risky assets We have revised down our previous end-2020, 2021 and 2022 forecasts for the ten-year yield on United States Treasuries to 0. 5 per cent, from 1. 0 per cent. This acknowledges both the downward trend in the yield since early June towards its March low of 0. 5 per cent amid worries about a resurgence of coronavirus, and signs from the Fed that it may soon strengthen its forward guidance to suggest that it will not raise interest rates until inflation rises consistently above two per cent. In such circumstances, we think that real yields of Treasury Inflation-Protected Securities (TIPS) will fall even further below zero, to the benefit “risky” assets. Admittedly, the broad-based recovery in “risky” assets that got underway on 23 rd March has run out of steam since 8 th June. But there has been no repetition of the major sell-off in equities in late February and early March, when worries about the impact of the coronavirus pandemic first hit financial markets. We attribute this to massive policy support, which we expect to endure. Canada Capital Economics mobility tracker, percentage difference from January to 6 th February 7 -day moving average 10 0 -10 -20 -30 -40 Activity further below pre-virus level -50 -60 -70 Mar-20 Apr-20 May-20 Jun-20 Jul-20 Ten-year TIPS Yield and MSCI ACWI Index 1. 0 Ten-year TIPS yield (%, LHS) MSCI-all country world (inverted, USD-terms, RHS) 350 0. 5 400 0. 0 450 -0. 5 500 -1. 0 550 -1. 5 Jan-20 600 Mar-20 May-20 Jul-20 Sources: Capital Economic, Refinitiv, Google, Apple and Moovit. 9
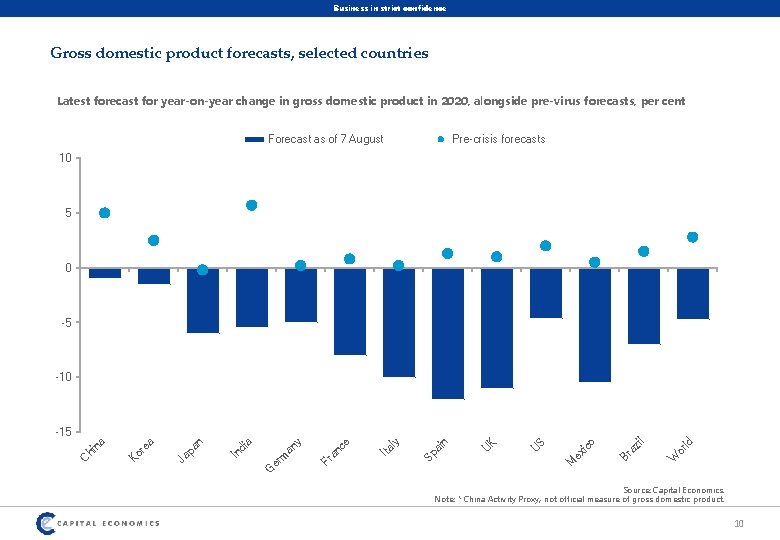
Business in strict confidence Gross domestic product forecasts, selected countries Latest forecast for year-on-year change in gross domestic product in 2020, alongside pre-virus forecasts, per cent Forecast as of 7 August Pre-crisis forecasts 10 5 0 -5 -10 or ld W il Br az o M ex ic S U K U ai n Sp ly ce Ita er m G Fr an an y a di In n pa Ja re a Ko C hi n a -15 Source: Capital Economics. Note: * China Activity Proxy, not official measure of gross domestic product. 10
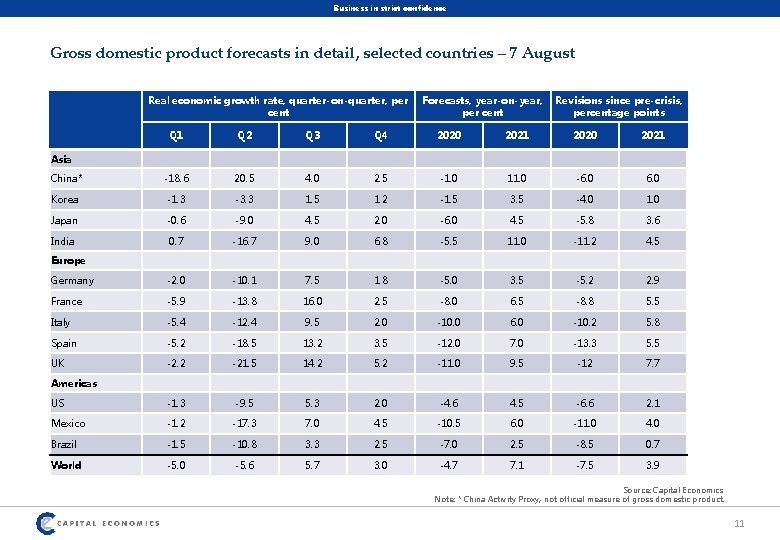
Business in strict confidence Gross domestic product forecasts in detail, selected countries – 7 August Real economic growth rate, quarter-on-quarter, per cent Forecasts, year-on-year, per cent Revisions since pre-crisis, percentage points Q 1 Q 2 Q 3 Q 4 2020 2021 China* -18. 6 20. 5 4. 0 2. 5 -1. 0 11. 0 -6. 0 Korea -1. 3 -3. 3 1. 5 1. 2 -1. 5 3. 5 -4. 0 1. 0 Japan -0. 6 -9. 0 4. 5 2. 0 -6. 0 4. 5 -5. 8 3. 6 India 0. 7 -16. 7 9. 0 6. 8 -5. 5 11. 0 -11. 2 4. 5 Germany -2. 0 -10. 1 7. 5 1. 8 -5. 0 3. 5 -5. 2 2. 9 France -5. 9 -13. 8 16. 0 2. 5 -8. 0 6. 5 -8. 8 5. 5 Italy -5. 4 -12. 4 9. 5 2. 0 -10. 0 6. 0 -10. 2 5. 8 Spain -5. 2 -18. 5 13. 2 3. 5 -12. 0 7. 0 -13. 3 5. 5 UK -2. 2 -21. 5 14. 2 5. 2 -11. 0 9. 5 -12 7. 7 US -1. 3 -9. 5 5. 3 2. 0 -4. 6 4. 5 -6. 6 2. 1 Mexico -1. 2 -17. 3 7. 0 4. 5 -10. 5 6. 0 -11. 0 4. 0 Brazil -1. 5 -10. 8 3. 3 2. 5 -7. 0 2. 5 -8. 5 0. 7 World -5. 0 -5. 6 5. 7 3. 0 -4. 7 7. 1 -7. 5 3. 9 Asia Europe Americas Source: Capital Economics Note: * China Activity Proxy, not official measure of gross domestic product. 11
Business in strict confidence Contact details Grant Colquhoun Head of Consultancy Grant. Colquhoun@capitaleconomics. com Marie-Louise Deshaires Economist Marielouise. deshaires@capitaleconomics. com Roxane Osuna Economist Roxane. Osuna@capitaleconomics. com 12
Business in strict confidence Disclaimer: While every effort has been made to ensure that the data quoted and used for the research behind this document is reliable, there is no guarantee that it is correct, and Capital Economics Limited and its subsidiaries can accept no liability whatsoever in respect of any errors or omissions. This document is a piece of economic research and is not intended to constitute investment advice, nor to solicit dealing in securities or investments. Distribution: Subscribers are free to make copies of our publications for their own use, and for the use of members of the subscribing team at their business location. No other form of copying or distribution of our publications is permitted without our explicit permission. This includes but is not limited to internal distribution to non-subscribing employees or teams. Email sales@capitaleconomics. com Visit www. capitaleconomics. com 13
- Slides: 13