
BUSINESS ENVIRONMENT CHALLENGES ON EASTERN EUROPEAN MARKETS Alla
BUSINESS ENVIRONMENT CHALLENGES ON EASTERN EUROPEAN MARKETS Alla Starostina, Head of the International Economics and Marketing Dep. Natalia Kochkina, Associate Prof. International Economics and Marketing Dep. Volodymyr Kravchenko, 1
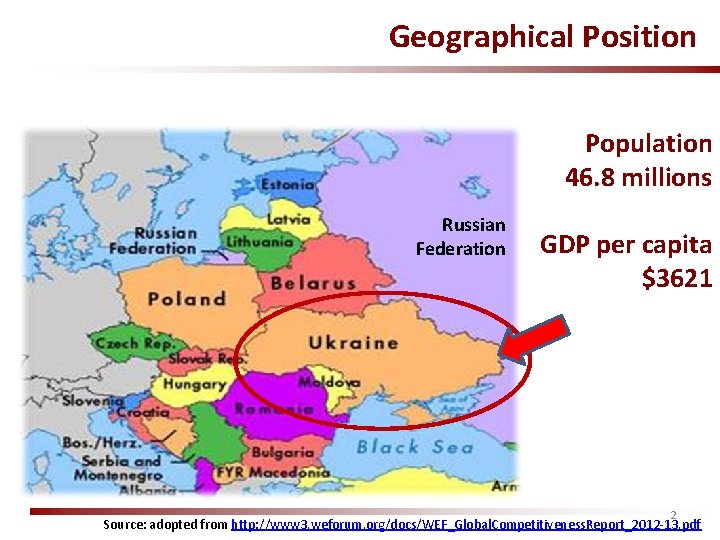
Geographical Position Population 46. 8 millions Russian Federation GDP per capita $3621 2 Source: adopted from http: //www 3. weforum. org/docs/WEF_Global. Competitiveness. Report_2012 -13. pdf
Specific features of Ukrainian business environment - 1 • Ukraine faced unique process of transformation from highly developed socioeconomic society to clan and oligarchic capitalism, period of initial accumulation of capital, highly monopolistic economic. • Transition from power of one communist political party at all sphere of socioeconomic activity to multiparty system. Nowadays there are over 200 political parties in Ukraine. 87 political parties participated in the last parliament elections in 2011 and 9 of them are now in parliament. • Destruction of all cooperation links with former USSR and consequently loss of some serious branches on national economy such as textile industry, machine building and other. 3
Specific features of Ukrainian business environment - 2 Destruction of highly developed system of social guarantees: - gratuitous medical care; - gratuitous apartments; - free of charge kinder-gardens; - free of charge vacation facilities: sanatoriums, vacation houses, ets. • Various groups of arts, singing, dancing, etc (now this services cost a lot) • A huge gap between older, middle and young generations in terms of mentality, material, and social issues. • • • 4
• • International marketing research is a very complex part of the marketing activity. The role of international marketing in decision making process has tremendously increased over the recent years. It is caused by intensification of globalization processes in various forms: Development and expansion of international trade Transnationalisation of economies Growing significance of small and medium business in global economy Intensification of international financial activity, capital flows 5
Forms of intensification of globalization processes • Intensification of regional integration processes • Intensification of migration processes • Aggravation of the global problems (ecology, food-stuffing, water, economic resources, wars. ) • Formation of the global markets • Increase of instability within international business environment • Existence of the specific cultural environment in every country 6
Globalization is a irreversible process of disappearance of economic borders between the countries with a purpose to search more profitable capital reproduction opportunities on all forms of capital which results in mutual penetration, interlace, interdependence of national economic systems to form global markets and world economic system. 7
International marketing research is a systematic process of data collection, data analysis, and selection of the objective marketing information to support marketing decisions regarding entering and implementing the business strategy, allocation of the resources in more than one foreign country based on comparative analysis of its attractiveness. 8
Specific characteristics of international marketing research: • Decisions are made more than for one country • International marketing research forms a base for resource allocations in foreign countries • Existence of a complex problem in international research regarding data comparison for more than one country to choose the mode of entry and strategy of activities 9
The steps to analyse the international business environment 1. Choice of countries to enter and perform business activity 2. Definition of the common factors to analyse the markets of different countries 3. Preliminary classification of the factors: as threats or opportunities 4. Expert assessment of the impact of each of the group of factors 5. Analysis of the factors within each group (political, economic, demographic, cultural, environmental, technological) 6. Comparative analysis of the factors and their impact in different countries 7. Conclusions 10
Cultural Factors 11 Source: adopted from
The role of culture factors • Culture plays a mayor role in influencing human behavior • Cultural factors play key role in international business • Cultural differences are the most stable barrier for spreading of globalization process 12
Gteert Hofstede cultural dimensions theory Describes influence of the society's culture on the values of its members, how these values relate to behavior, international management 13
The theory proposed six dimensions which cultural values could be analyzed: individualism versus collectivism; uncertainty avoidance; power distance (strength of social hierarchy); masculinity versus femininity (task orientation versus person-orientation; • long-term orientation; • Indulgence versus self-restraint. • • 14
Power distance • Power distance is the extent to which less powerful members of society accept and expect that power is distributed unequally. • Cultures that endorse low power distance accept and expect power relations that are more consultative or democratic. 15
Power distance - facts • Ukraine-78 (authoritarian mode of decision making, centralized structure of management, difficulties with conducting marketing research) • Italy-50; • Russia-85; • USA-40; • Average-55. 16
Uncertainty avoidance • High uncertainty avoidance cultures try to minimize the occurrence of unknown or unusual circumstances and to proceed with careful changes by planning and by implementing rules, laws and regulation; people are more emotional. • Low uncertainty avoidance cultures accept and feel comfortable in unstructured situation or changeable environments; people are more pragmatic. 17
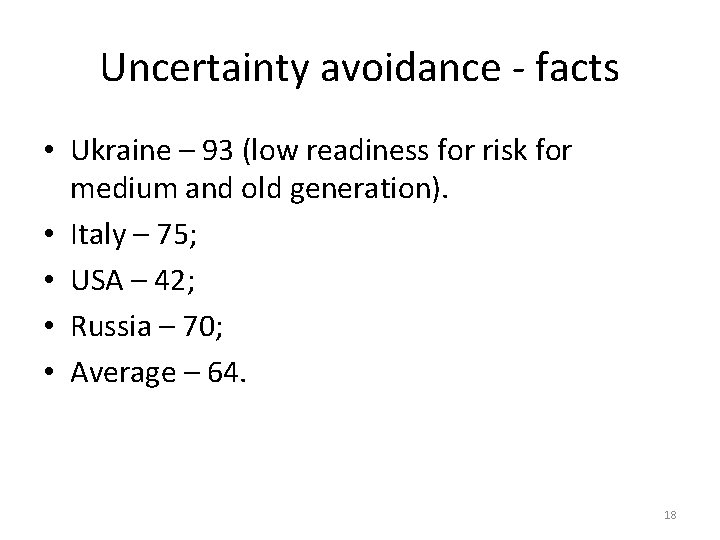
Uncertainty avoidance - facts • Ukraine – 93 (low readiness for risk for medium and old generation). • Italy – 75; • USA – 42; • Russia – 70; • Average – 64. 18
Long-term Orientation • Long- term orientation societies attach more importance to the future; placed a lot of importance on characteristics like persistence, saving, respect for status and position in society sense of shame. • Short-term societies focus on instant gratification and pursuit of material pleasures. 19
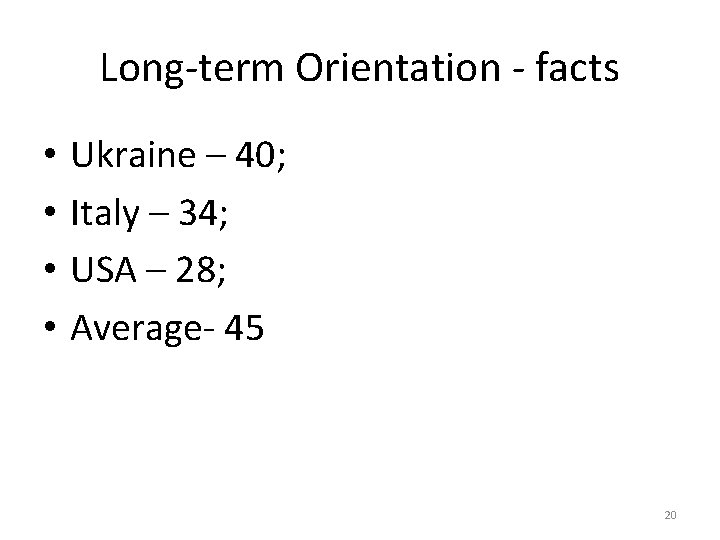
Long-term Orientation - facts • • Ukraine – 40; Italy – 34; USA – 28; Average- 45 20
Masculinity versus Femininity • The distribution of emotional roles between the genders. • Masculinity cultures’ values are competitiveness, assertiveness, materialism, ambition and power. • Feminine culture place more value on relationships and quality of life. 21
Masculinity versus Femininity - facts • Ukraine – 54 (high latent women influence on social life, but low participation in the government and municipal bodies). • Italy – 70; • USA – 62; • Average for world – 50. 22
Individualism versus collectivism • The degree to which individuals are integrated into groups. • In individualistic societies, the stress is hut on personal achievement and individual rights. • In collectivist societies, individuals act predominantly as the firm group or organization. 23
Individualism versus collectivism - facts • Ukraine – 30 (high level of conformism, little distinction between private and professional life) • Italy – 76; • USA – 90; • Russia – 37; • Average for world - 43. 24
Indulgence versus self-restraint • The extent to which member in society try to control their desires and impulses. • Indulgence society have a tendency to allow free gratification of basic and natural human desires related to enjoying life and having fun. • Restrained society have a conviction that such gratification needs to be regulated by strict norms. 25
Indulgence versus self-restraint - facts • Ukraine 30 -35, • Italy - ? 26
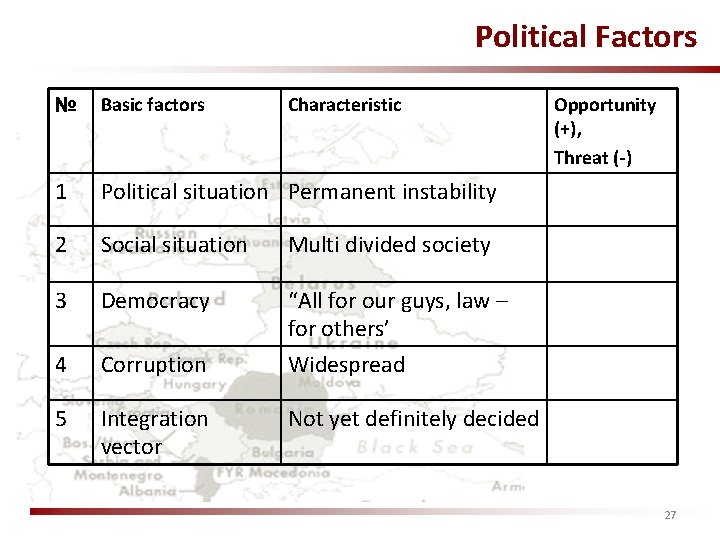
Political Factors № Basic factors Characteristic 1 Political situation Permanent instability 2 Social situation Multi divided society 3 Democracy 4 Corruption “All for our guys, law – for others’ Widespread 5 Integration vector Opportunity (+), Threat (-) Not yet definitely decided 27
Political situation • Political situation in Ukraine has 2 components: observable (formal) and concealed (real) • Formal political situation – permanent and sharp opposition between (and insert) main political parties and key political figures 28
Parliament parties • • • Party of Region (Yanukovich) Batkivshina (Timoshenko, Yatcenyk) UDAR (Klichko) Svoboda (Tyagnibok) Communist party (Simonenko) 29
Real political situation is defined by the next characteristics: A. Real politicians’ values: personal power, not ideas. B. Strong tribalism tendency C. Weak position in a world economy D. Economic crisis 30
Political situation • • A. Personal power, not ideas. Ukrainian politics struggle for ideas and values before election and express much more tolerance to their opponents after. Politics in Ukraine are about personal power and personal ambitions and streaming assets (financial and institutional) to their supporters. 31
B. Strong tribalism tendency “Donetskie” – people are “origin from Donetsk district” – motherland of President Yanukovich and Party of Region. They possessed key positions in all spheres of Ukrainian politic system and business. 32
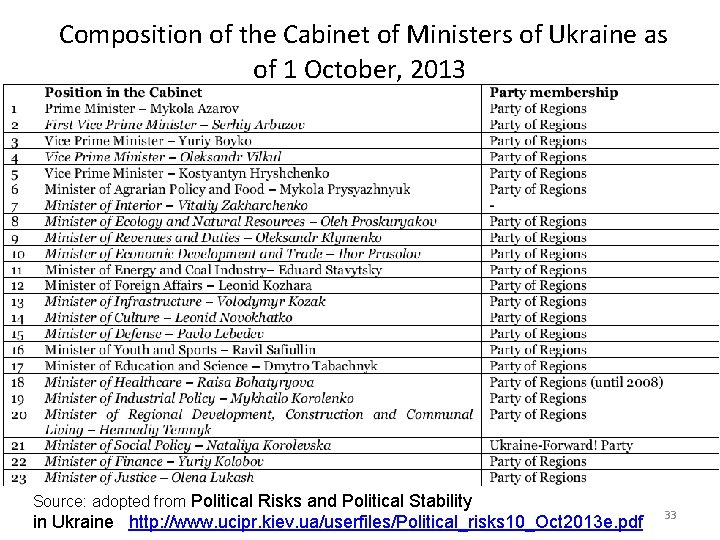
Composition of the Cabinet of Ministers of Ukraine as of 1 October, 2013 Source: adopted from Political Risks and Political Stability in Ukraine http: //www. ucipr. kiev. ua/userfiles/Political_risks 10_Oct 2013 e. pdf 33
Political situation С. Ukrainian policy extremely depends on its surroundings, Ukraine is not independent actor. European Union, Russia, Turkey – main actors in the nearest future 34
Political situation D. Economic situation is very tense. Any political party which сan win future President and Parliament elections has to solve the same problems and use the same instruments. 35
Social Situation Multi divided society A. Spatial divided society B. Property divided society C. Income divided society D. Person divided society 36
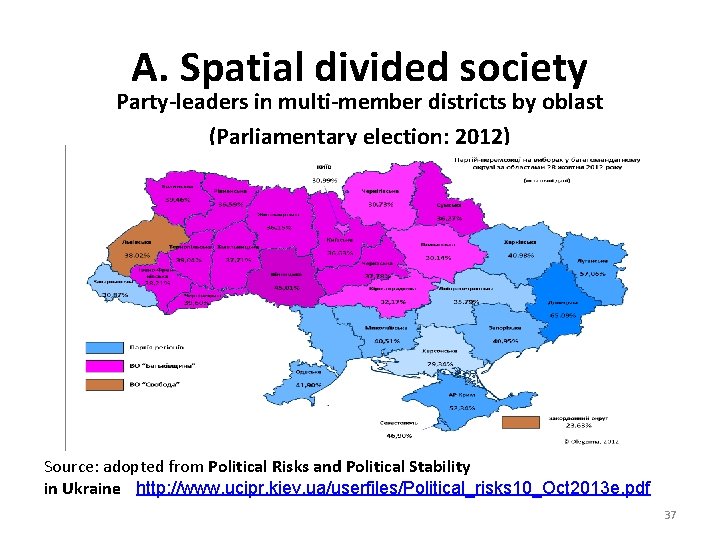
A. Spatial divided society Party-leaders in multi-member districts by oblast (Parliamentary election: 2012) Source: adopted from Political Risks and Political Stability in Ukraine http: //www. ucipr. kiev. ua/userfiles/Political_risks 10_Oct 2013 e. pdf 37
B. Property divided society • Ukraine: summary assets of the 100 top-rich Ukrainians = 61% GDP • Russia: summary assets of the 100 top-rich Russians = 33% GDP Source: adopted from http: //www. bbc. co. uk/ukrainian/ukraine_in_russian/2012/02/120210_ru_inequality 38 _usa_uk_ukraine_yg. shtml
C. Income divided society Formal measure - Gini index The Gini index is a measure of statistical dispersion intended to represent the income distribution of a nation's residents (Corrado Gini, 1912). A Gini index of zero expresses perfect equality, where all values are the same (for example, where everyone has an exactly equal income). A Gini index of 100 expresses maximal inequality among values (for example where only one person has all the income). 39
Problem with formal measure of the social disparity Level of Gini index in Ukraine – 26. 44 (represents picture which is typical to the social stable society (neighbors in WB ranking are Finland Germany). Moreover – we see downside tendency in Ukraine. 40
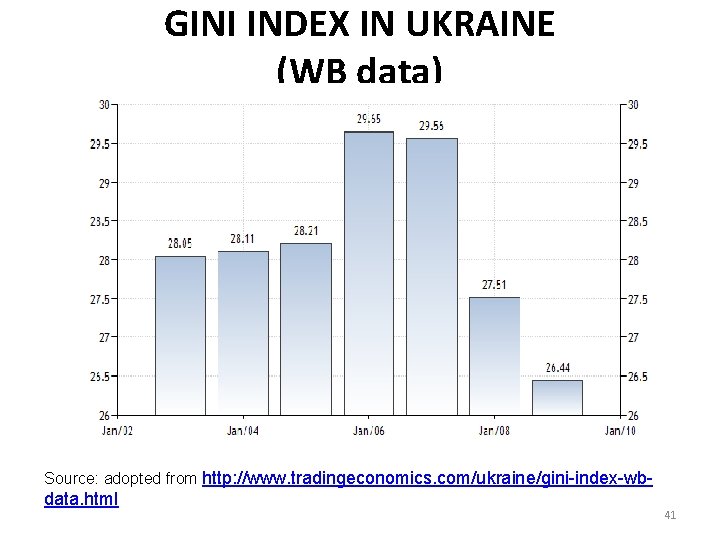
GINI INDEX IN UKRAINE (WB data) Source: adopted from http: //www. tradingeconomics. com/ukraine/gini-index-wb- data. html 41
Real social disparity But real social disparity in Ukraine is higher than it demonstrates by the Gini index. Reasons: • shadow economy – raise real income of SME • offshore operation – raise real income of Big Busines • today's economic recession (2012 – 2013) – reduce real income of employers 42
D. Separation of people one from another Civil society in Ukraine is immature. In 2010 the part of the population which considered itself as members of religious organizations and church communities made up 4% of the population; • members of political parties, sports clubs and specialtyrelated associations - 3% per each; • student societies and youth organizations - 2%; • the part of members of other public formations made up 1% and less • Source: adopted from http: //i- soc. com. ua/institute/smonit_2010. pdf? PHPSESSID=15 d 6 e 4 f 810 b 62037 c 0 f 63 d 5 abb 3 fa 287 43
Civil society Participation in the activity of political parties and public organizations remains among the least significant purposes and values for citizens of Ukraine till now (less than 3 points on the 5 -point scale) However, this indicator has grown from 2, 09 points in 1994 to 2, 46 points in 2011 Source: adopted from http: //i- soc. com. ua/institute/smonit_2010. pdf? PHPSESSID=15 d 6 e 4 f 810 b 62037 c 0 f 63 d 5 abb 3 fa 287 44
Democracy The Democracy Index Ukraine occupies 80 th place in the world for democracy index. Source: adopted from https: //www. eiu. com/public/topical_report. aspx? campaignid=Democracy. Index 12 45
The Democracy Index is an index compiled by the Economist Intelligence Unit, that measures the state of democracy in 167 countries. The index is based on 60 indicators grouped in five different categories: electoral process and pluralism, civil liberties, functioning of government, political participation, and political culture. The index categorizes countries as one of four regime types: full democracies, flawed democracies, hybrid regimes, and authoritarian regimes. 46
The Democracy Index Ukraine topped the list of countries with hybrid regimes and ranked 80 th on the list. 47
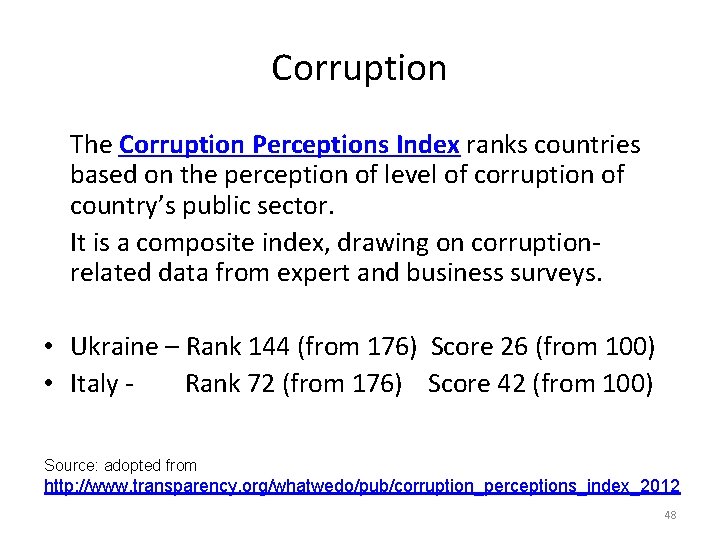
Corruption The Corruption Perceptions Index ranks countries based on the perception of level of corruption of country’s public sector. It is a composite index, drawing on corruptionrelated data from expert and business surveys. • Ukraine – Rank 144 (from 176) Score 26 (from 100) • Italy - Rank 72 (from 176) Score 42 (from 100) Source: adopted from http: //www. transparency. org/whatwedo/pub/corruption_perceptions_index_2012 48
Economic freedom Ukraine’s economic freedom score is 46. 3, places its economy at the 161 nd place in the 2013 Index. Its score is 0. 2 point higher than last year, with modest gains in monetary freedom and business freedom and declines in labor freedom and freedom from corruption. Ukraine is ranked last out of 43 countries in the Europe, and its overall score is lower than the world average. Source: adopted from heritage. org/index 49
Integration vector November 28 -29, 2013 – EU summit in Vilnius, Lithuania. Ukraine-EU association agreement If Ukraine will sign the pact toward potential EU membership then integration vector will be clearly defined. Otherwise debate within Ukraine about integration with Russia's controlled Custom Union will be continued. 50
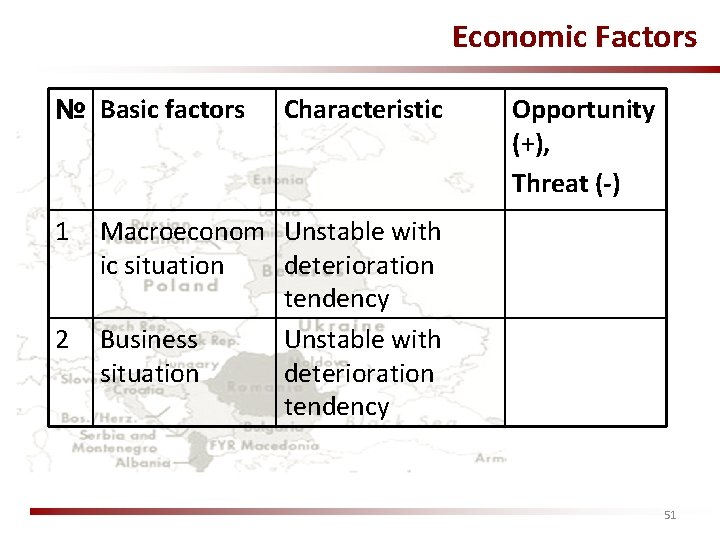
Economic Factors № Basic factors 1 2 Characteristic Opportunity (+), Threat (-) Macroeconom Unstable with ic situation deterioration tendency Business Unstable with situation deterioration tendency 51
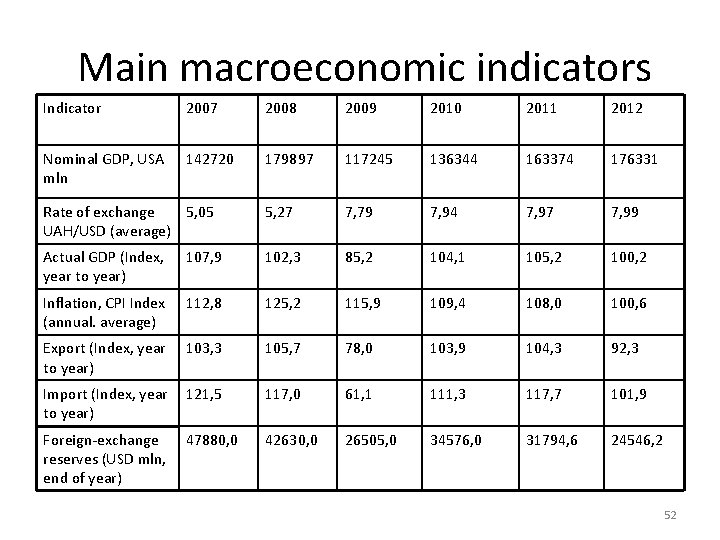
Main macroeconomic indicators Indicator 2007 2008 2009 2010 2011 2012 Nominal GDP, USA mln 142720 179897 117245 136344 163374 176331 Rate of exchange 5, 05 UAH/USD (average) 5, 27 7, 79 7, 94 7, 97 7, 99 Actual GDP (Index, year to year) 107, 9 102, 3 85, 2 104, 1 105, 2 100, 2 Inflation, CPI Index (annual. average) 112, 8 125, 2 115, 9 109, 4 108, 0 100, 6 Export (Index, year to year) 103, 3 105, 7 78, 0 103, 9 104, 3 92, 3 Import (Index, year 121, 5 to year) 117, 0 61, 1 111, 3 117, 7 101, 9 Foreign-exchange 47880, 0 reserves (USD mln, end of year) 42630, 0 26505, 0 34576, 0 31794, 6 24546, 2 52
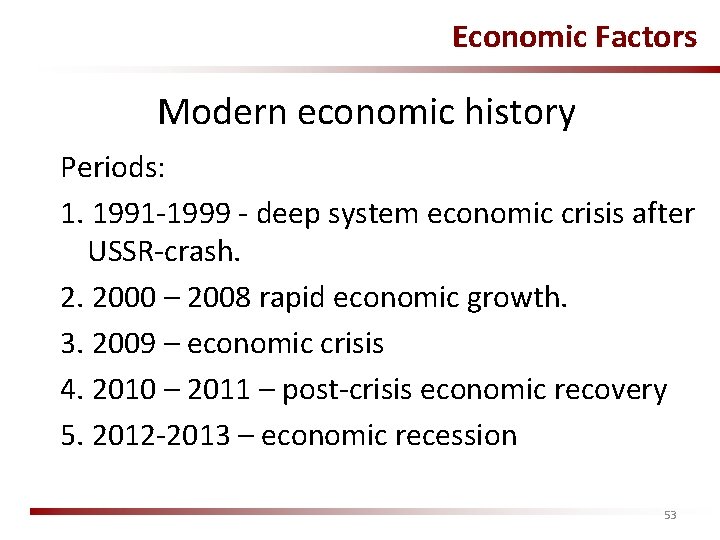
Economic Factors Modern economic history Periods: 1. 1991 -1999 - deep system economic crisis after USSR-crash. 2. 2000 – 2008 rapid economic growth. 3. 2009 – economic crisis 4. 2010 – 2011 – post-crisis economic recovery 5. 2012 -2013 – economic recession 53
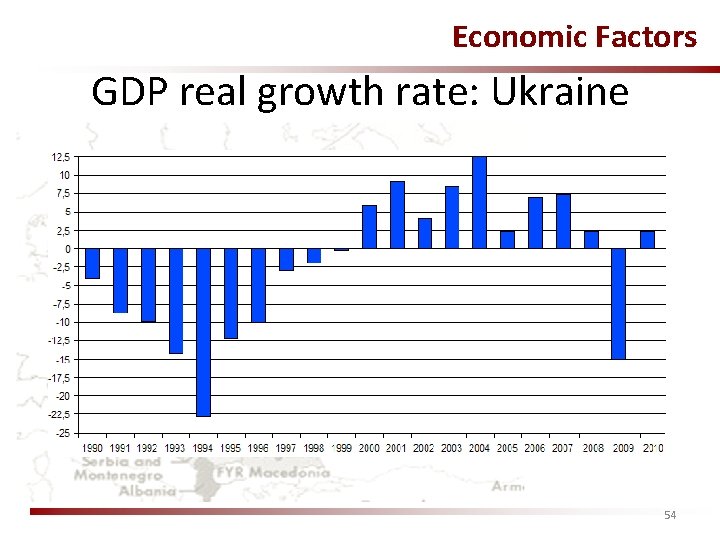
Economic Factors GDP real growth rate: Ukraine 54
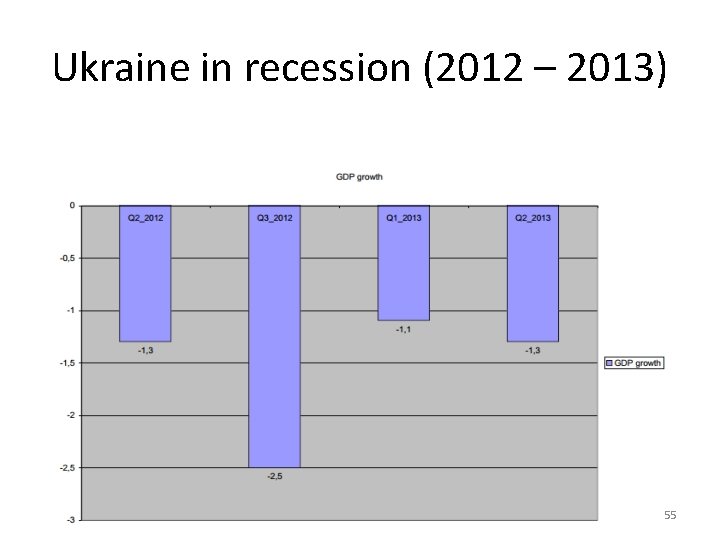
Ukraine in recession (2012 – 2013) 55
Economic Factors Macroeconomic challenges Monetary policy has two primary goals: price stability and economic growth. Up to now NBU has achieved one goal — low inflation. Formal Ukraine has stable foreign exchange rate. 56
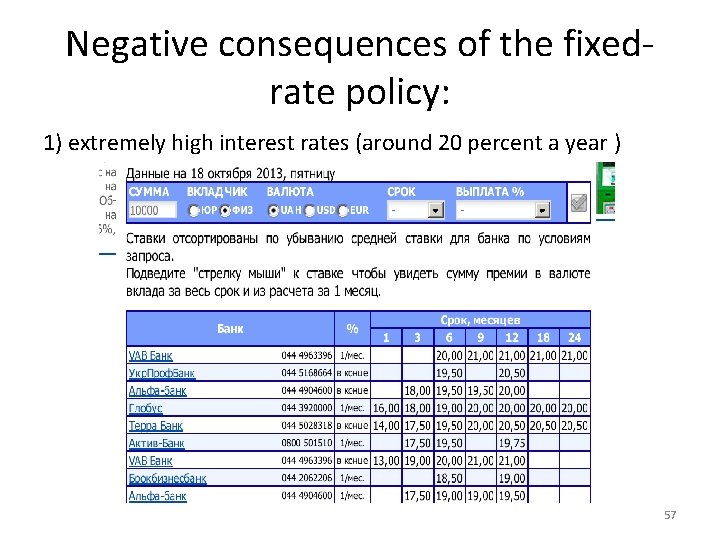
Negative consequences of the fixedrate policy: 1) extremely high interest rates (around 20 percent a year ) 57
Economic Factors Negative consequences of the fixedrate policy: 2) Due to high interest rates non-performing loan ratio also is high (40 percent of all loans) 3) Small and medium-size enterprises in Ukraine have minimal access to bank financing (due to high credit interest rate) 58
From the statement by Prime Minister of Ukraine Mykola Azarov at a session of the Government on October 23, 2013 “Consumer" model of participation of banks in the economy supports the short term demand, but does not create promising jobs and new revenue, which in turn become a new resource of the banking system. No business, except speculative, can not normally develop when financial resources are in excess of 20% per year. Source: adopted from http: //www. kmu. gov. ua/control/en/publish/article? art_id=246787672&cat_id=2448 51734 59
Macroeconomic challenges Possible IMF credit could 1) play role of supportive spring of financial resources to the Ukrainian economy 2) give clear positive signal to other international financial organizations and private investors. 60
Problems with IMF credit: IMF demands: 1) liberalization of the consumer gas price, 2) introducing floating FX rate, 3) reducing of the budget deficit In the loom of the Presidential election (2015) all of them are unacceptable to Ukrainian government. 61
Business situation 1. Investment climate. 2. Tax climate. 3. Customs climate. 62
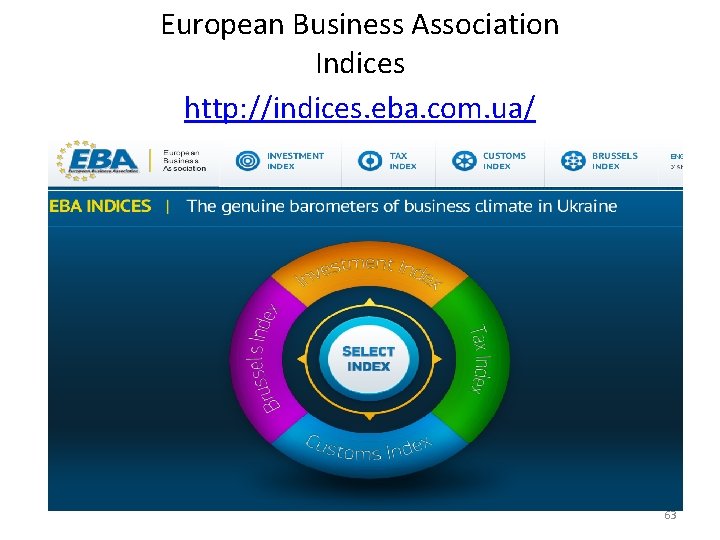
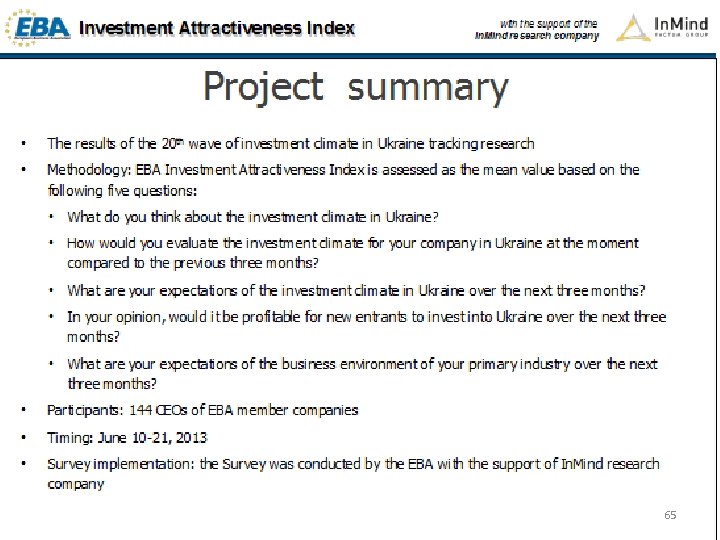
European Business Association Indices http: //indices. eba. com. ua/ 63
Investment climate 64
65

66

67
. Tax climate 68

69

70
Customs climate 71
Customs climate 72

73

74

75

76
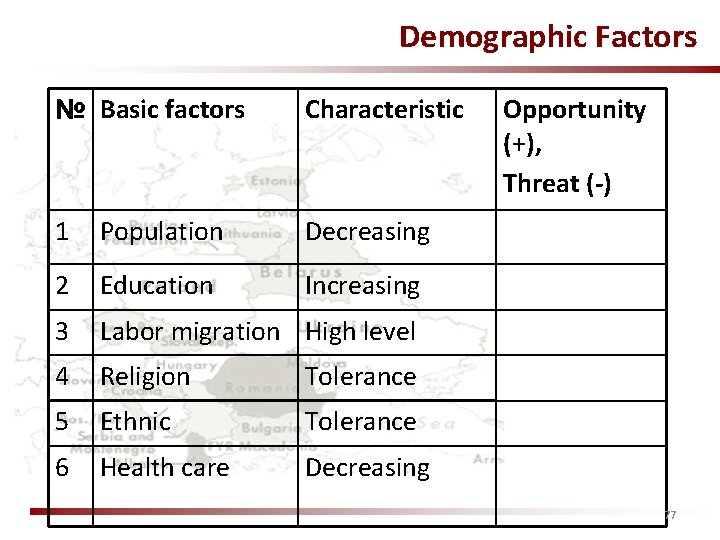
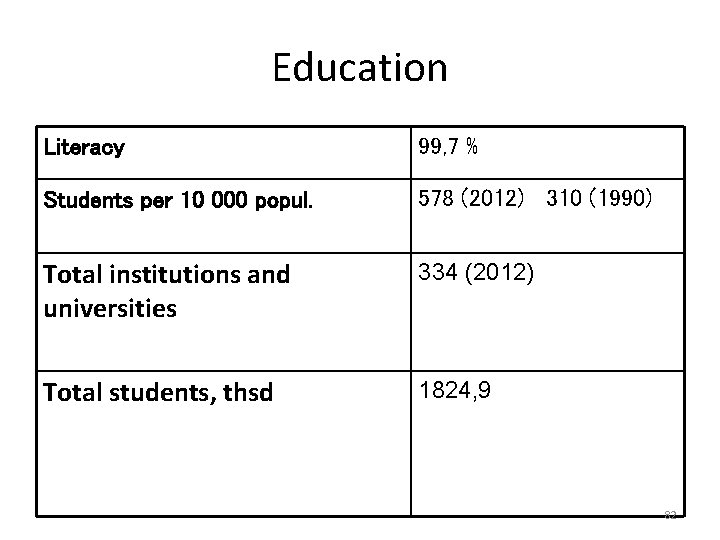
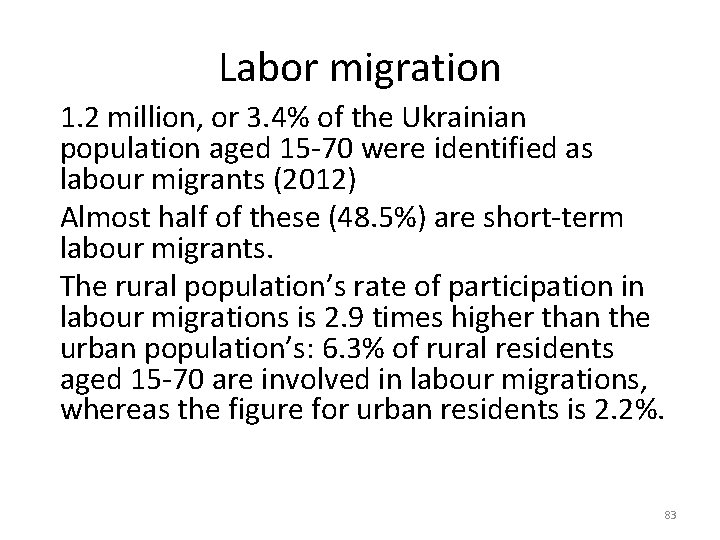
Demographic Factors № Basic factors Characteristic 1 Population Decreasing 2 Education Increasing 3 Labor migration High level 4 Religion Tolerance 5 Ethnic Tolerance 6 Health care Decreasing Opportunity (+), Threat (-) 77
Population 78
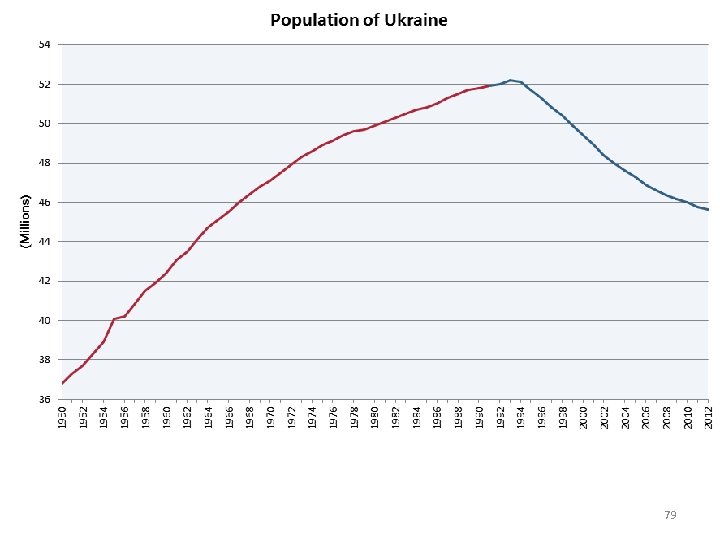
79
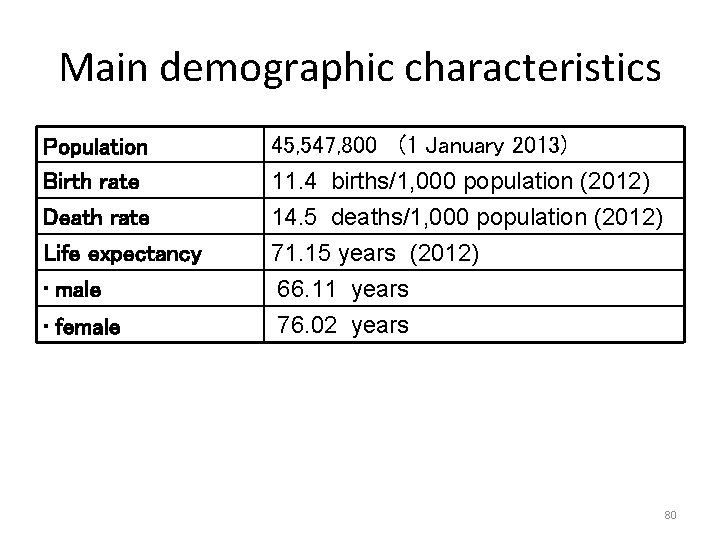
Main demographic characteristics Population Birth rate Death rate Life expectancy 45, 547, 800 (1 January 2013) 11. 4 births/1, 000 population (2012) 14. 5 deaths/1, 000 population (2012) 71. 15 years (2012) • male 66. 11 years 76. 02 years • female 80
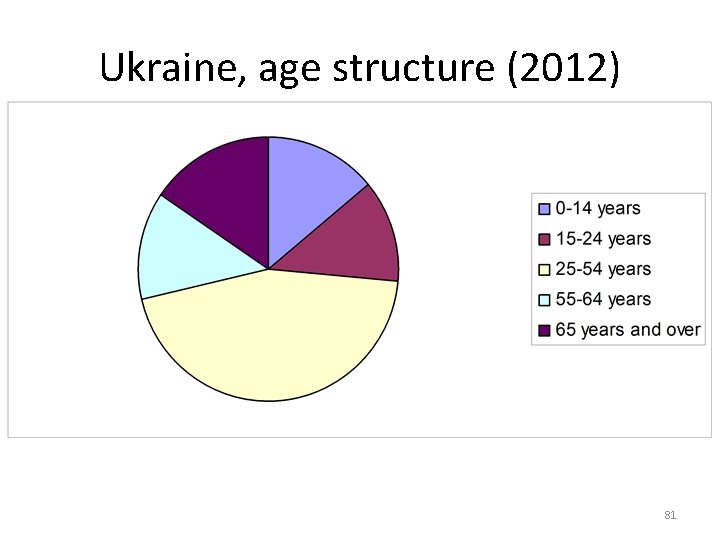
Ukraine, age structure (2012) 81
Education Literacy 99, 7 % Students per 10 000 popul. 578 (2012) 310 (1990) Total institutions and universities 334 (2012) Total students, thsd 1824, 9 82
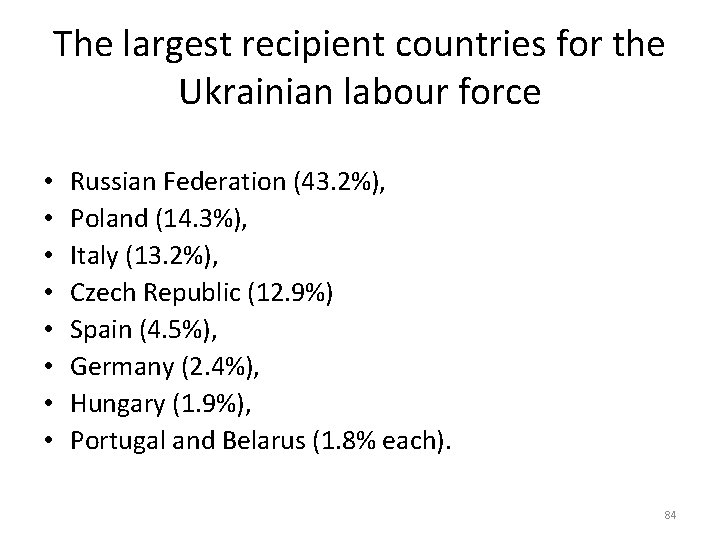
Labor migration 1. 2 million, or 3. 4% of the Ukrainian population aged 15 -70 were identified as labour migrants (2012) Almost half of these (48. 5%) are short-term labour migrants. The rural population’s rate of participation in labour migrations is 2. 9 times higher than the urban population’s: 6. 3% of rural residents aged 15 -70 are involved in labour migrations, whereas the figure for urban residents is 2. 2%. 83
The largest recipient countries for the Ukrainian labour force • • Russian Federation (43. 2%), Poland (14. 3%), Italy (13. 2%), Czech Republic (12. 9%) Spain (4. 5%), Germany (2. 4%), Hungary (1. 9%), Portugal and Belarus (1. 8% each). 84
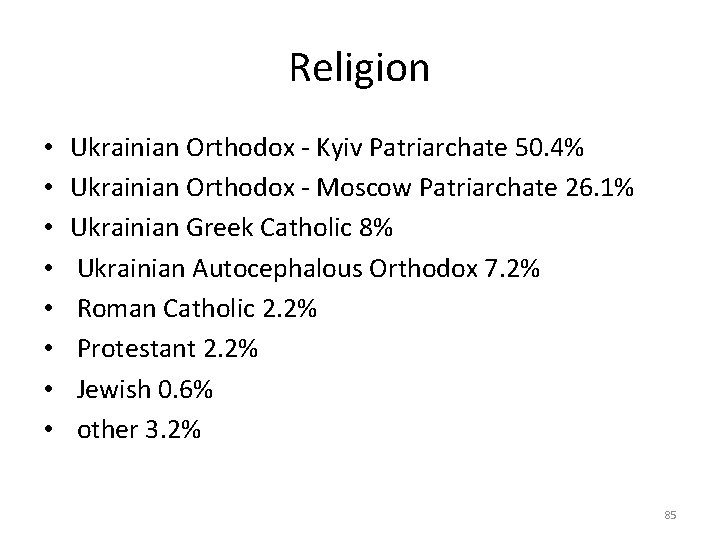
Religion • • Ukrainian Orthodox - Kyiv Patriarchate 50. 4% Ukrainian Orthodox - Moscow Patriarchate 26. 1% Ukrainian Greek Catholic 8% Ukrainian Autocephalous Orthodox 7. 2% Roman Catholic 2. 2% Protestant 2. 2% Jewish 0. 6% other 3. 2% 85
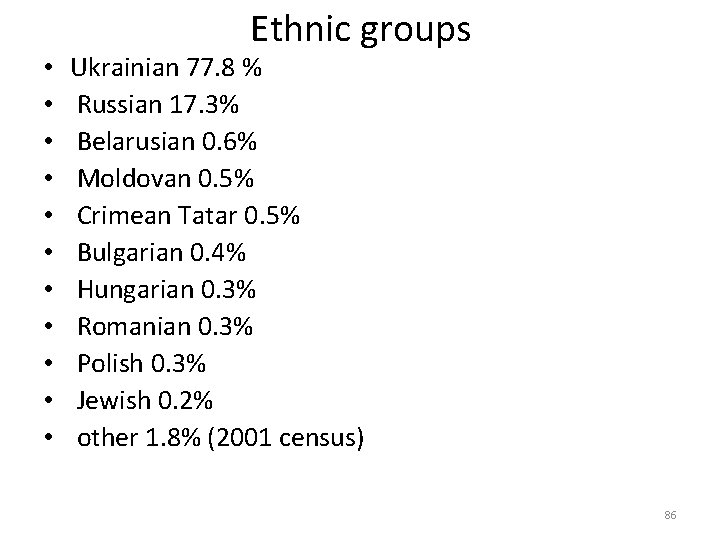
• • • Ethnic groups Ukrainian 77. 8 % Russian 17. 3% Belarusian 0. 6% Moldovan 0. 5% Crimean Tatar 0. 5% Bulgarian 0. 4% Hungarian 0. 3% Romanian 0. 3% Polish 0. 3% Jewish 0. 2% other 1. 8% (2001 census) 86
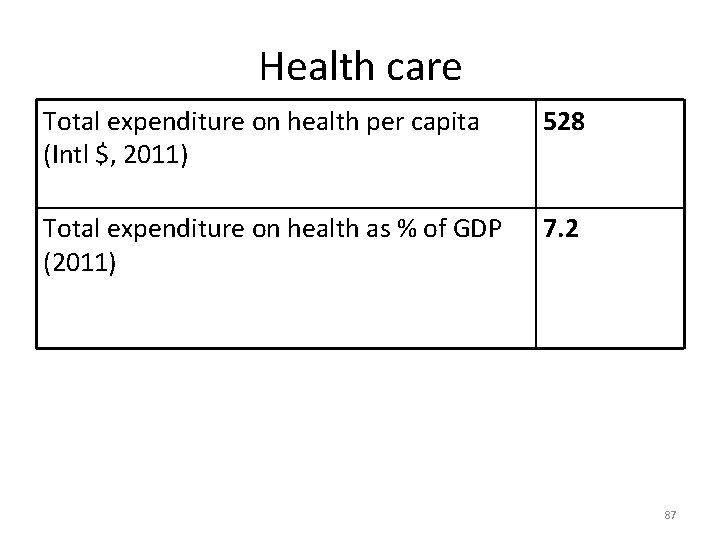
Health care Total expenditure on health per capita (Intl $, 2011) 528 Total expenditure on health as % of GDP (2011) 7. 2 87
- Slides: 87