Bus rapid transit BRT the basics Presentation originally
 – the basics Presentation originally by Dennis Hinebaugh, Director National")
Bus rapid transit (BRT) – the basics Presentation originally by Dennis Hinebaugh, Director National Bus Rapid Transit Institute (NBRTI), University of South Florida http: //www. nbrti. org Presented today by Tom Rye, Edinburgh Napier University

What’s wrong with normal buses? n Slow n Unreliable n Not always frequent n Take the long way around n Uncomfortable n Untrendy, not technologically appealing n Make you feel like a loser if you take one? n BRT – tries to solve these problems

How we treat BRT customers! Well! How we treat local bus customers! Badly!

BRT Systems United States: • Alameda, CA • Albany, NY • Boston, MA • Charlotte, NC • Cleveland, OH • Chicago, IL • Dulles Corridor, VA • Eugene, OR • Hartford, CT World: • Curitiba, Brazil • Brisbane, Australia • Adelaide, Australia • Ottawa, Canada • Leeds, England • Amsterdam • Utrecht • Kent, England • Ipswich, England • Rouen, France • Jonkoping, Sweden

[ It’s no single trait, but the combination of traits that make BRT systems successful! ]

Speed of BRTs in km/h 6

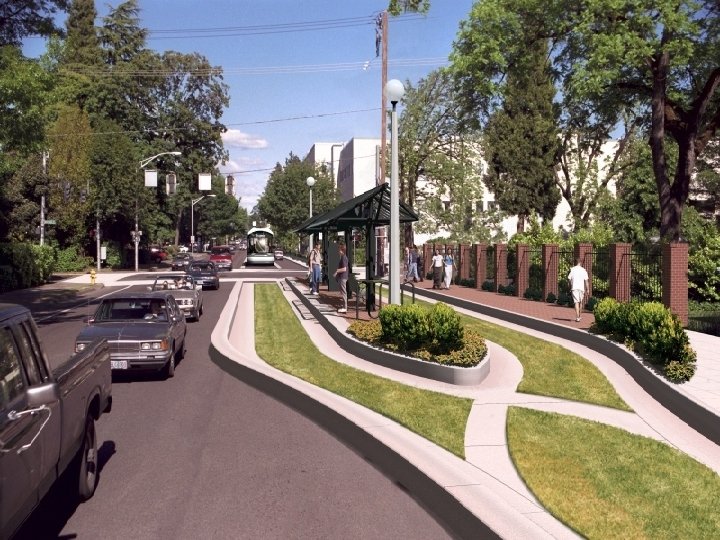
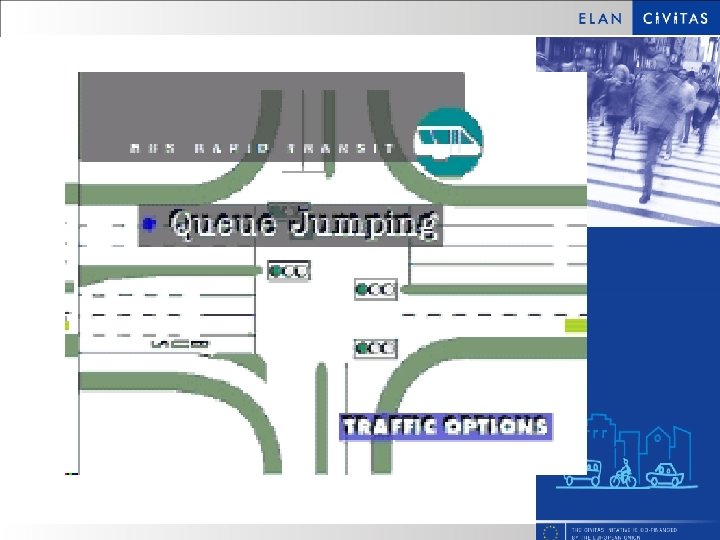
Infrastructure n Needs to give priority to bus n Does not all have to be the same – one BRT can combine different types of priority n Key: ensure speed and reliability – bus protected from other traffic

Arterial Bus Lanes London Quality Bus Corridor Boston: Silver Line

Arterial Median Transitway Vancouver: 98 B

The Balkan BRT – before and after E-5 CEVİZLİBAĞ MEVKİİ ESKİ HALİ E-5 CEVİZLİBAĞ MEVKİİ YENİ HALİ

Running Ways Arterial Median Busway Rouen, France: TEOR

LEEDS/BRADFORD Guided Busways

Elevated Sections Runcorn, UK

Running Way Color, Markings Auckland Paris Sao Paulo
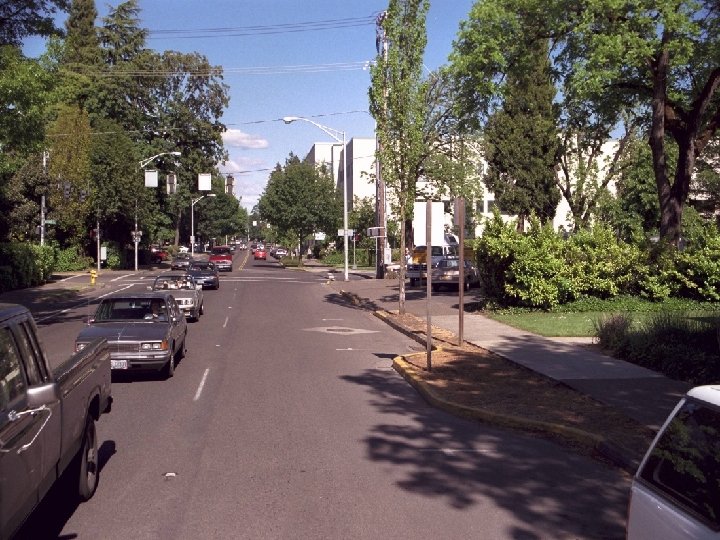

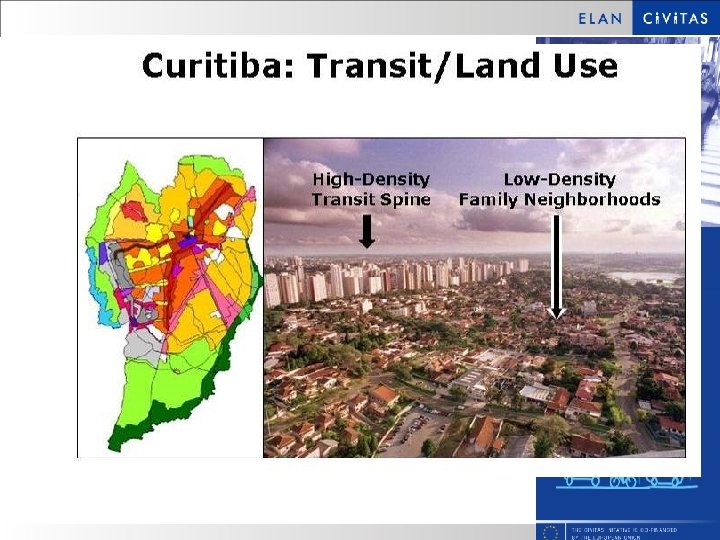
Route Structures • More direct than local service • “Off-line” stations • Anchored by major activity centers • Major corridors • Feeder routes • Can operate in low-density residential • Flexible • High frequency, turn up and go • Effect on Land use • No map

Adelaide, Australia ADELAIDE CBD

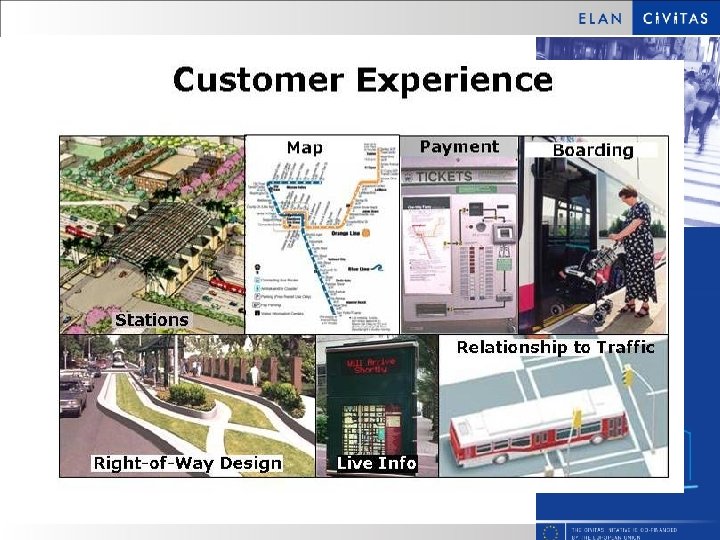
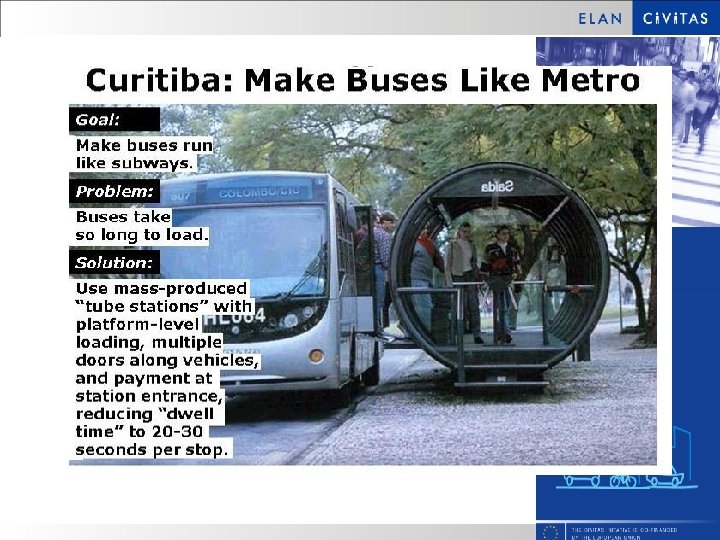
Stations: Potential Characteristics • Differentiated from regular bus stops • Enhanced shelters and/or station design • Designated passenger “platform, ” possibly raised • Enclosed • Can be multi-modal • Other facilities (taxi stands, parking, etc. ) • Customer information (real-time) • Joint-development/multi-use • Facilitates quick boarding and exit • Docking • Disabled accessible

Vehicles • Unique/distinct aesthetic design/look • Environmentally friendly • Variable propulsion systems • High capacity (articulated, bi-articulated) • Wide aisles, increased passenger comfort • Low-floor • Large window design • Increased amenities (laptop connections) • Multiple double-wide doors • Dual-sided entry/exit • LRT like

Range of BRT Vehicle Options: Conventional Buses Van Hool 300 AG Zuidtangent Amsterdam; York Rapid Transit Toronto New Flyer 60 LF Vancouver 98, 99 B Ottawa Transitways

Specialized BRT Vehicles ATS Phileus Eindhoven, Netherlands Irisbus Civis Las Vegas MAX

Well- Lit, Open, Quiet Interior

Los Angeles, CA Signal Preemption and low floor vehicles aided in a: • 28 to 33% decrease in travel time • 30% increase in ridership, 14% net new • No appreciable impact on cross–street traffic

Faster Fare Collection • Fast, efficient so as to speed boarding • Simple to understand • Minimal on-vehicle transactions • Cashless • smart cards (multi-use) • pre-purchased tickets • passes • Proof of payment • enter station

Off–Board Fare Collection Options Proof-of Payment: TVM York, On. Rapid Transit Smart Card Fare Gates Trans. Millenio, Bogota

Cost Effective • Vehicles • can be off-the-shelf • No track or overhead wires • “Travel Ways” • construction and maintenance • incrementally built (phases, flexible) • existing roadway network (mixed traffic) • Uses existing vehicle storage facilities • Uses existing and simple signal systems • Workforce composition • using existing vs. acquiring new staff • wage differential for BRT vs. LRT

Rapid Transit Mode Comparisons Source: Speed. Link- A Rapid Transit Option for Greater Detroit. June 2001.

Rail-Like Vehicles $5 -30 m

Another take on costs

Impacts on ridership, car use n Survey of 14 BRT systems around world n Typically 15 -35% increase in system ridership n 10 -25% of these people transferred from car n Istanbul system carries 500, 000 people/day of whom about 10% came from car. 400% increase in total PT riders n See http: //www. nbrti. org/docs/pdf/Low%20 Re s%20 CBRT%202009%20 Update. pdf

Conclusions • BRT quick to implement – politically attractive • Does not always have to be heavily engineered – can combine a range of infrastructure • Can be implemented incrementally • Ultimately it’s about reliability, directness, convenience, premium service, good image • Low cost, high capacity alternative to rail • Keep It Simple Stupid
- Slides: 36