
BUS 805 D Accounting and Finance for Managers
BUS 805 D: Accounting and Finance for Managers Financial Statement Analysis SEYRAM KAWOR skawor@ucc. edu. gh Slides by Seyram Kawor
Outline Approach to financial statement analysis Vertical analysis/common-size statement Horizontal analysis Ratio analysis Uses of ratios Limitations of ratio analysis
Approaches to financial statement analysis v. The figures presented in the companies annual financial reports are less useful unless users are informed about the fact behind the figures v. These annual financial reports and accounts must then be analysed or interpreted in order to make a general assessment of the entity. The approaches used for the analysis or interpretation of the accounts are �Trend analysis �Horizontal analysis �Vertical Analysis or common-size statement Seyram Kawor
v. Trend analysis involves studying the performance and state of affairs of the entity over certain period of time. v. Horizontal analysis (otherwise known as yearon-year analysis) involves comparing particular year’s results with that of the previous year. v. Vertical analysis deals with expressing each figure in the income statement, and statement of financial position as a percentage of one key figure v Ratio analysis explains the relationship between the figures in the financial statements. Seyram Kawor
Uses of Ratios v. Ratios are used to express the logical relationships which exist between certain items in the financial statements. v. Ratios are also used to assess the overall performance, liquidity position and financial condition of an enterprise over a period as well as with other similar enterprises. v. Ratios provide a better means of comparisons than absolute values of financial or operational measurement. v. It is also useful in summarising the information contained in financial statements and in directing the Seyram Kawor user’s attention to certain key areas which may vary
Types of ratios The following are the major types of accounting ratios: v. Profitability ratios v. Liquidity ratios v. Activity ratios v. Leverage ratios v. Investment ratios Seyram Kawor
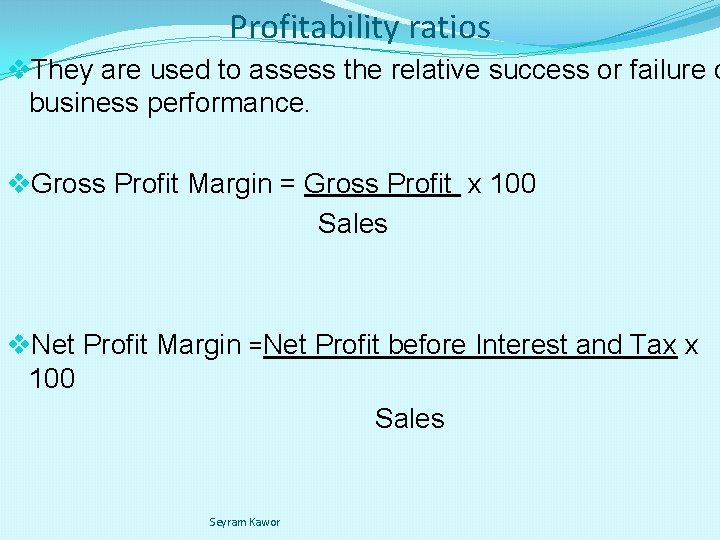
Profitability ratios v. They are used to assess the relative success or failure o business performance. v. Gross Profit Margin = Gross Profit x 100 Sales v. Net Profit Margin =Net Profit before Interest and Tax x 100 Sales Seyram Kawor
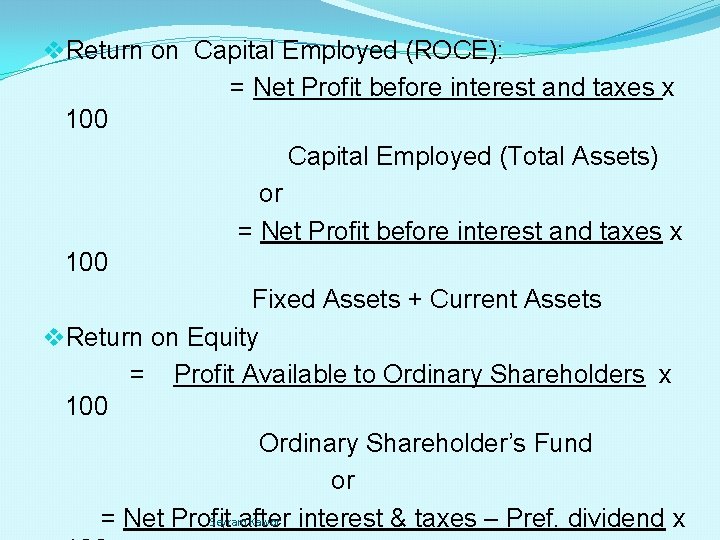
v. Return on Capital Employed (ROCE): = Net Profit before interest and taxes x 100 Capital Employed (Total Assets) or = Net Profit before interest and taxes x 100 Fixed Assets + Current Assets v. Return on Equity = Profit Available to Ordinary Shareholders x 100 Ordinary Shareholder’s Fund or Seyram Kawor = Net Profit after interest & taxes – Pref. dividend x
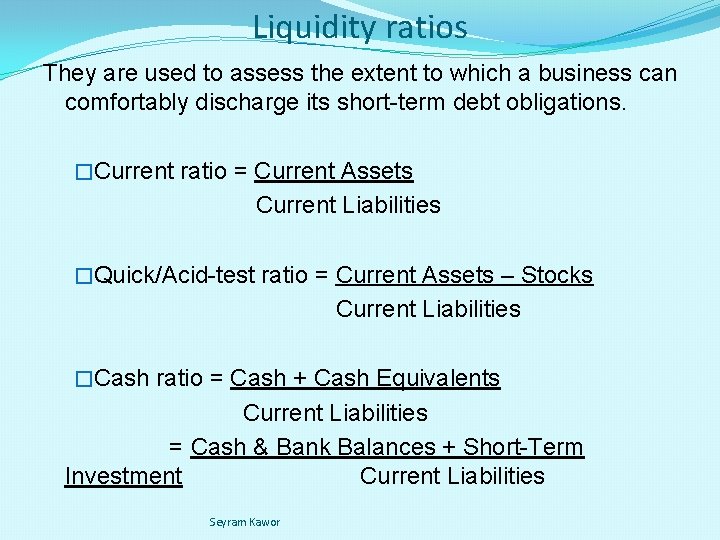
Liquidity ratios They are used to assess the extent to which a business can comfortably discharge its short-term debt obligations. �Current ratio = Current Assets Current Liabilities �Quick/Acid-test ratio = Current Assets – Stocks Current Liabilities �Cash ratio = Cash + Cash Equivalents Current Liabilities = Cash & Bank Balances + Short-Term Investment Current Liabilities Seyram Kawor
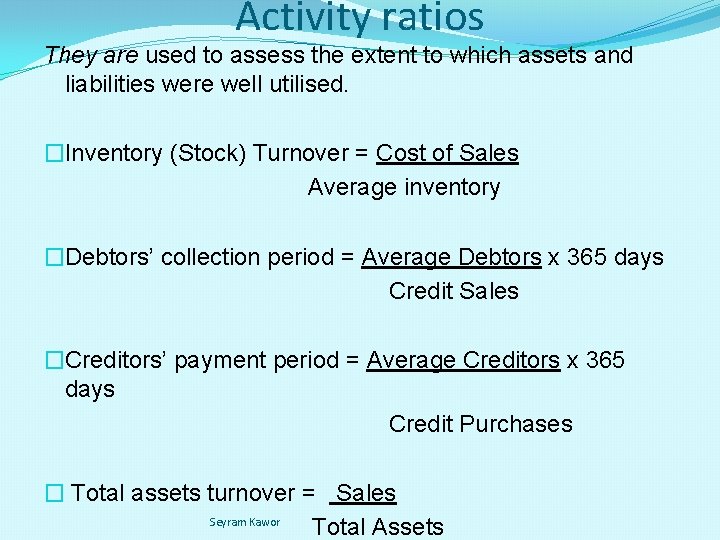
Activity ratios They are used to assess the extent to which assets and liabilities were well utilised. �Inventory (Stock) Turnover = Cost of Sales Average inventory �Debtors’ collection period = Average Debtors x 365 days Credit Sales �Creditors’ payment period = Average Creditors x 365 days Credit Purchases � Total assets turnover = Sales Seyram Kawor Total Assets
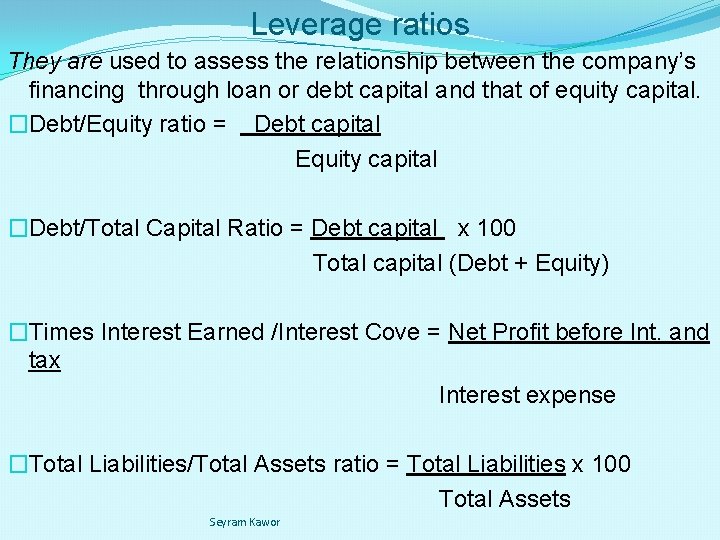
Leverage ratios They are used to assess the relationship between the company’s financing through loan or debt capital and that of equity capital. �Debt/Equity ratio = Debt capital Equity capital �Debt/Total Capital Ratio = Debt capital x 100 Total capital (Debt + Equity) �Times Interest Earned /Interest Cove = Net Profit before Int. and tax Interest expense �Total Liabilities/Total Assets ratio = Total Liabilities x 100 Total Assets Seyram Kawor
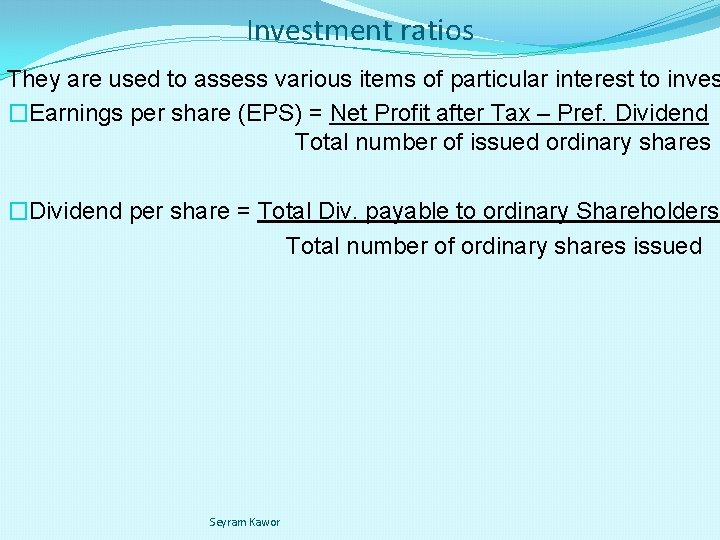
Investment ratios They are used to assess various items of particular interest to inves �Earnings per share (EPS) = Net Profit after Tax – Pref. Dividend Total number of issued ordinary shares �Dividend per share = Total Div. payable to ordinary Shareholders Total number of ordinary shares issued Seyram Kawor
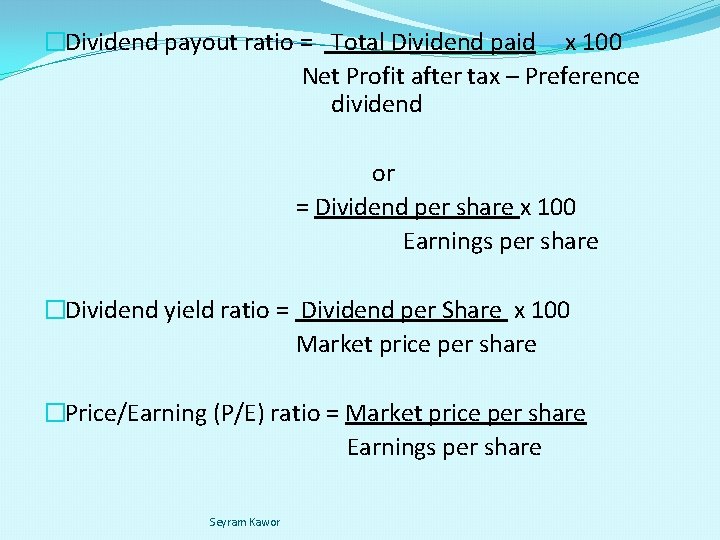
�Dividend payout ratio = Total Dividend paid x 100 Net Profit after tax – Preference dividend or = Dividend per share x 100 Earnings per share �Dividend yield ratio = Dividend per Share x 100 Market price per share �Price/Earning (P/E) ratio = Market price per share Earnings per share Seyram Kawor
Limitations of accounting ratios v. Financial statements, from which the ratios are computed, are prepared on the historical cost basis. v. This means that the financial statements are records of what has happened in the past. However, users of financial statements require analysis of the statements to make decisions which pertain to the future. Clearly, this is a limitation. Seyram Kawor
v. Accounting does not record events and transactions unless such events and transactions are of a financial nature. However, there are certain events which are non-financial in nature but are none the less important for the survival of the company. E. g. the morale of workers, team spirit, etc. Even though such non-financial events are important, they are not reflected in the financial statement analysis. Seyram Kawor
v Different businesses may use different accounting policies, making comparisons difficult. v When much attention is attached to an individual ratio, it might distort the whole picture. Rather ratios should be viewed in association with others. v Financial statements analysis may be distorted by a “one off” large transaction; such as transactions occurring at year end. There is also the possibility of ‘window dressing’. � Calculation of ratios may become an end in itself rather than a means to an end, and this can obscure important features which are only discovered from a scrutiny of the financial statements. � Care must be taken in the case of analysing a seasonal business as this might give false impressions of say the liquidity ratio and stock turnover ratio. � � The formulas for computing the ratios are varied and sometimes it becomes difficult to decide which formula to use, if a clear guideline is not given. � Seyram Kawor

End of Lecture Thank you seyram kawor Seyram Kawor
- Slides: 17