Building PBIS Fluency Using PBIS Fidelity Tools TFI
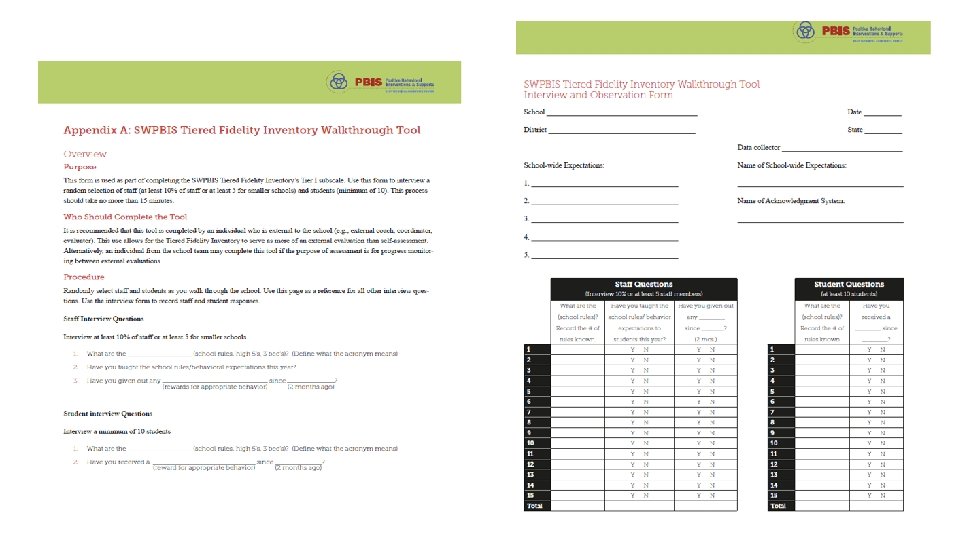
 You will be")
Building PBIS Fluency Using PBIS Fidelity Tools (TFI, SAS, School Climate) You will be muted during this session, except during breakouts. Need help? Type into the chat box Presented by the VTPBIS State Team This session will be recorded. If you’d like to access the recording, please email anne. dubie@uvm. edu. Materials can be found at: https: //www. pbisvermont. org/training-resources/webinars/

Learning Objectives Acknowledging Establishing Understanding and accessing Exploring Putting Acknowledging our context Establishing outcomes for action planning Understanding and accessing the TFI and SAS Exploring the School Climate Survey Putting it all together for Action Planning

Lean On Your Framework PBIS has meant the world to us as we have made the transition back to in-person learning. I have said a million times over the past 3 months that PBIS provides a perfect framework for us to articulate, teach, practice, and reinforce all of these new routines in our buildings. - Matt Young, Principal, Peoples Academy Middle School

Supporting Staff Behavior OUTCOMES Systems Data Practices Supporting Student Behavior Supporting Decision Making
 and")
Context: • VTPBIS schools are asked to complete the Tiered Fidelity Inventory (TFI) and Self. Assessment Survey (SAS) every year between January and March. • Schools implementing PBIS with fidelity will be better able to integrate MH supports and resources. • The impacts of this year’s disruptions on individual teachers, students and families is unknown, making it essential to expand the data used to guide social/emotional/behavioral learning and well-being. • Collecting robust data on perceptions of school climate can be used to ensure students and teachers are feeling connected and engaged in their learning environments, despite the disruptions.

Big Ideas About Data • All data should serve a purpose • Collect data with fidelity • Be prompt about looking at data and acting upon it • Use multiple sources of data to confirm what you see • Use data to support, not punish

Start with Outcomes How will you know if PBIS is working if you are not sure where it should be taking you?

Locally determined What Are Your Outcomes? Outcomes should be: Consider using a “SMART Goal Format” Contextually and culturally relevant Observable and measurable Summarized in goal statements
 • Reduce bullying •")
Sample Outcomes • Reduce problem behaviors (from ODRs or BODFs) • Reduce bullying • Increase attendance/engagement • Improve school climate • Improve fidelity of interventions • Improve academic scores • Increase supports from community partners

Sample Outcome Statements “Given school-wide implementation of PBIS with fidelity, we will decrease the number of student suspensions and expulsions by 10% by the end of the school year. ” “As a result of completing a school climate survey for staff, students, and family members, improvements in three priority areas will be made by the end of the year. ”

Types of Data to Consider Intensive: • TFI • I-SWIS • EST • FBA/BSP • ISF-II Targeted: • TFI • SWIS-CICO • EST • FBA/BSP • Universal Screening • ISF-II Universal: • TFI • SAS • SWIS • Attendance • Grades • Leadership Team Self. Assessment • School Climate • Family Engagement • ISF-II

Data help us ask the right questions. They do not provide the answers.
 Will Help Your Team Get to Outcomes")
The Tiered Fidelity Inventory (TFI) Will Help Your Team Get to Outcomes

TFI • What? An efficient and effective validated measure to assess fidelity of core PBIS features at all 3 tiers – Teams, Implementation and Evaluation • Why? To guide and sustain effective implementation of PBIS • When? Expectation is once a year for all schools • Window open January 1 st - March 31 st (for TFI and SAS) • Consider completing TFI more than once to monitor/assess progress • Contact Anne Dubie if you would like your window opened • Teams should anticipate 30 minutes to complete each tier’s assessment the first time

Uses of the TFI • Formative Assessment • Determine current PBIS practices in place and needed prior to launching implementation • Progress Monitoring • Self-assess PBIS practices by tier to guide implementation efforts and assess progress by tier • Build action plan to focus implementation efforts • Annual Self-Assessment • Facilitate sustained implementation of PBIS • State Recognition • Determine schools warranting recognition for their fidelity of PBIS implementation

Tier 1: Team - Big Ideas: • Teams need people with multiple skills and perspectives to implement PBIS well. • Specific features are necessary to ensure meetings are effective for action planning and tracking progress.

Tier 1: Implementation – Big Ideas: • Identifying behavioral expectations and teaching them • Operational definitions for problem behavior and consistent responses improve the predictability of social expectations • The key is staff consistency • PBIS expectations and consequences integrated into classroom systems • Students will sustain positive behavior if there are formal systems with strategies for rewarding and re-teaching appropriate behavior • Actively engage families, students, and faculty

Tier 1: Evaluation – Big Ideas: • Teams need the right information at the right time to make effective decisions. • Measuring fidelity data is essential for maintaining effective implementation of PBIS. • Implementation of Tier 1 is likely more sustainable if the Team self-assesses at least annually AND reports this data to key stakeholders.

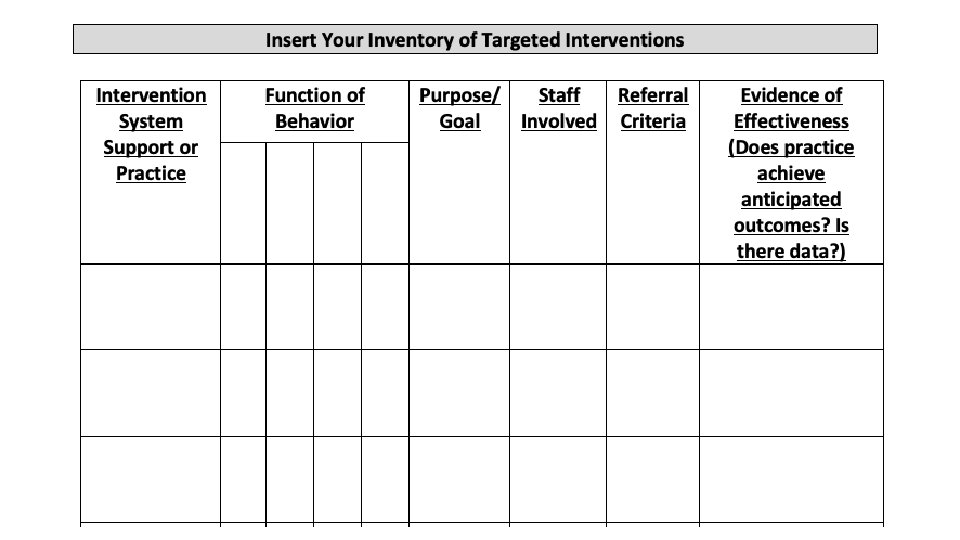
TFI Item 2. 5: Options for Tier II Interventions Feature Possible Data Sources Scoring Criteria Options for Tier 2 Interventions: • School Tier 2 handbook 0 = No Tier 2 interventions with documented evidence of effectiveness are in use Tier 2 team has multiple ongoing behavior support interventions with documented evidence of effectiveness matched to student need. • Targeted Interventions Reference Guide (aka Targeted Inventory) 1 = Only 1 Tier 2 intervention with documented evidence of effectiveness is in use 2 = Multiple Tier 2 interventions with documented evidence of effectiveness matched to student need

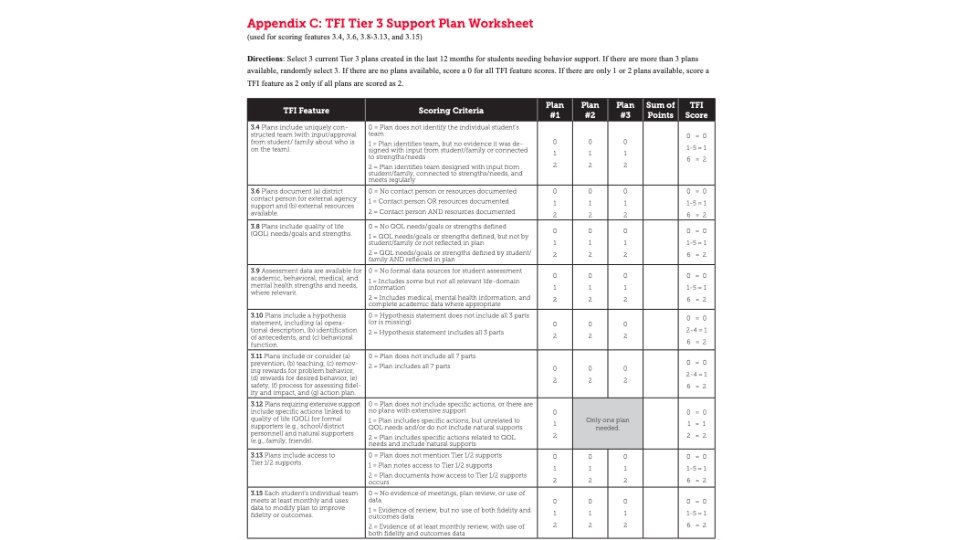
3. 4 Student Support Team Feature Possible Data Sources Student Support Team: § Scoring Criteria Three randomly selected 0 = Individual student support teams do not exist for all students Tier III student support For each individual student who need them. plans developed in the support plan, a uniquely 1 = Individual student support past 12 months (see constructed team exists (with teams exist, but are not uniquely Appendix C: TFI Tier III input/approval from Main Support Plan. Idea: Worksheet) designed with input from student/family about who is student/family and/or team Each student receiving Tier III supports on the team) to design, membership has partial connection team strengths and needs. implement, monitor, andbenefits from having an individualized to adapt the student-specific comprised of relevant stakeholders. 2 = Individual student support plan. teams exist, are uniquely designed with active input/approval from student/family (with a clear link of team membership to student strengths and needs), and meet regularly to review progress data.

Example Subscale Report

After Assessment Analyze data: • Total score report • Subscale report (broken down by tier) • Sub-sub scale report (broken down by components) • Individual items report • Celebrate your 2’s, examine your 0’s and 1’s

Action Planning Form

TFI Activity for Implementation and Evaluation • Access and review your most recent TFI results • Identify a small number of items (1 -3) that may need improvement • Ask: “What are the smallest changes that can be made to improve implementation? ” • Problem solve any challenges • Record the strategies you like on TFI Action Plan template
 Purpose: Assess staff perceptions of PBIS practices in place and priority")
Self-Assessment Survey (SAS) Purpose: Assess staff perceptions of PBIS practices in place and priority for changes Design annual action plan Format: Survey Completed by: All staff Manual or on-line scoring, graphing When? Annually, preferably in the spring 28

Two main questions: 1. What systems are in place now? 2. What systems are most in need of improvement?

To Take the SAS… 30

Total Score:

Subscale:

Items:

Why Schools like the SAS: • Honors the input of all staff • Perceptions are important • Used in action planning • Reporting out to staff about priorities for change based on their feedback contributes to buy-in

Introducing the PBIS School Climate Survey
")
School Climate Survey – What? Four Surveys: • Students (grades 3 -5; 11 questions) • Students (grades 6 -12; 9 questions) • Measures based on school connectedness, school safety, school orderliness, and peer/adult relationships • Staff (29 questions) • Measures connectedness, structure of learning, school safety, physical environment, peer and adult relationships, and parental involvement • Family Members (21 questions) • Measures teaching and earning, school safety, interpersonal relationships, institutional environment, parent involvement

School Climate Survey – Benefits • Efficiency and ease of access • Multiple perspectives • Capacity for comparison across participants (gender, grade, race/ethnicity), time, settings, and more! • Adaptability

School Climate Survey Readiness • Parent Permission/opt out • Introduction to Surveys • Plan for Reviewing Results and Action Planning

Sample Survey - Elementary

Sample Survey - Elementary

Reports for Students

Reports for School Personnel and Families

Subscale Reports – Families and School Personnel

School Climate Survey Scoring

Sample Reports – Total Scores

Report by Items – Highs and Lows

Items Reports for Details

Moving to Action Planning

Action Planning

Putting it All Together

Formulate Questions Before Looking at Data • What are key subgroups in your setting? • What themes or major problems are you most concerned about? • What do you predict based on what you know?

Examine Overall Patterns • Patterns between groups • Patterns within groups • Patterns across time

Examine PBIS data alongside School Climate data to clarify picture • How do data from one area inform, explain, clarify complementary data? Out-of-school suspensions have increased for ELL students and ELL students report the lowest perceptions on adult-peer relations

Create Data-Informed Action Steps • Celebrate strengths • Target concerns/areas for growth

Dissemination Presentation Suggestions and Activities

Disseminating Data: Use Data as a Story. Telling Device • What data are you collecting? • What questions can you answer with this data? (remember proposed outcomes) • Who is your targeted audience for your story? • How could you display the data to convey the story of PBIS? REMEMBER! Before we can measure success, we must define success!

Create an Infographic or Brief Power Point Presentation! • Simple is better! • Start with one graph or table and some descriptive text See Staff Presentation Template in Materials

What are your Questions?
- Slides: 58