
Build your own Super Model Darren Gosbell Power

Build your own Super Model Darren Gosbell Power. BIWorld. Tour. com #PBIWorld. Tour
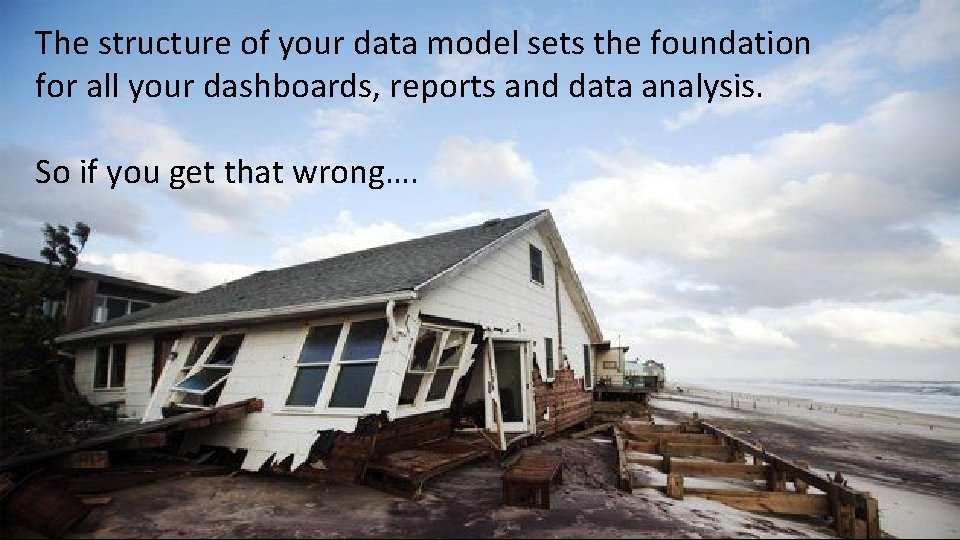
The structure of your data model sets the foundation for all your dashboards, reports and data analysis. So if you get that wrong…. Power. BIWorld. Tour. com #PBIWorld. Tour
Build your own Supermodel The goal of this session is for you to understand the “ 4 chords” of building an analytical data model. Power. BIWorld. Tour. com #PBIWorld. Tour
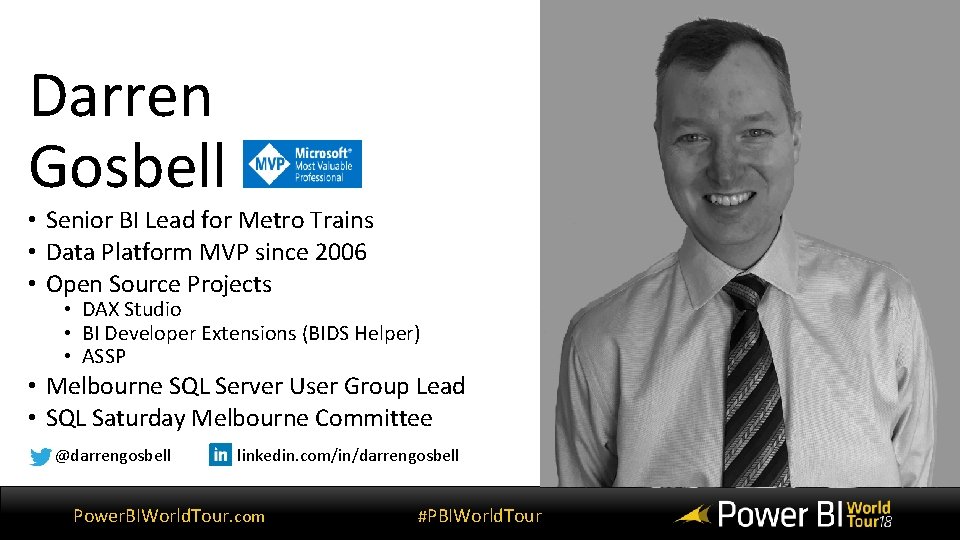
Darren Gosbell • Senior BI Lead for Metro Trains • Data Platform MVP since 2006 • Open Source Projects • DAX Studio • BI Developer Extensions (BIDS Helper) • ASSP • Melbourne SQL Server User Group Lead • SQL Saturday Melbourne Committee @darrengosbell linkedin. com/in/darrengosbell Power. BIWorld. Tour. com #PBIWorld. Tour

Build your own Supermodel The “ 4 chords” of data modelling involves understanding: • different types of Schemas • the “grain” of you data • how to handle changes over time • different relationship types Power. BIWorld. Tour. com #PBIWorld. Tour
Understanding Schema Power. BIWorld. Tour. com #PBIWorld. Tour
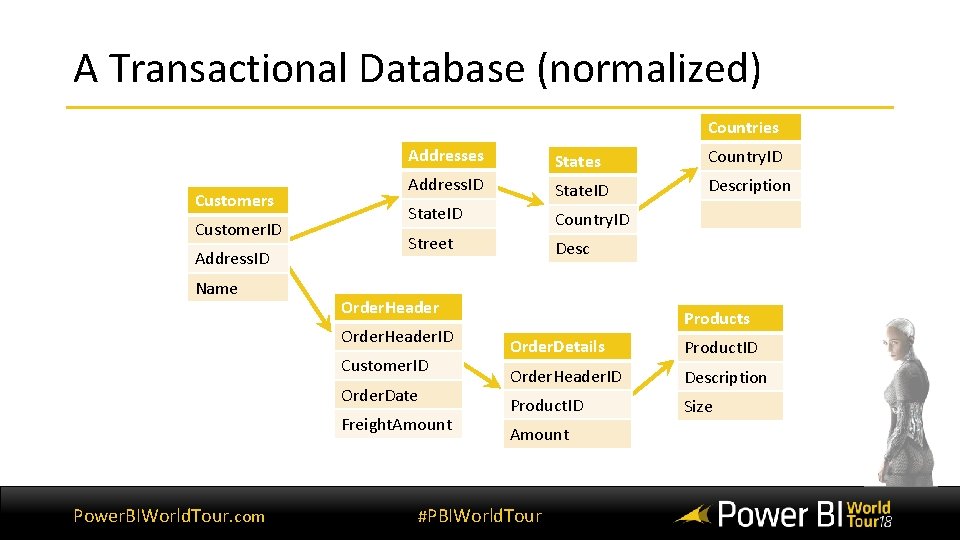
A Transactional Database (normalized) Countries Customer. ID Address. ID Name Addresses States Country. ID Address. ID State. ID Description State. ID Country. ID Street Desc Order. Header. ID Customer. ID Order. Date Freight. Amount Power. BIWorld. Tour. com Products Order. Details Product. ID Order. Header. ID Description Product. ID Size Amount #PBIWorld. Tour
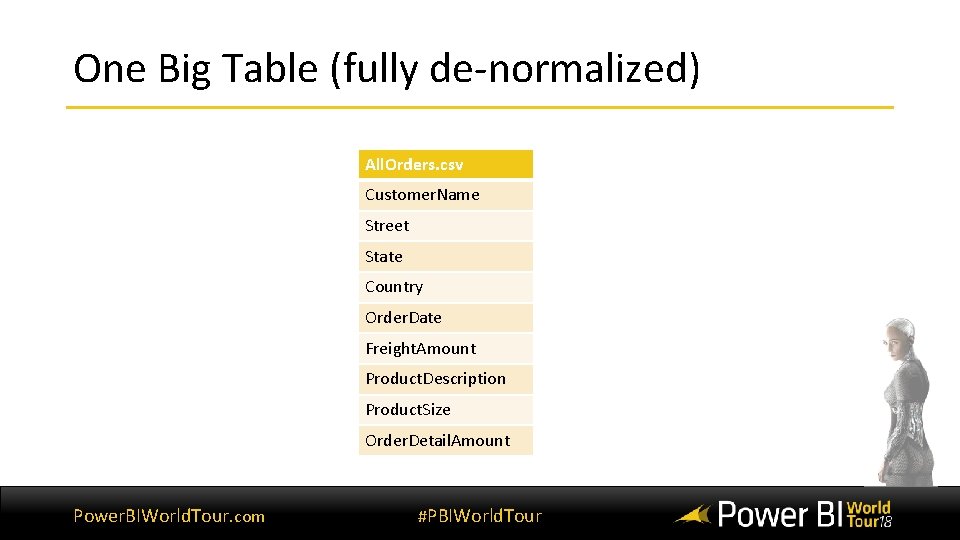
One Big Table (fully de-normalized) All. Orders. csv Customer. Name Street State Country Order. Date Freight. Amount Product. Description Product. Size Order. Detail. Amount Power. BIWorld. Tour. com #PBIWorld. Tour
Demo: One Big Table Power. BIWorld. Tour. com #PBIWorld. Tour

A Dimensional Model Customers Customer. ID Time Name Time. ID Street Date Sales Month Customer. ID Quarter Product. ID Year Time. ID Products Sales. Amount Product. ID State Country Description Size Subcategory Category Power. BIWorld. Tour. com #PBIWorld. Tour

What is a Dimensional Model? • A De-normalized database. • Designed for ease of querying, not for transactional updates. • Built to support aggregate queries • Modelled around business subject areas. Power. BIWorld. Tour. com #PBIWorld. Tour
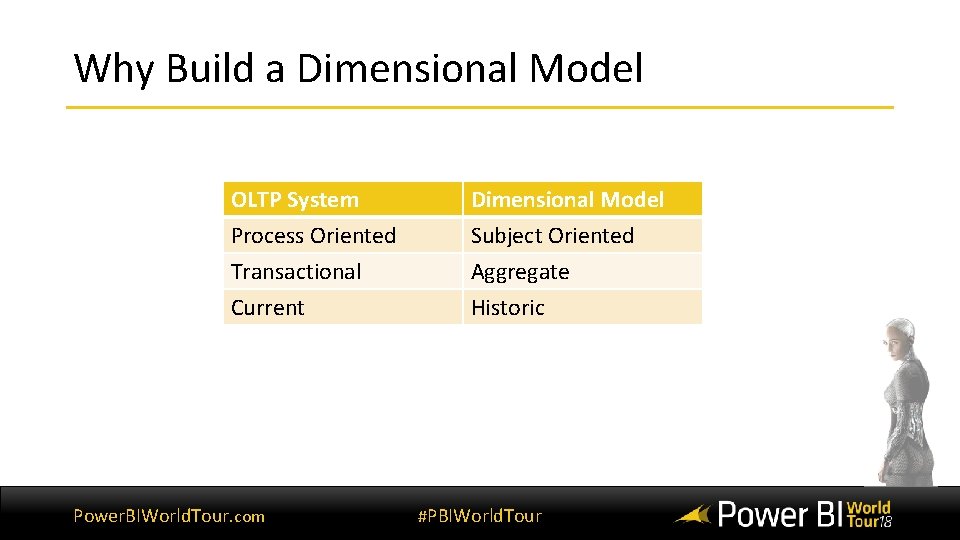
Why Build a Dimensional Model OLTP System Process Oriented Transactional Current Power. BIWorld. Tour. com Dimensional Model Subject Oriented Aggregate Historic #PBIWorld. Tour
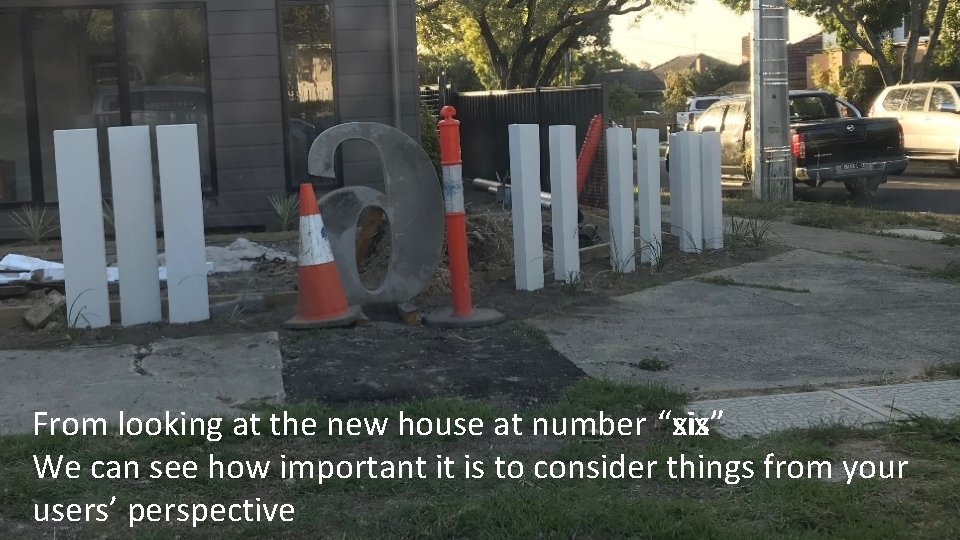
From looking at the new house at number “six” “xis” We can see how important it is to consider things from your users’ perspective Power. BIWorld. Tour. com #PBIWorld. Tour
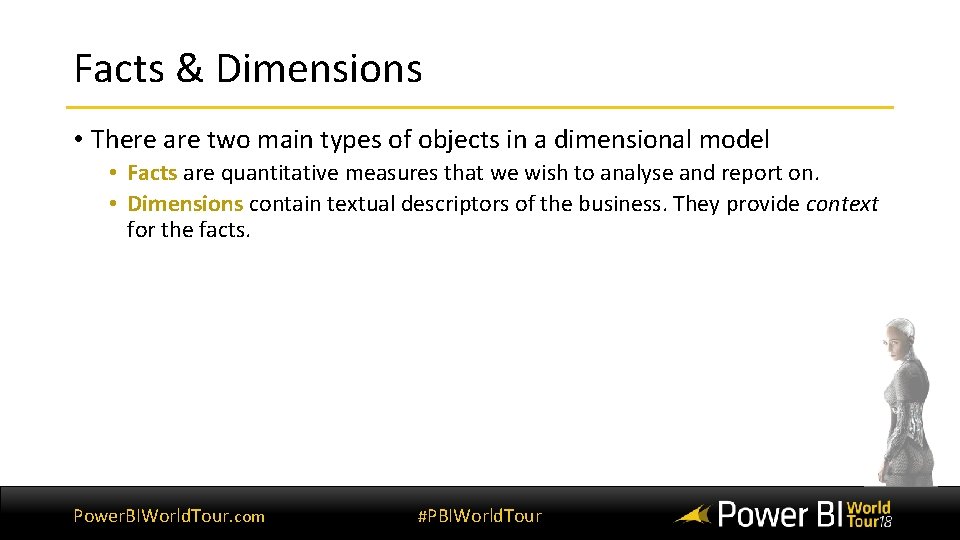
Facts & Dimensions • There are two main types of objects in a dimensional model • Facts are quantitative measures that we wish to analyse and report on. • Dimensions contain textual descriptors of the business. They provide context for the facts. Power. BIWorld. Tour. com #PBIWorld. Tour
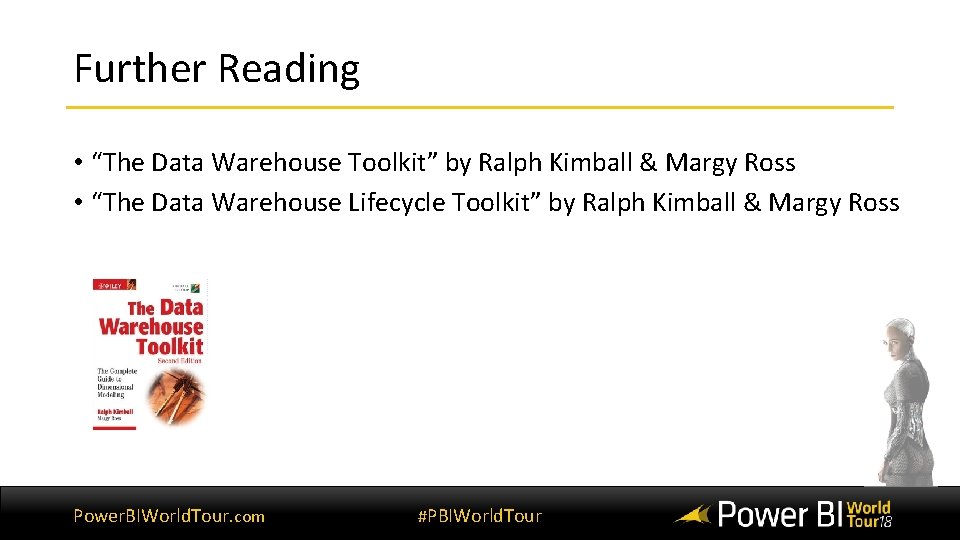
Further Reading • “The Data Warehouse Toolkit” by Ralph Kimball & Margy Ross • “The Data Warehouse Lifecycle Toolkit” by Ralph Kimball & Margy Ross Power. BIWorld. Tour. com #PBIWorld. Tour
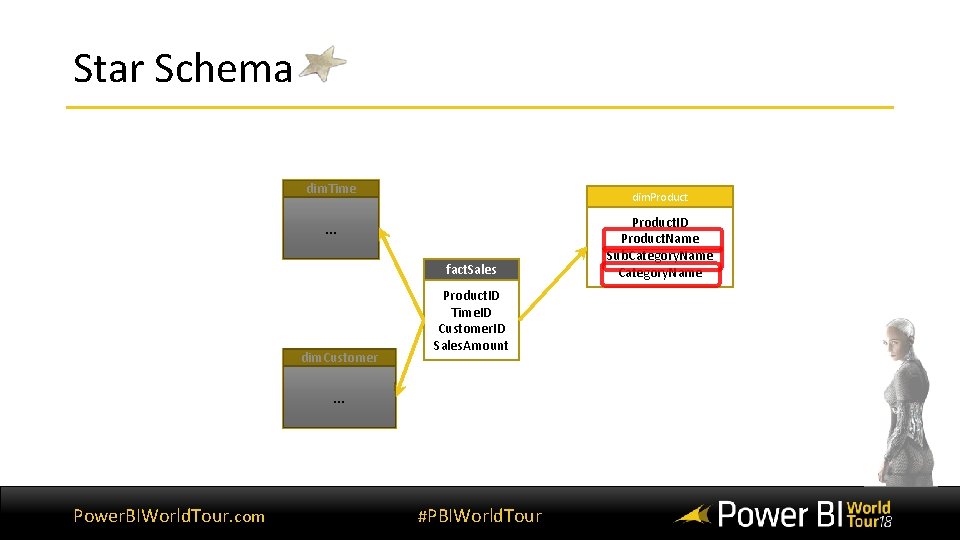
Star Schema dim. Time dim. Product … fact. Sales dim. Customer Product. ID Time. ID Customer. ID Sales. Amount … Power. BIWorld. Tour. com #PBIWorld. Tour Product. ID Product. Name Sub. Category. Name
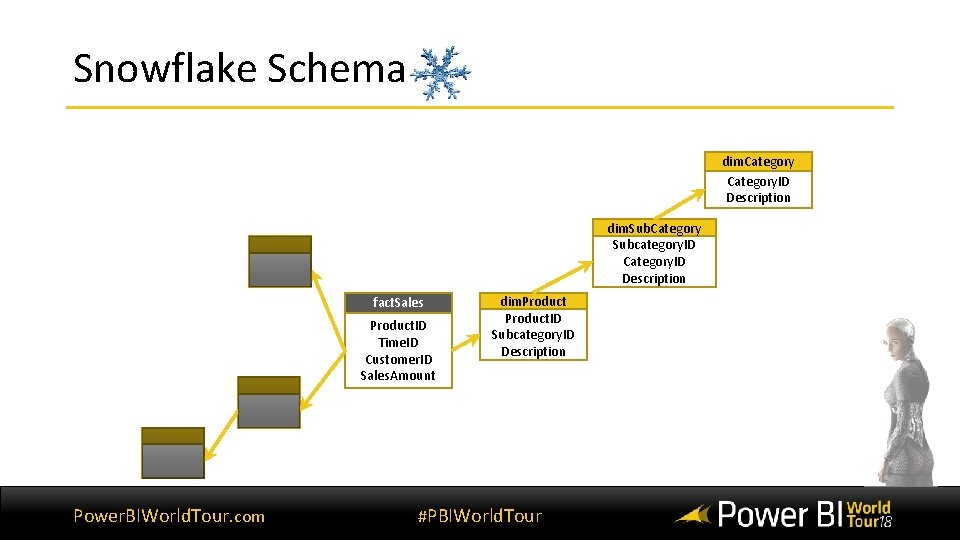
Snowflake Schema dim. Category. ID Description dim. Sub. Category Subcategory. ID Category. ID Description fact. Sales Product. ID Time. ID Customer. ID Sales. Amount Power. BIWorld. Tour. com dim. Product. ID Subcategory. ID Description #PBIWorld. Tour
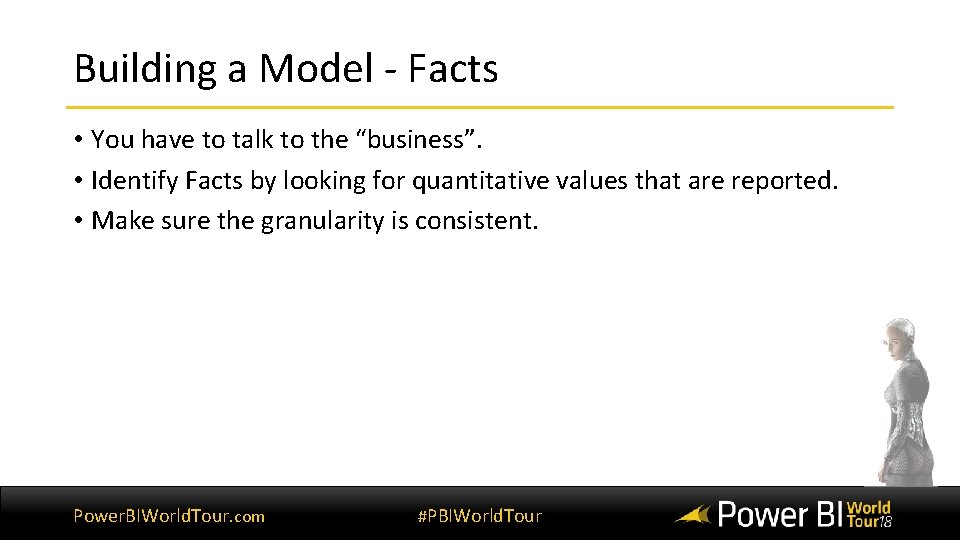
Building a Model - Facts • You have to talk to the “business”. • Identify Facts by looking for quantitative values that are reported. • Make sure the granularity is consistent. Power. BIWorld. Tour. com #PBIWorld. Tour
Understanding Grain Power. BIWorld. Tour. com #PBIWorld. Tour
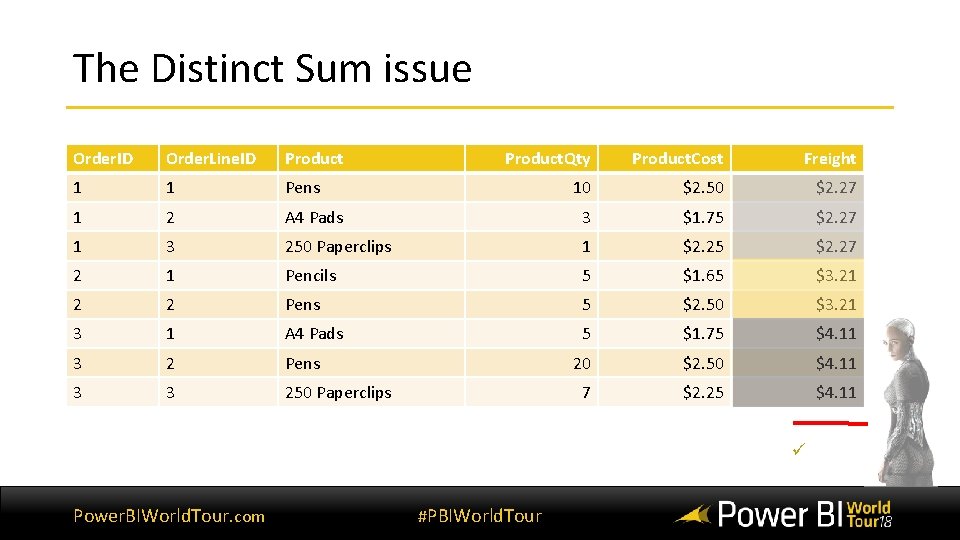
The Distinct Sum issue Order. ID Order. Line. ID Product. Qty Product. Cost Freight 1 1 Pens 10 $2. 50 $2. 27 1 2 A 4 Pads 3 $1. 75 $2. 27 1 3 250 Paperclips 1 $2. 25 $2. 27 2 1 Pencils 5 $1. 65 $3. 21 2 2 Pens 5 $2. 50 $3. 21 3 1 A 4 Pads 5 $1. 75 $4. 11 3 2 Pens 20 $2. 50 $4. 11 3 3 250 Paperclips 7 $2. 25 $4. 11 $29. 67 ü $9. 59 Power. BIWorld. Tour. com #PBIWorld. Tour
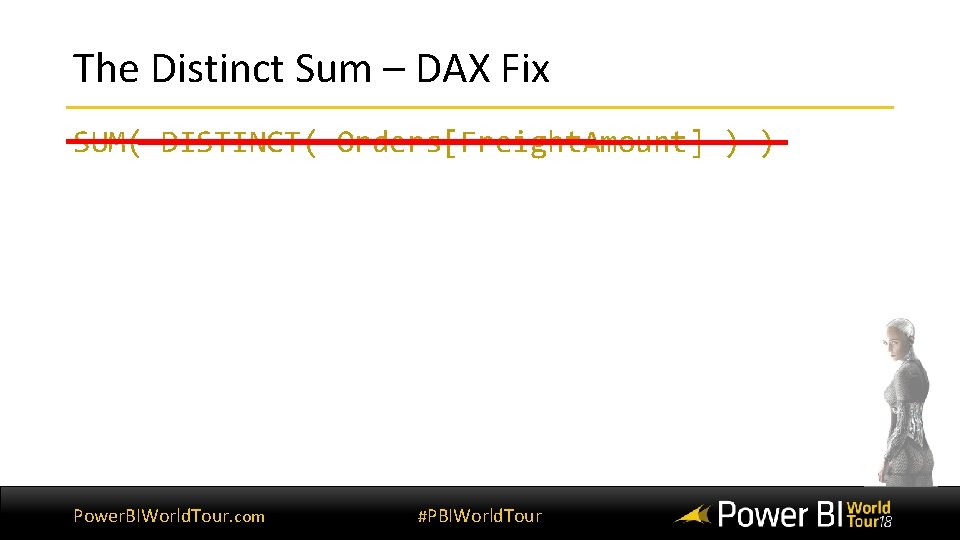
The Distinct Sum – DAX Fix SUM( DISTINCT( Orders[Freight. Amount] ) ) Power. BIWorld. Tour. com #PBIWorld. Tour
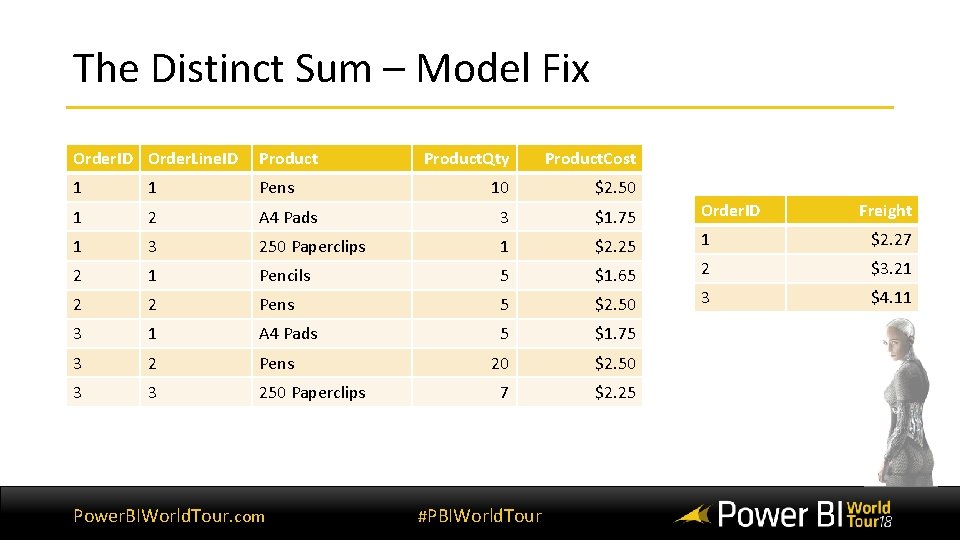
The Distinct Sum – Model Fix Order. ID Order. Line. ID Product. Qty Product. Cost 1 1 Pens 10 $2. 50 1 2 A 4 Pads 3 $1. 75 Order. ID 1 3 250 Paperclips 1 $2. 25 1 $2. 27 2 1 Pencils 5 $1. 65 2 $3. 21 2 2 Pens 5 $2. 50 3 $4. 11 3 1 A 4 Pads 5 $1. 75 3 2 Pens 20 $2. 50 3 3 250 Paperclips 7 $2. 25 Power. BIWorld. Tour. com #PBIWorld. Tour Freight
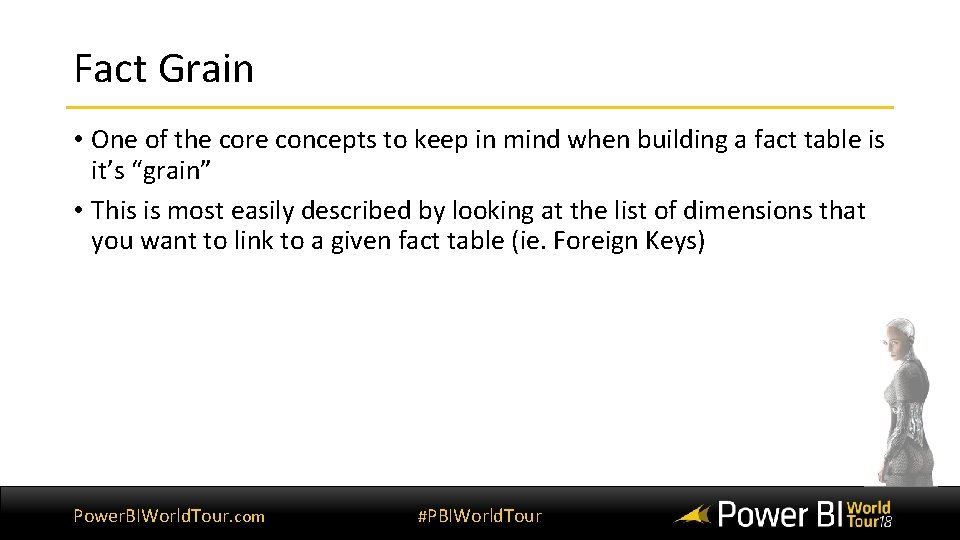
Fact Grain • One of the core concepts to keep in mind when building a fact table is it’s “grain” • This is most easily described by looking at the list of dimensions that you want to link to a given fact table (ie. Foreign Keys) Power. BIWorld. Tour. com #PBIWorld. Tour
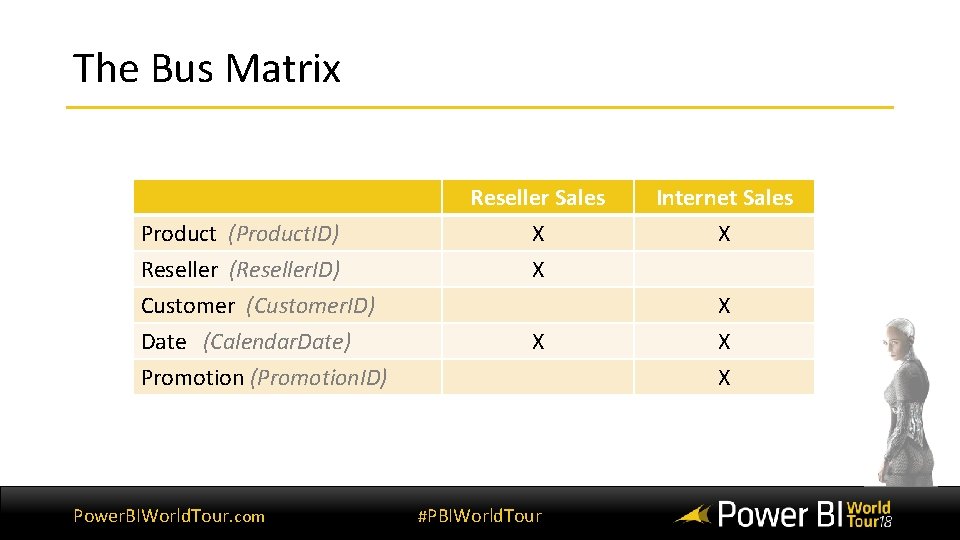
The Bus Matrix Product (Product. ID) Reseller (Reseller. ID) Customer (Customer. ID) Date (Calendar. Date) Promotion (Promotion. ID) Power. BIWorld. Tour. com Reseller Sales X X Internet Sales X X X #PBIWorld. Tour X X
Building a Model - Dimensions • Identify Dimensions by listening for “by” words. • Look for related attributes that should be part of a single dimension. • Pay attention to how “Dimensions” change over time and in relation to each other. Power. BIWorld. Tour. com #PBIWorld. Tour
Handling changes over time Power. BIWorld. Tour. com #PBIWorld. Tour
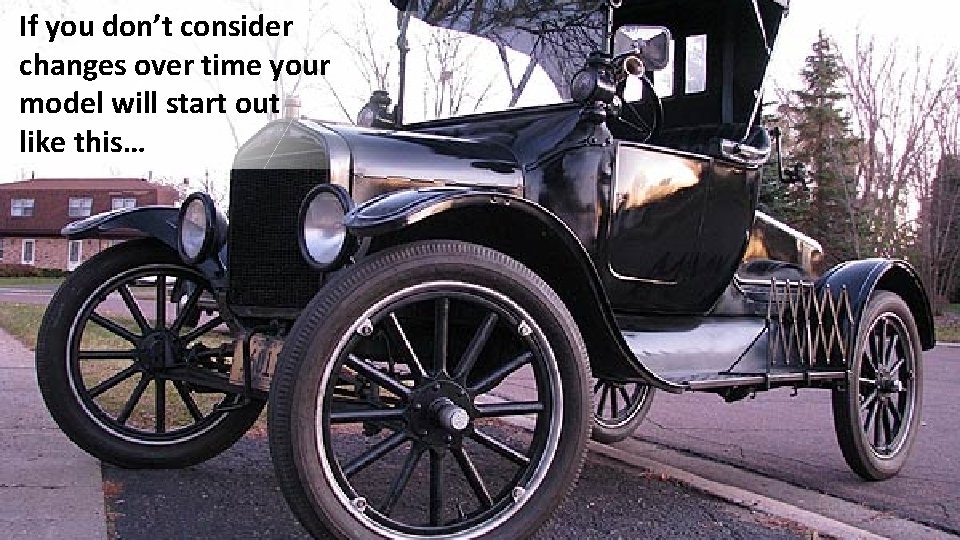
If you don’t consider changes over time your model will start out like this… Power. BIWorld. Tour. com #PBIWorld. Tour
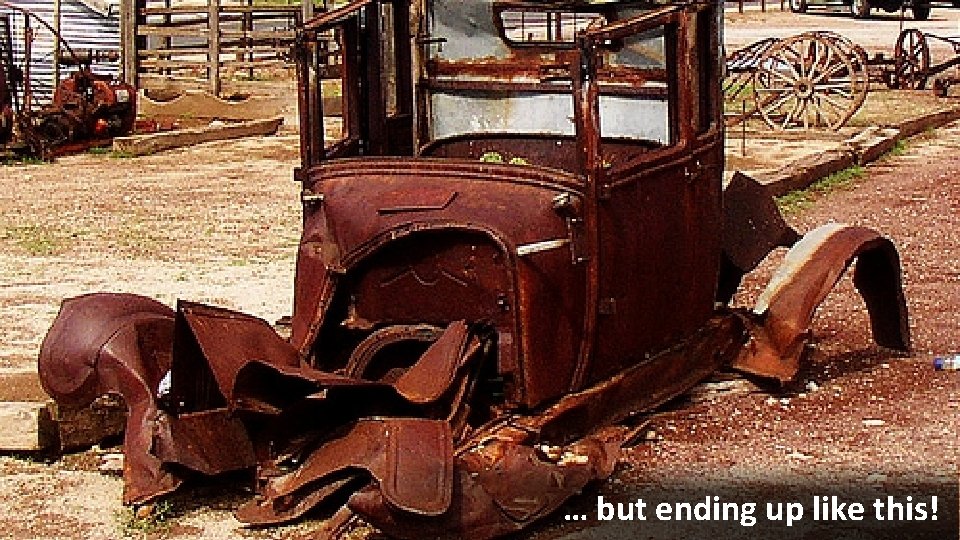
Power. BIWorld. Tour. com #PBIWorld. Tour … but ending up like this!
Type 1 Slowly Changing Dimension • The simplest form • Only updates existing records • Overwrites history Power. BIWorld. Tour. com #PBIWorld. Tour
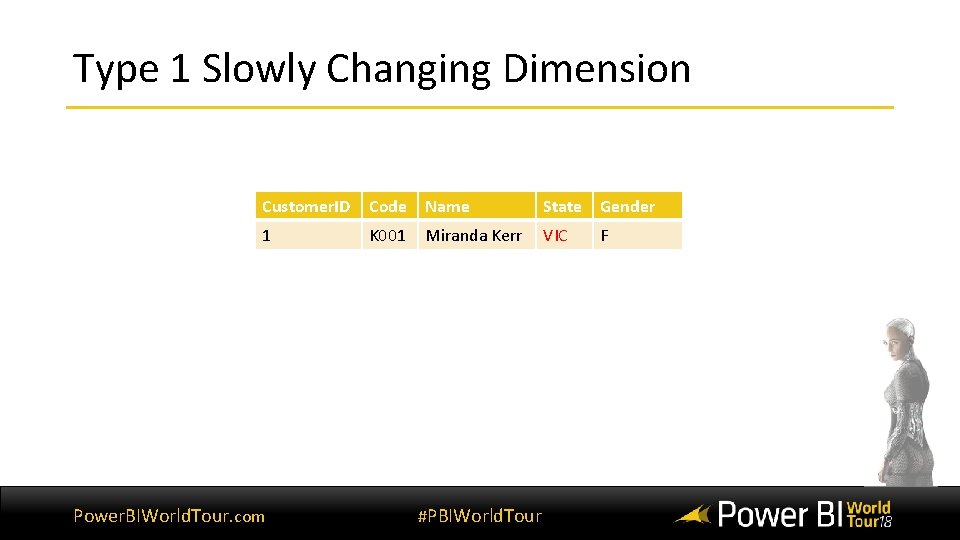
Type 1 Slowly Changing Dimension Customer. ID Code Name State Gender 1 K 001 Miranda Kerr NSW VIC Power. BIWorld. Tour. com #PBIWorld. Tour F
Type 2 Slowly Changing Dimension • Allows the recording of changes of state over time • Generates a new record each time the state changes • Usually requires the use of effective dates when joining to facts. Power. BIWorld. Tour. com #PBIWorld. Tour
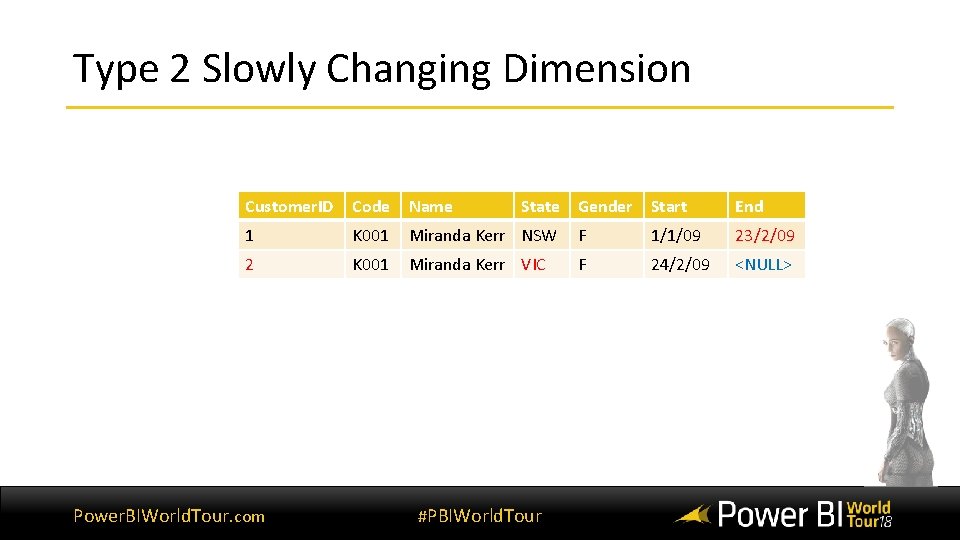
Type 2 Slowly Changing Dimension Customer. ID Code Name 1 K 001 Miranda Kerr NSW F 1/1/09 23/2/09 <NULL> 2 K 001 Miranda Kerr VIC F 24/2/09 <NULL> Power. BIWorld. Tour. com State Gender Start #PBIWorld. Tour End
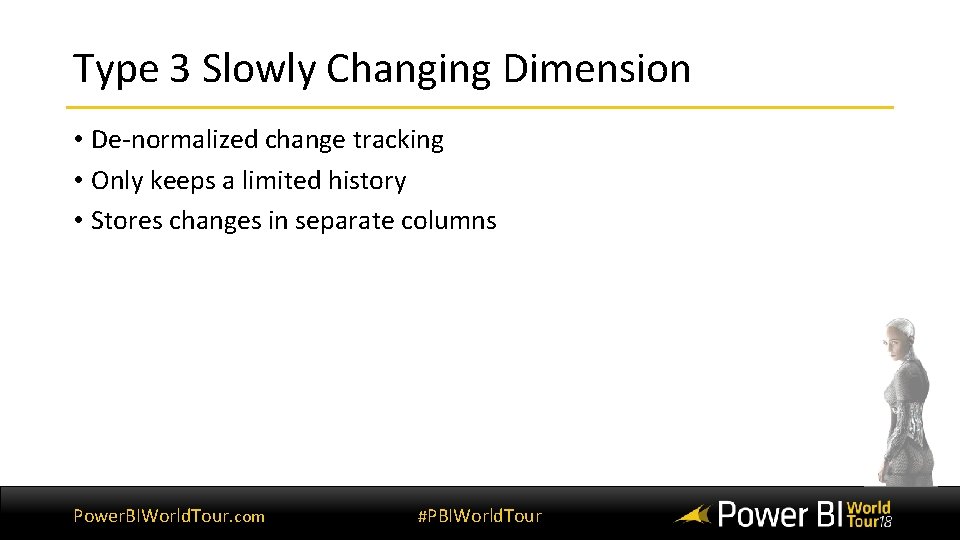
Type 3 Slowly Changing Dimension • De-normalized change tracking • Only keeps a limited history • Stores changes in separate columns Power. BIWorld. Tour. com #PBIWorld. Tour
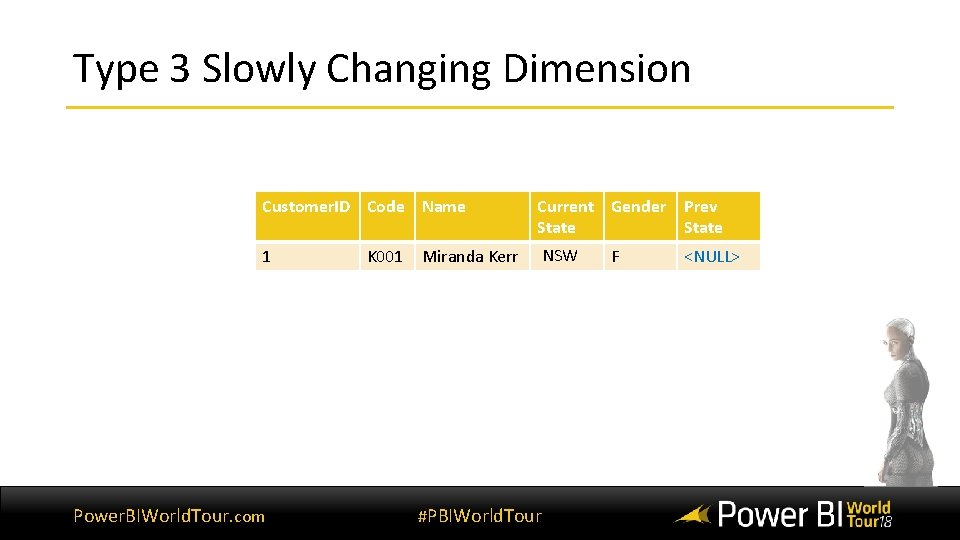
Type 3 Slowly Changing Dimension Customer. ID Code Name Current Gender Prev State 1 NSW VIC Power. BIWorld. Tour. com K 001 Miranda Kerr #PBIWorld. Tour F <NULL>
Relationships between Facts and Dimensions Power. BIWorld. Tour. com #PBIWorld. Tour
Regular Relationships • Most Common relationship • Works like an inner left join between the fact and dimension Power. BIWorld. Tour. com #PBIWorld. Tour
Demo: Regular Relationships Power. BIWorld. Tour. com #PBIWorld. Tour
Many to Many Relationships • Allows for the situation where you want to associate more than one member from a dimension with a single fact. Power. BIWorld. Tour. com #PBIWorld. Tour
Scenario • Bank Account Transactions - each one has an Account - Accounts have one or more Customers - Each Customer has one or more Accounts Power. BIWorld. Tour. com #PBIWorld. Tour
Beware of Bi-Directional filters • Use Bi-Directional filters only when necessary • Use CROSSFILTER instead when possible (more typing, but gives you explicit control) • Priority Rules • Shortest path wins • 1: M paths win • For more information: https: //docs. microsoft. com/en-us/powerbi/desktop-bidirectional-filtering Power. BIWorld. Tour. com #PBIWorld. Tour
Demo: Many to Many Relationships Power. BIWorld. Tour. com #PBIWorld. Tour
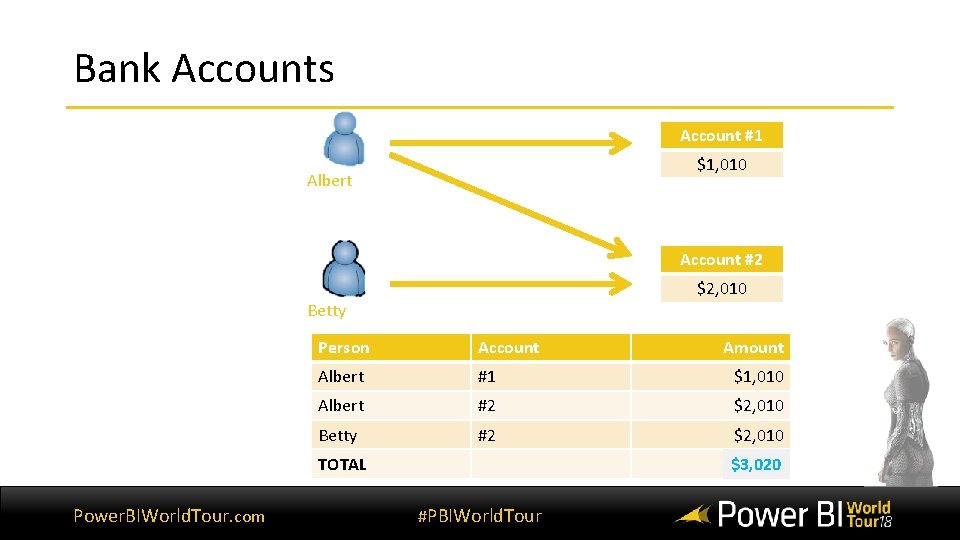
Bank Accounts Account #1 $1, 010 Albert Account #2 $2, 010 Betty Person Account Albert #1 $1, 010 Albert #2 $2, 010 Betty #2 $2, 010 TOTAL Power. BIWorld. Tour. com Amount $5, 030 $3, 020 #PBIWorld. Tour
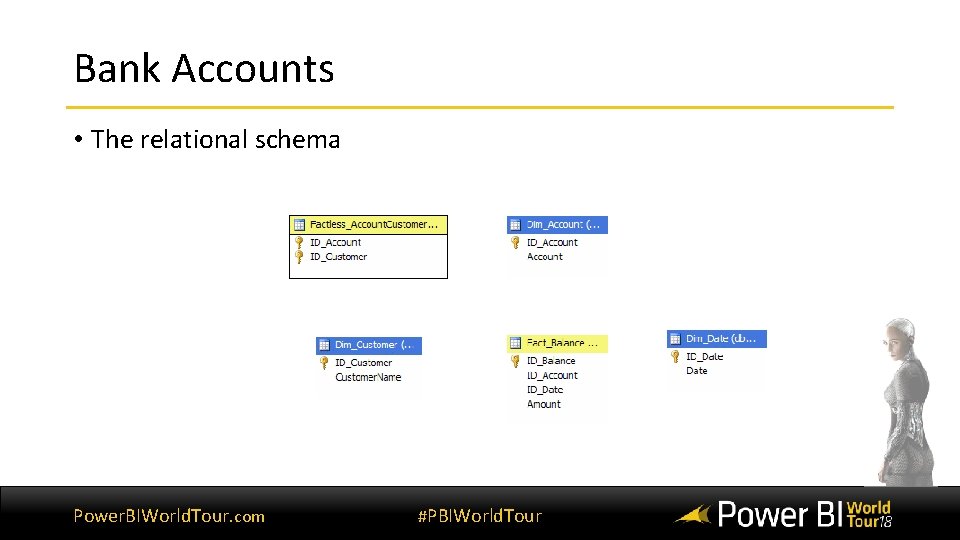
Bank Accounts • The relational schema Power. BIWorld. Tour. com #PBIWorld. Tour
Fact Relationships • Used when a table plays both the role of a dimension and a fact. • Sometimes also known as a degenerate dimension. Power. BIWorld. Tour. com #PBIWorld. Tour
Demo: Fact Relationships Power. BIWorld. Tour. com #PBIWorld. Tour
No Relationship • Used for controlling calculations when you want to influence the context of the calculation without changing the context of the data. Power. BIWorld. Tour. com #PBIWorld. Tour
Demo: No Relationship Power. BIWorld. Tour. com #PBIWorld. Tour
Key Take Aways • Why to build a dimensional model. • What makes up a dimensional model. • How implement various modelling techniques in Analysis Services Tabular, Power BI & Power. Pivot • Build small prototypes Power. BIWorld. Tour. com #PBIWorld. Tour
Build your own Supermodel The “ 4 chords” of data modelling involves understanding: • different types of Schemas • the “grain” of you data • how to handle changes over time • different relationship types Power. BIWorld. Tour. com #PBIWorld. Tour

Don’t forget to join your local PUG to enjoy year-round networking and learning.
- Slides: 51