Bubble Motions in Bubble Rafts under Steady Shear

Bubble Motions in Bubble Rafts under Steady Shear Michael Dennin Department of Physics U. C. Irvine Supported by: Department of Energy grant DE-FG 02 -03 ED 46071, Sloan Foundation, Petroleum Research Fund, and UCI UROP

General Outline • Questions raised/addressed in this talk • Overview of the system • Initial results

Two Questions • What is the average flow behavior of slowly sheared bubble raft? (How does this relate to flow of foams? ) • What is the connection between average flow behavior and individual bubble motions?
")
General properties • Fluctuations in stress/energy. • “Particle” rearrangements (T 1 events, nonaffine motions) • Non-uniform shear • Diffusive motion of “particles”.

Two “types” of non-uniform shear Non-uniform shear: region of non-zero and zero shear rate coexist 1) strain rate is continuous (usually exponential velocity). 2) strain rate is discontinuous.
")
“Two-dimensional” foam Debregeas, Tabuteau, Di Meglio, PRL 87 (2001)
")
Three dimensional suspension Coussot, Raynaud, et al. , PRL 88, 218301 (2002)

Definition of T 1 Event T 1 event: Neighbor switching

Apparatus

Schematic of Apparatus Inner radius ri: 3. 84 cm Outer radius ro: 7. 43 cm Area fraction: 0. 95 Boundary conditions: no slip at both walls, but inner cylinder is free to move.

Definition of Terms Outer barrier moves with V stress Dr elastic flowing Ds Strain: g = Dx/Dr Strain Rate: dg/dt = v/Dr strain Shear stress: sxy = F/L (twodimensions) Viscosity: h = stress/(strain rate)

Bubble Motions

Reminder of Geometry Consequences • Couette Geometry: average stress, s, proportional to 1/r 2 • Yield stress, sy: => critical radius beyond which “rigid” body or elastic behavior, strain rate is a continuous function of r.
")
Effective Viscosity: stress/(strain rate)

Stress versus strain rc=6. 7 cm rc=6. 3 cm sy= 0. 8 m. N/m (1) strain rate = 3 x 10 -2 s-1 (2) strain rate = 4 x 10 -3 s-1
/Wr = 1 => rigid body rotation. Fit is to vel.")
Average Velocity Profile V(r)/Wr = 1 => rigid body rotation. Fit is to vel. profile for a power law viscosity.

Some Questions • What sets the “critical” radius? • Why is strain rate discontinuous? Consider “flow” during individual events and T 1 events. • What is the role of stress chains, if they exist?

T 1 events and stress

T 1 events and bubble motions
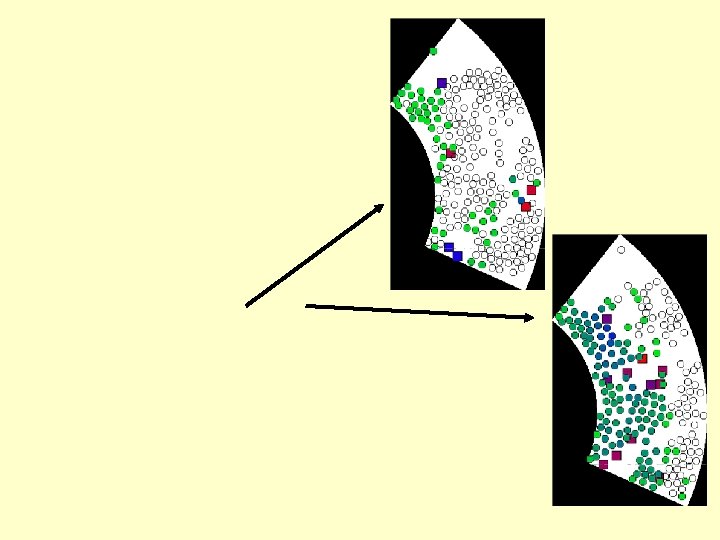

“Local” Displacements A, D B, C E

T 1 events and average velocity

Summary • Apparent disagreement between average stress measurements and average velocity profile: strain-rate discontinuity needs to be understood. • Connection between T 1 events and short time bubble motions. Not clear the connection between T 1 events and average velocity. • Time averages rapidly converge despite very nonlinear short time motion.

Acknowledgments • Video images of bubble raft: John Lauridsen • Viscosity measurements: Ethan Pratt • Initial Bubble tracking software: Gregory Chanan • Funding: Department of Energy grant DEFG 02 -03 ED 46071, Sloan Foundation, Petroleum Research Fund, and UCI UROP
- Slides: 24