
BSI TERADATA EPISODE 11 HOW WE DID IT
BSI TERADATA EPISODE 11: HOW WE DID IT THE CASE OF THE TAINTED LASAGNA WATCH THE EPISODE AT HTTP: //BIT. LY/14 P 5 RMO
Story Synopsis Case of the Tainted Lasagna Situation Huge worldwide consumer goods food producer, faced with 3 -4 major and 5 -6 minor recalls per year. Increased government oversight and food safety regulations. Problem Current approach – too slow, incomplete, because data is not integrated across the entire food chain. No advanced analytics. Impacts both sales and brand. High risk. 2 © Teradata BSI Studios 2013
Impacts Complex problem identification is faster – from 2 weeks to 3 days Big data improves root cause isolation and hypothesis testing Notification and remedy: recent recalls were 85% faster and at 99% coverage Improvement from 75% to 86% bad units verifiably destroyed Easy to satisfy regulators / prove issues were resolved Lowers risk for the company from bad PR and lawsuits 3 © Teradata BSI Studios 2013
CAST OF CHARACTERS Great Brands: • Chief Risk Officer: Wiley W. Harvey • VP Supply Chain Management: June Davis BSI: • Jodice Blinco • Mike Rinaldi
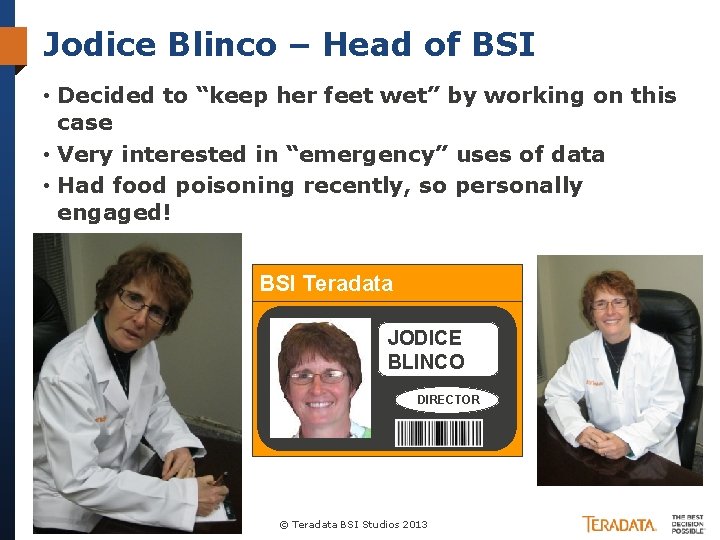
Jodice Blinco – Head of BSI • Decided to “keep her feet wet” by working on this case • Very interested in “emergency” uses of data • Had food poisoning recently, so personally engaged! BSI Teradata JODICE BLINCO DIRECTOR 5 © Teradata BSI Studios 2013
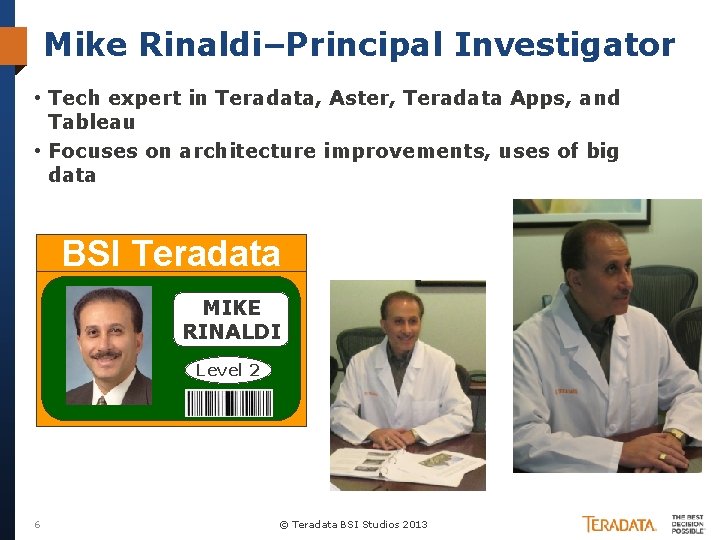
Mike Rinaldi–Principal Investigator • Tech expert in Teradata, Aster, Teradata Apps, and Tableau • Focuses on architecture improvements, uses of big data BSI Teradata MIKE RINALDI Level 2 6 © Teradata BSI Studios 2013
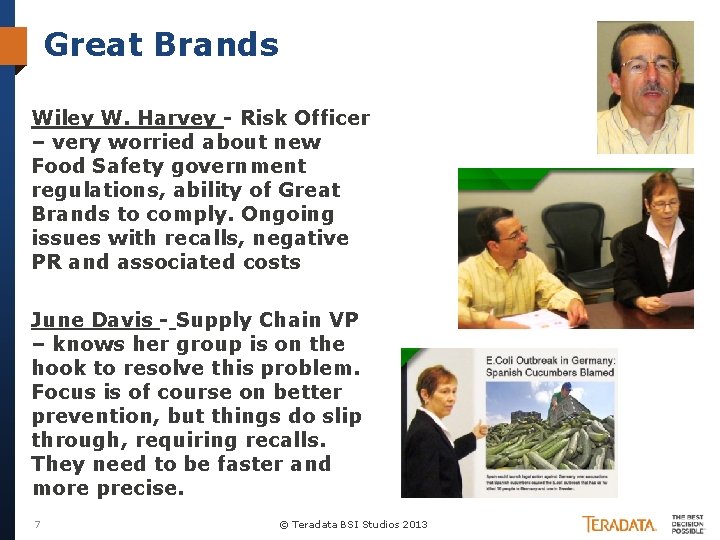
Great Brands Wiley W. Harvey - Risk Officer – very worried about new Food Safety government regulations, ability of Great Brands to comply. Ongoing issues with recalls, negative PR and associated costs June Davis - Supply Chain VP – knows her group is on the hook to resolve this problem. Focus is of course on better prevention, but things do slip through, requiring recalls. They need to be faster and more precise. 7 © Teradata BSI Studios 2013
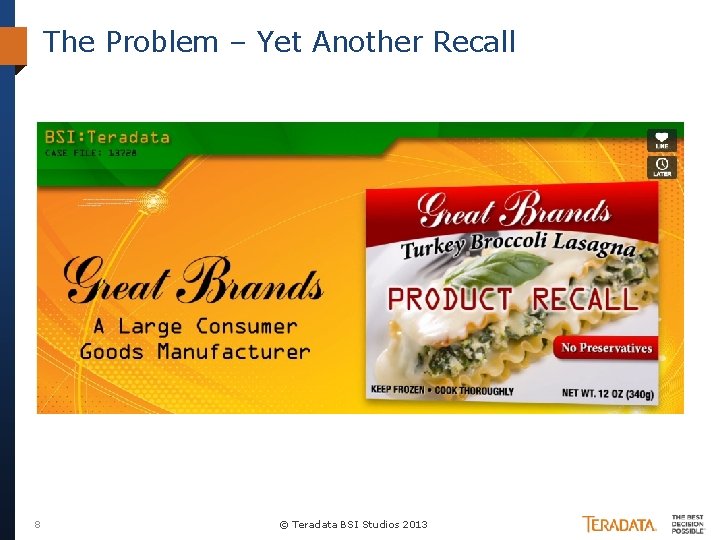
The Problem – Yet Another Recall 8 © Teradata BSI Studios 2013
Scene 1: Problem Case of the Tainted Lasagna Historical problems at Great Brands: Reaction time – situational analysis takes too long, especially when issues are cross-company with upstream suppliers Root cause identification, scoping for recalls also takes too much time Execution of the recall, compliance proof Impacts: Number of incidents, complexity and cost of resolving New issues: Government regulations – Food and Safety Administration rules, plus more international rules coming Goals: New Track and Trace system Fresh ideas, incorporating the latest technologies 9 © Teradata BSI Studios 2013
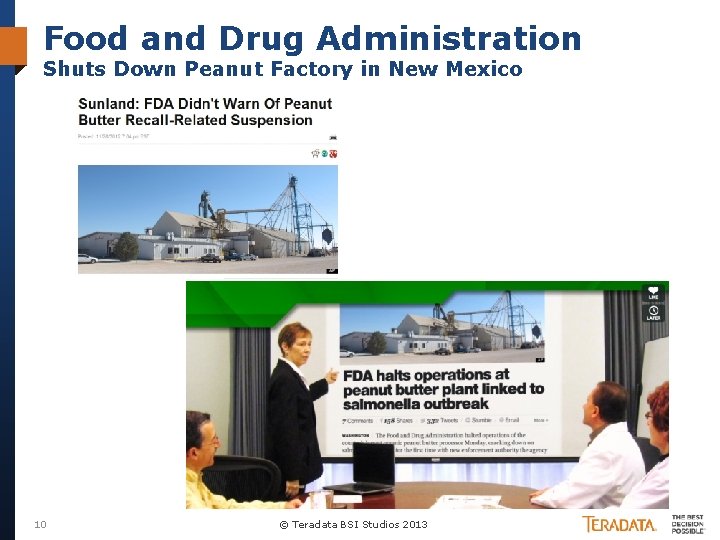
Food and Drug Administration Shuts Down Peanut Factory in New Mexico 10 © Teradata BSI Studios 2013
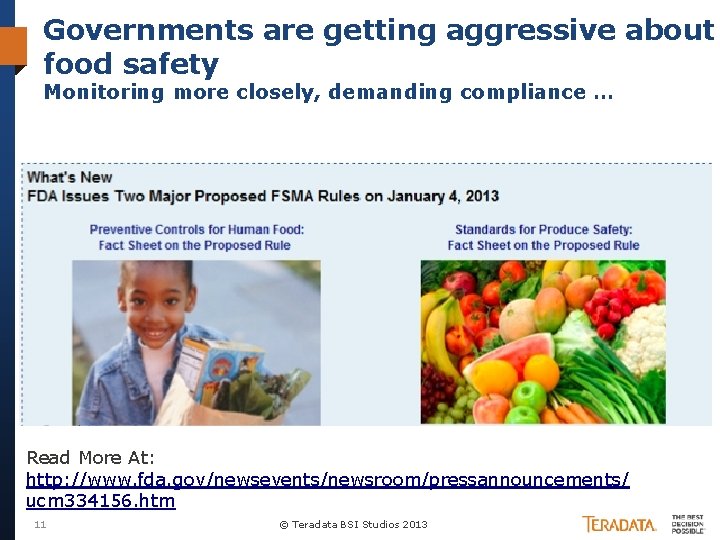
Governments are getting aggressive about food safety Monitoring more closely, demanding compliance … Read More At: http: //www. fda. gov/newsevents/newsroom/pressannouncements/ ucm 334156. htm 11 © Teradata BSI Studios 2013
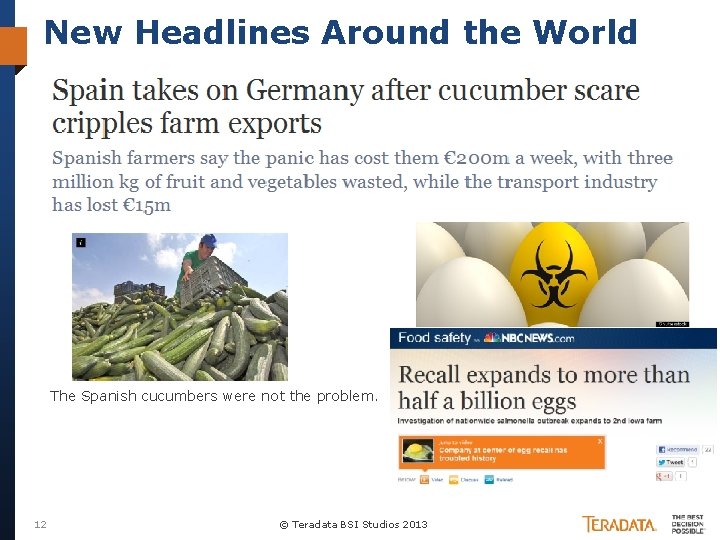
New Headlines Around the World The Spanish cucumbers were not the problem. 12 © Teradata BSI Studios 2013
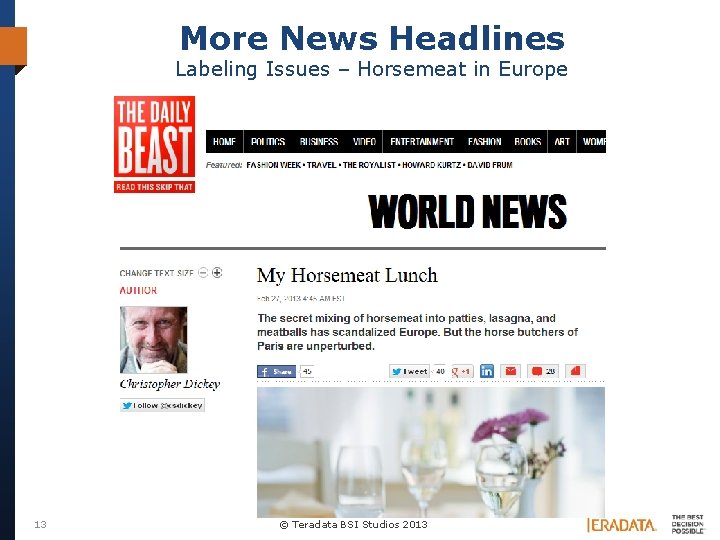
More News Headlines Labeling Issues – Horsemeat in Europe 13 © Teradata BSI Studios 2013
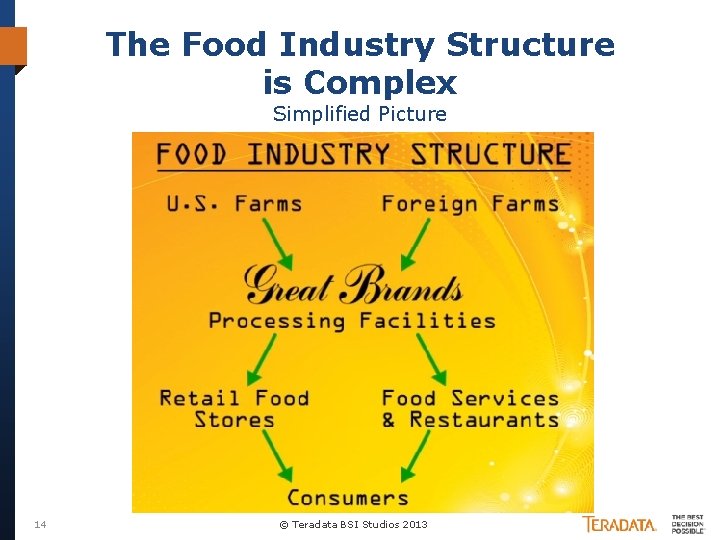
The Food Industry Structure is Complex Simplified Picture 14 © Teradata BSI Studios 2013
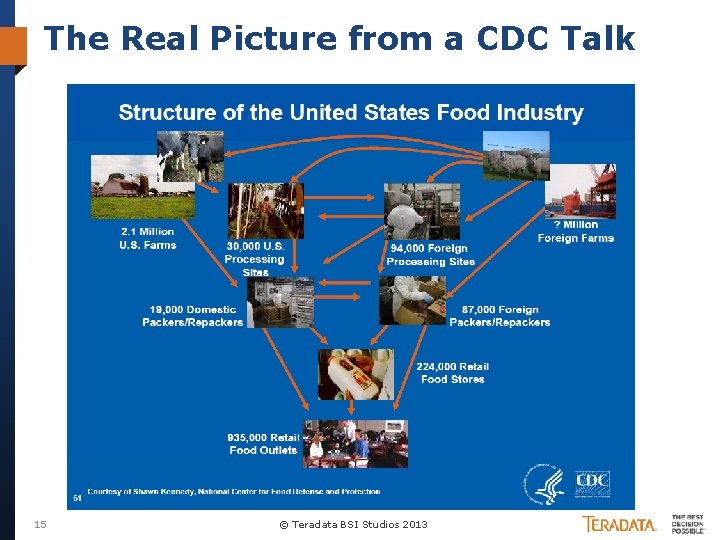
The Real Picture from a CDC Talk 15 © Teradata BSI Studios 2013
BSI Teradata’s Recipe for Success Food manufacturers must increase collaboration with their trading partners (on both ends of the value chain – suppliers and retailers/customers) Invest in standardizing recall procedures and tools Implement effective technology that improves visibility across the value chain Such improvements can serve to both manage the risk of recall occurrence and reduce negative impact to your company and brand should the improbable happen. 16 © Teradata BSI Studios 2013
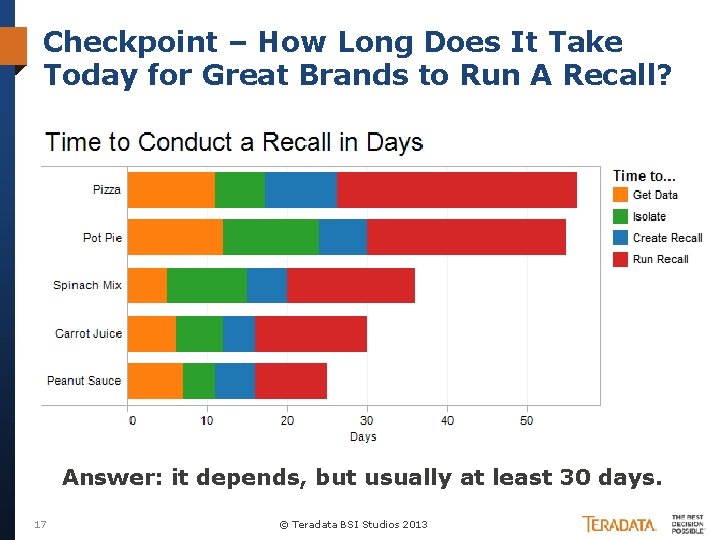
Checkpoint – How Long Does It Take Today for Great Brands to Run A Recall? Answer: it depends, but usually at least 30 days. 17 © Teradata BSI Studios 2013
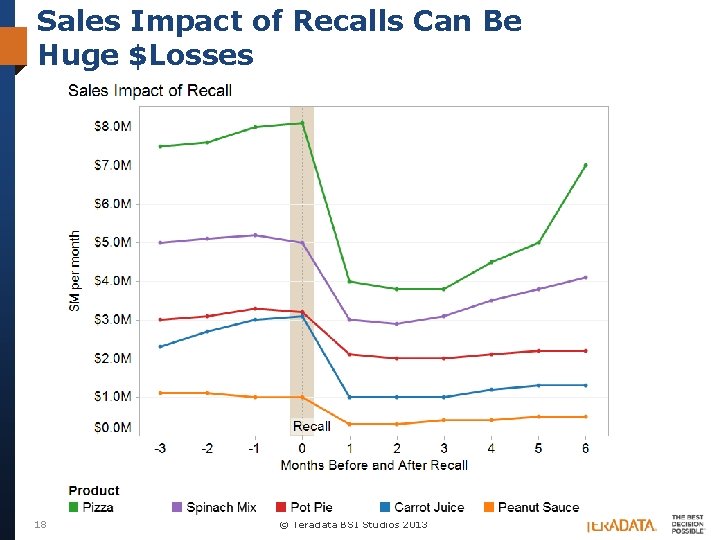
Sales Impact of Recalls Can Be Huge $Losses 18 © Teradata BSI Studios 2013
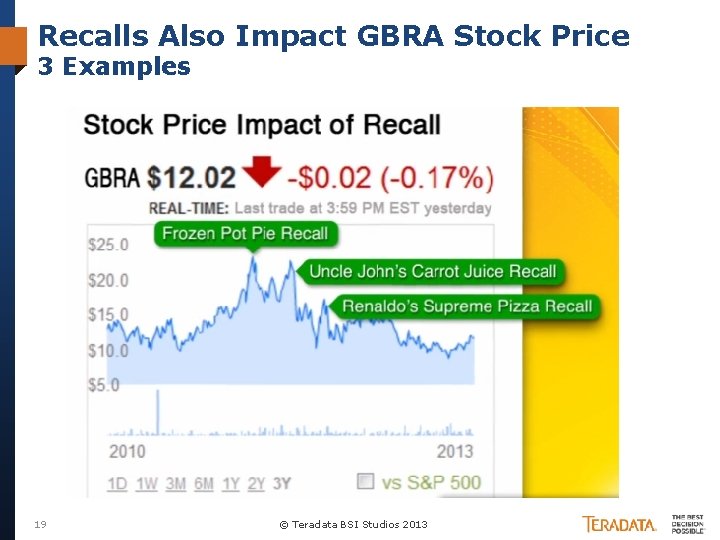
Recalls Also Impact GBRA Stock Price 3 Examples 19 © Teradata BSI Studios 2013
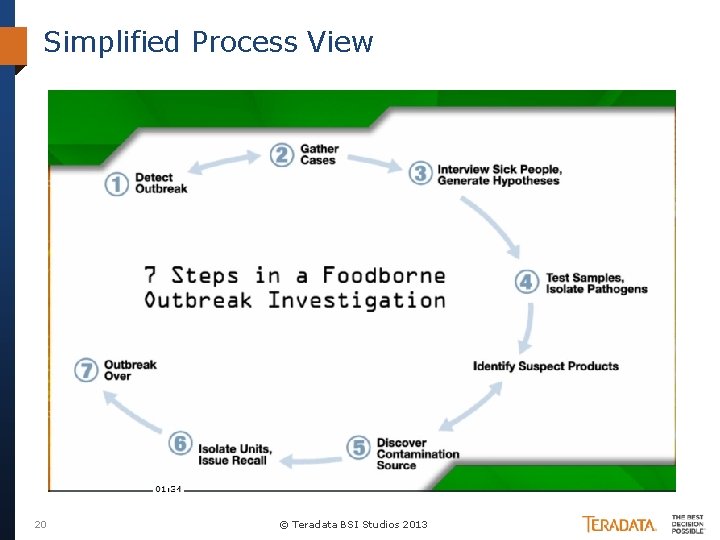
Simplified Process View 20 © Teradata BSI Studios 2013
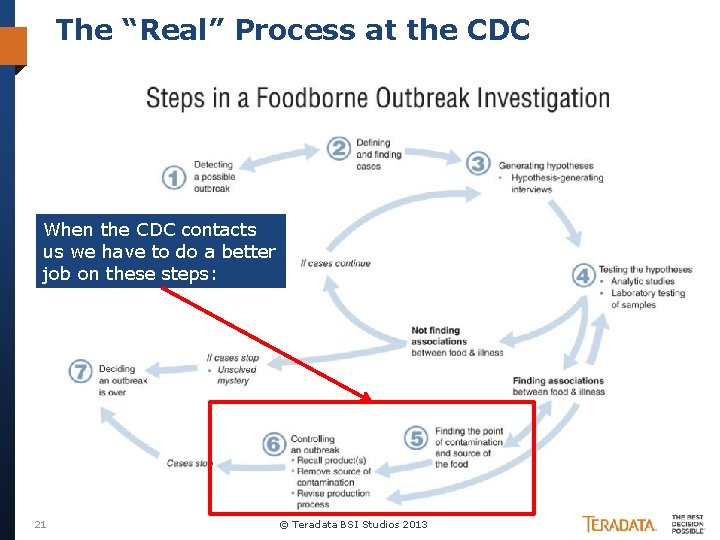
The “Real” Process at the CDC When the CDC contacts us we have to do a better job on these steps: 21 © Teradata BSI Studios 2013
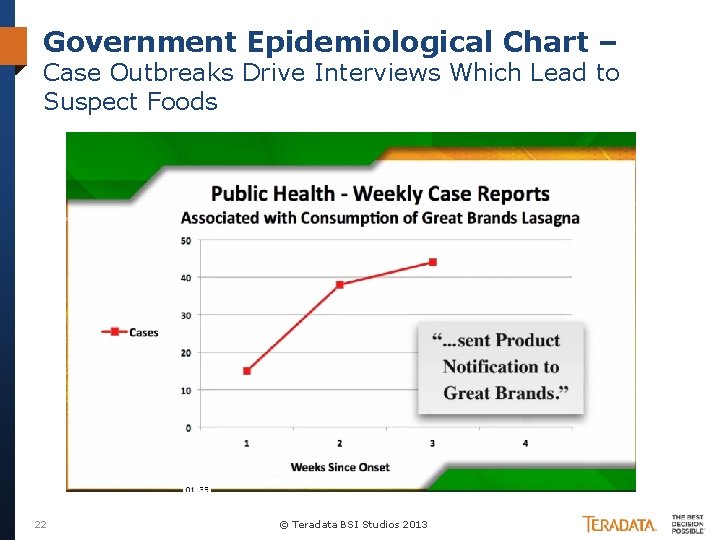
Government Epidemiological Chart – Case Outbreaks Drive Interviews Which Lead to Suspect Foods 22 © Teradata BSI Studios 2013
What Activities Occur at Great Brands? Once notified by the Government, Great Brands steps: Rapid data capture – load data with varying structures, formats, sizes, and velocities more quickly into a Discovery Platform – then find the needles in the haystack Analysis and root cause –use fishbone analytics and temporal sequencing (n. Path) to “see” the flow of raw product to consumers; isolation to bad product lots and possible victims Managing recall resolutions – use B 2 B and B 2 C campaigns with workflows to guarantee recall notices go out to all downstream participants, and monitor responses (B 2 B – Business to Business; B 2 C – Business to Consumer) 23 © Teradata BSI Studios 2013
Why Do This? Overview Process Great Brands needs end-to-end visibility, traceability to close its part of the loop quickly and thoroughly. Data Great Brands has many data sources: CDC, Public Health inputs, all manufacturing and transport data, access to supplier data, social media, Retail Store reports, loyalty data – how much depends on whether they can get access to both upstream and downstream data sets, in addition to their own data 24 © Teradata BSI Studios 2013
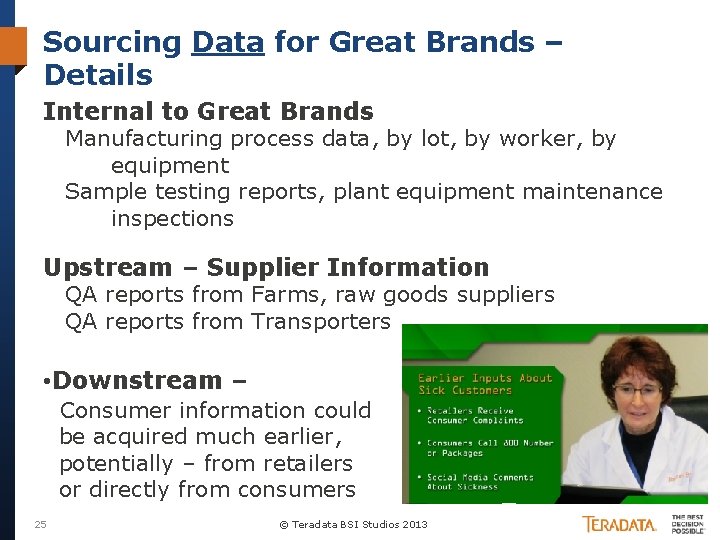
Sourcing Data for Great Brands – Details Internal to Great Brands Manufacturing process data, by lot, by worker, by equipment Sample testing reports, plant equipment maintenance inspections Upstream – Supplier Information QA reports from Farms, raw goods suppliers QA reports from Transporters • Downstream – Consumer information could be acquired much earlier, potentially – from retailers or directly from consumers 25 © Teradata BSI Studios 2013
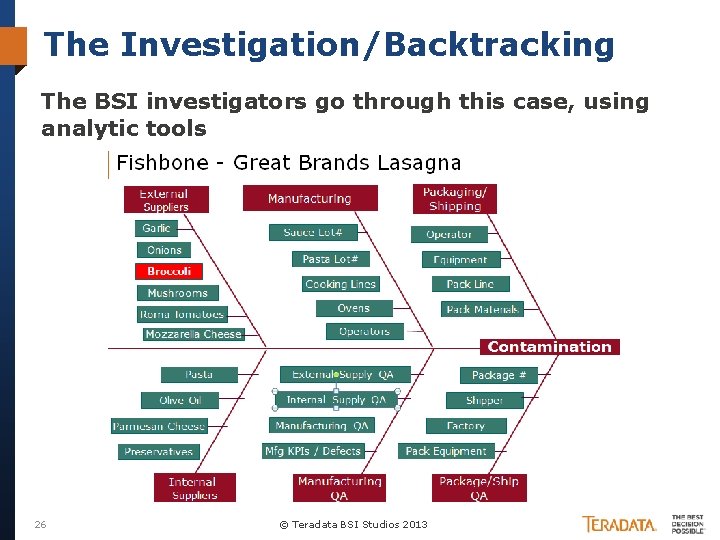
The Investigation/Backtracking The BSI investigators go through this case, using analytic tools 26 © Teradata BSI Studios 2013
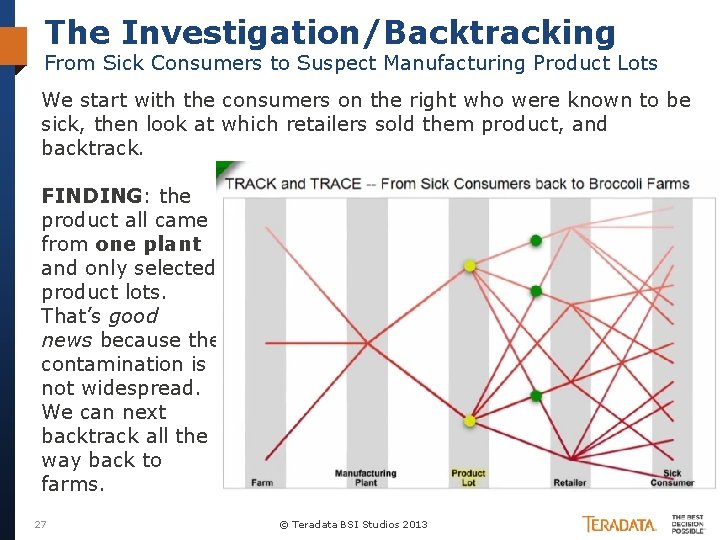
The Investigation/Backtracking From Sick Consumers to Suspect Manufacturing Product Lots We start with the consumers on the right who were known to be sick, then look at which retailers sold them product, and backtrack. FINDING: the product all came from one plant and only selected product lots. That’s good news because the contamination is not widespread. We can next backtrack all the way back to farms. 27 © Teradata BSI Studios 2013
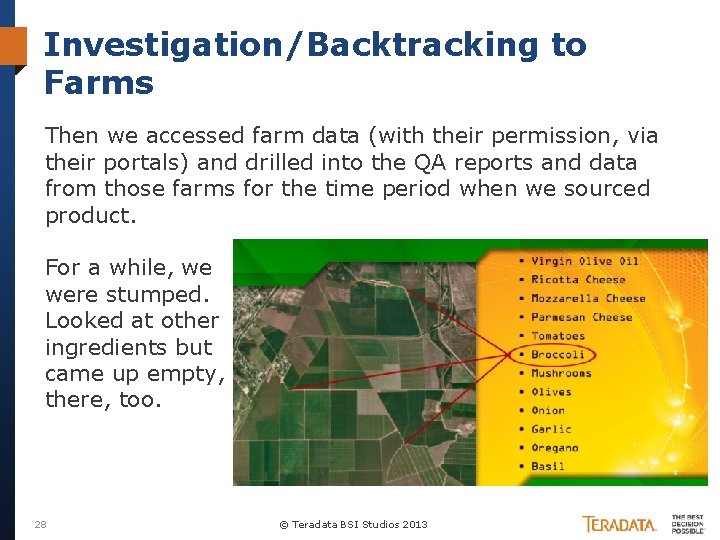
Investigation/Backtracking to Farms Then we accessed farm data (with their permission, via their portals) and drilled into the QA reports and data from those farms for the time period when we sourced product. For a while, we were stumped. Looked at other ingredients but came up empty, there, too. 28 © Teradata BSI Studios 2013
Investigation/Backtracking, Adding Transport 1. On a hunch, we realized we skipped one step in ourflow diagram - the transportation of product from the farms to our plants 2. We found that all the sick people ate broccoli that was transported by one truck, from one transport company – Jimmy Changa Transport. 3. Upon investigation (not shown in the episode) and some testing of swabs from the truck – they were the guilty party! 29 © Teradata BSI Studios 2013
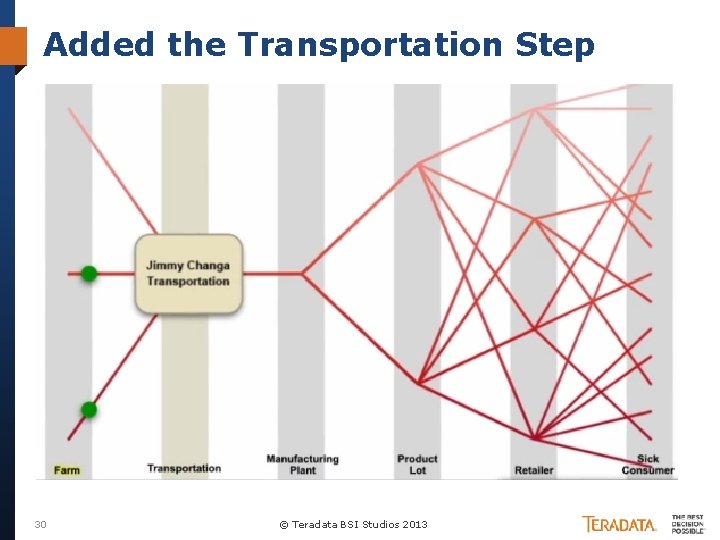
Added the Transportation Step 30 © Teradata BSI Studios 2013
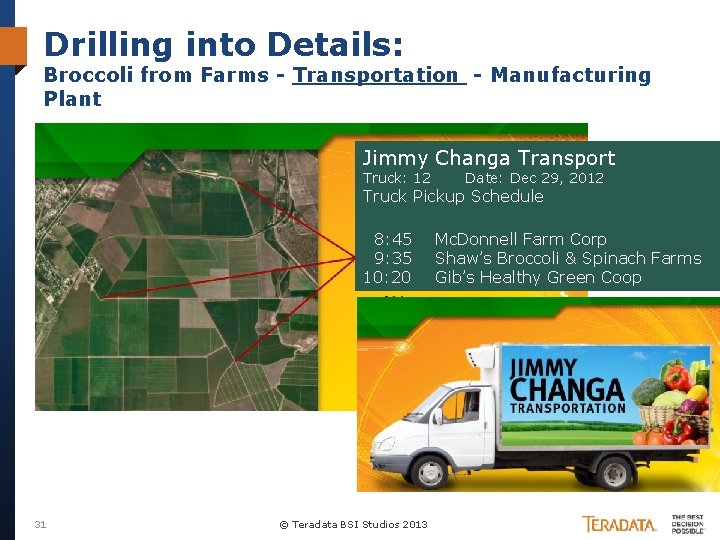
Drilling into Details: Broccoli from Farms - Transportation - Manufacturing Plant Jimmy Changa Transport Truck: 12 Date: Dec 29, 2012 Truck Pickup Schedule 8: 45 9: 35 10: 20 Mc. Donnell Farm Corp Shaw’s Broccoli & Spinach Farms Gib’s Healthy Green Coop Jimmy Changa 31 © Teradata BSI Studios 2013
Jodice Asked a Good Question How did the bacteria pass through the Kill Step in the manufacturing process? That step should have killed the bacteria at 167 degrees Fahrenheit (or 75 degrees Celsius). They load temperature records for the implicated lots and find that it was the first run of the day – so maybe equipment is faulty, taking too long to heat up. They investigate, by pulling into the Discovery Platform all the cooker sensor data. They found that on January 2 nd (right after a vacation day) the first 3 lots for Plant 21 Unit 1 - never hit the kill temp. Upon further investigation (not shown) compared to other cookers, this unit is old and they recommended immediate © Teradata BSI Studios 2013 32 replacement.
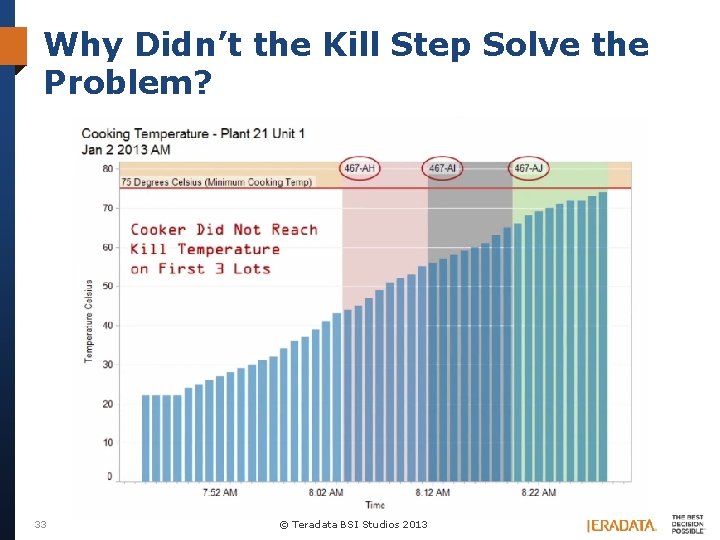
Why Didn’t the Kill Step Solve the Problem? 33 © Teradata BSI Studios 2013
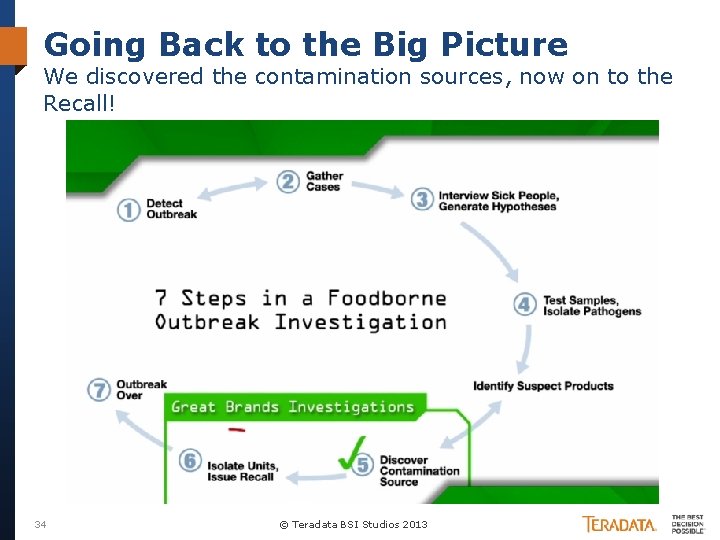
Going Back to the Big Picture We discovered the contamination sources, now on to the Recall! 34 © Teradata BSI Studios 2013
Isolation for the Recall – Who To Contact? Using the sick people input and the Fishbone and pathing, we discovered the probable cause. A few more questions. . . Great Brands must work next with the Retailers Almost done. We also know from our own ERP system which lots went to which distribution centers and which retail stores. 35 © Teradata BSI Studios 2013
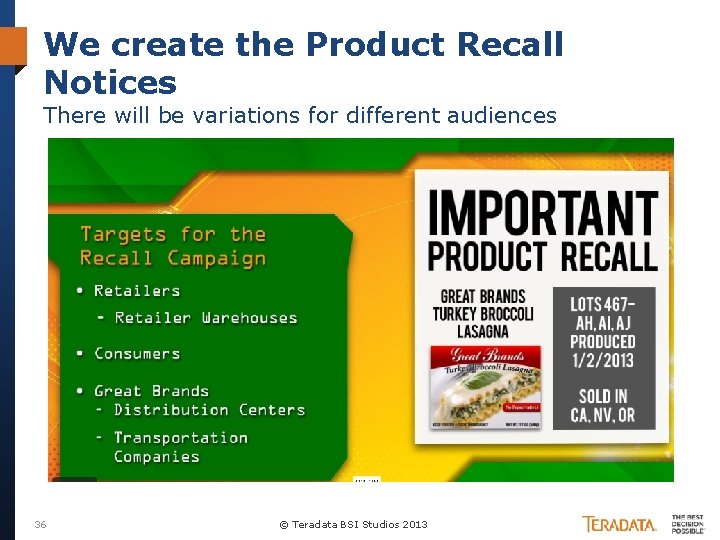
We create the Product Recall Notices There will be variations for different audiences 36 © Teradata BSI Studios 2013
Targets for Recall Consumers - Who bought the product? Known? – loyalty or purchase card data (from Retailers) Unknown? – paid cash. This is where we have to go public. If all are known we can contact them all directly, avoid media. Retailers Unsold product still on shelves In Retailer Distribution Warehouses – not yet on shelves Great Brands 37 Distribution Centers – not yet shipped from our warehouses Transportation Companies – if product is enroute from either: Manufacturing location to Great Brands distribution centers, or GB Distribution centers enroute to Retailer Distribution Warehouses © Teradata BSI Studios 2013
Recall Communications and Monitoring For each target, we create the sequencing of events We communicate to them (telephone calls, emails, faxes) We want to monitor that they received the communication Then we want to monitor (with timeouts and follow-ups if needed) whether they responded appropriately Responses will range, but can include: Consumers: they consumed the product and got sick/reported (data could be enroute to the government through public health channels) Consumers: consumed product, did not get sick Consumers: did not consume product, will destroy – we need to reimburse Retailers: pulled product from shelves Retailers: pulled product from warehouses and destroyed/return Great Brands internal: this is far easier. Goal is 100% communication and recall coverage. 38 © Teradata BSI Studios 2013
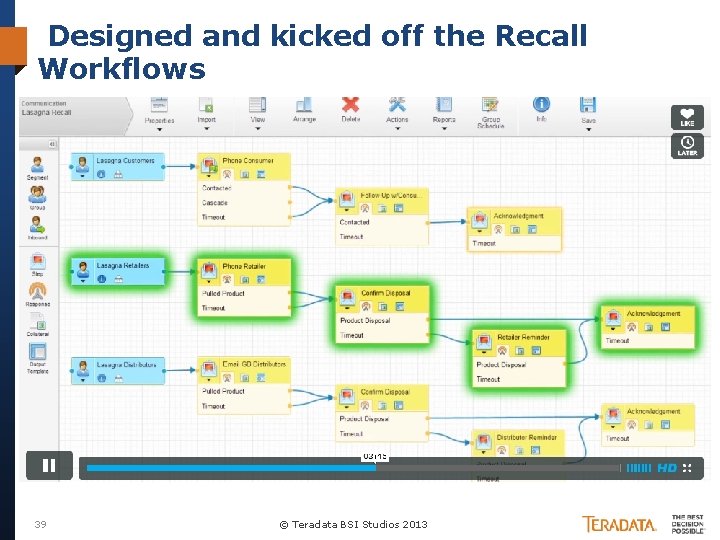
Designed and kicked off the Recall Workflows 39 © Teradata BSI Studios 2013
Scene 3: Readout at Great Brands HQ Our BSI investigators Jodice and Mike give the summary of changes they’d recommend for a better Track/Trace/Recall system to Wiley and June 40 © Teradata BSI Studios 2013
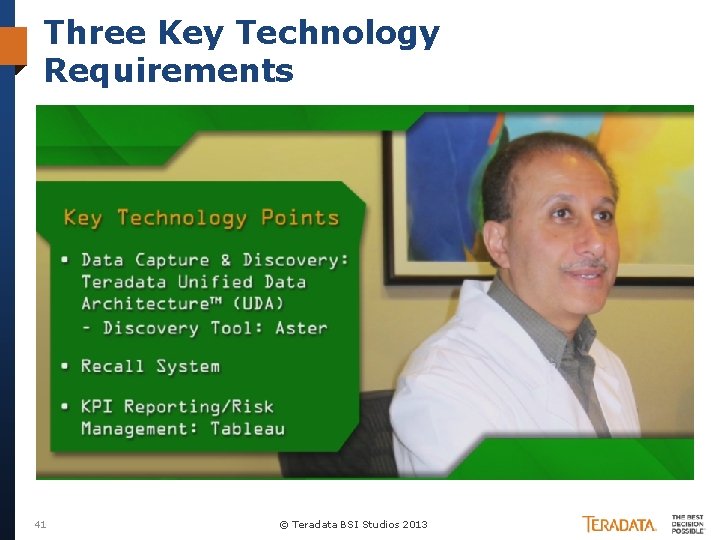
Three Key Technology Requirements 41 © Teradata BSI Studios 2013
Key Technology and Architecture Points 1 - Data Capture and Discovery Platform: Teradata UDA Any data, any type, any source, any volume Right toolkit for analytics 2 - Recall Platform: Teradata Application - Aprimo Quickly create recall targets Quickly launch the recall notices with various workflows Capture the results 3 - KPI Reporting / Risk Monitoring: Tableau Portal for executives Could also be used for Government compliance reporting 42 © Teradata BSI Studios 2013
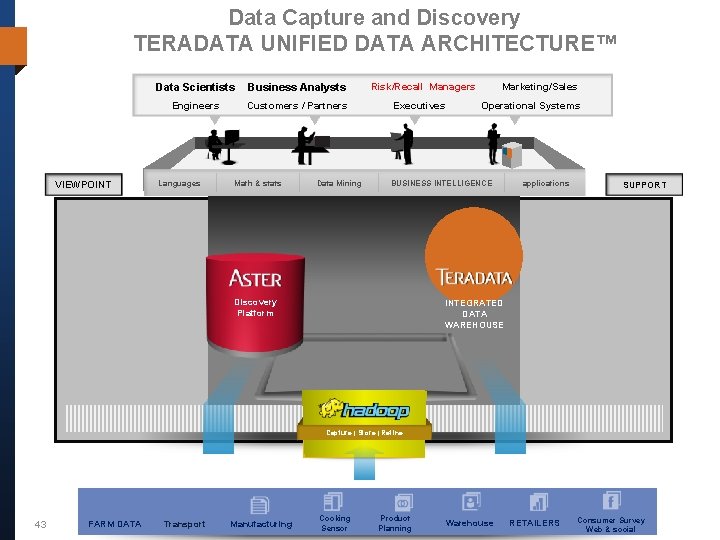
Data Capture and Discovery TERADATA UNIFIED DATA ARCHITECTURE™ VIEWPOINT Data Scientists Business Analysts Engineers Customers / Partners Languages Math & stats Data Mining Risk/Recall Managers Executives Marketing/Sales Operational Systems BUSINESS INTELLIGENCE Discovery Platform applications SUPPORT INTEGRATED DATA WAREHOUSE Capture | Store | Refine 43 FARM DATA Transport Cooking Product Manufacturing © Teradata BSI Studios 2013 Planning Sensor Warehouse RETAILERS Consumer Survey Web & social
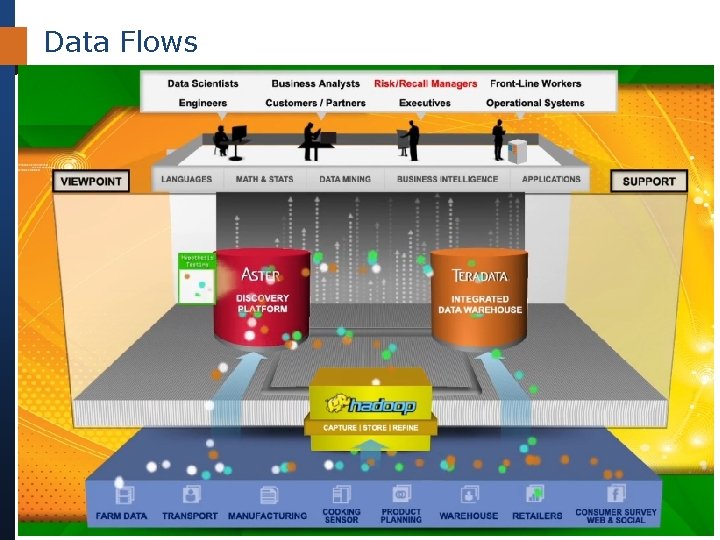
Data Flows 44 © Teradata BSI Studios 2013
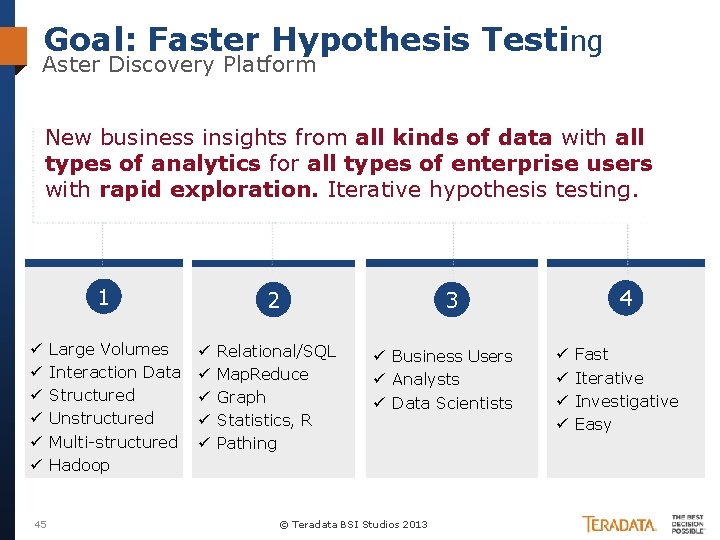
Goal: Faster Hypothesis Testing Aster Discovery Platform New business insights from all kinds of data with all types of analytics for all types of enterprise users with rapid exploration. Iterative hypothesis testing. 1 ü Large Volumes ü Interaction Data ü Structured ü Unstructured ü Multi-structured ü Hadoop 45 3 2 ü Relational/SQL ü Map. Reduce ü Graph ü Statistics, R ü Pathing ü Business Users ü Analysts ü Data Scientists © Teradata BSI Studios 2013 4 ü Fast ü Iterative ü Investigative ü Easy
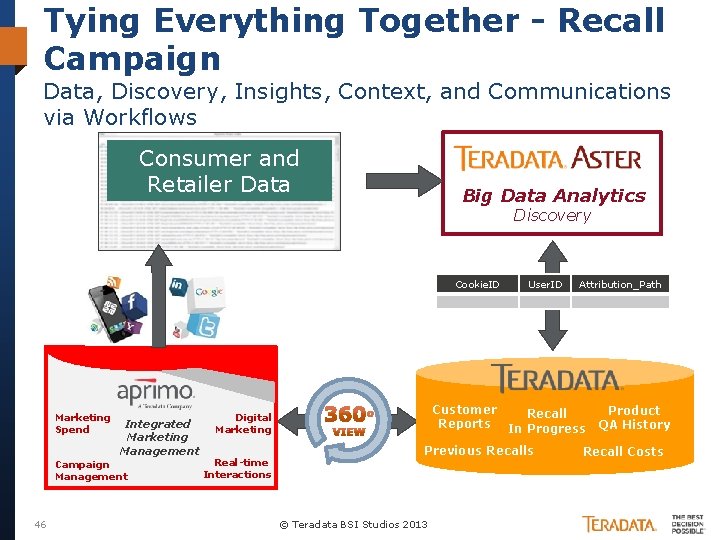
Tying Everything Together - Recall Campaign Data, Discovery, Insights, Context, and Communications via Workflows Consumer and Retailer Data Big Data Analytics Discovery Cookie. ID Marketing Spend Integrated Marketing Management Campaign Management 46 Attribution_Path Customer Product Recall Reports In Progress QA History Digital Marketing Real-time Interactions User. ID Previous Recalls © Teradata BSI Studios 2013 Recall Costs
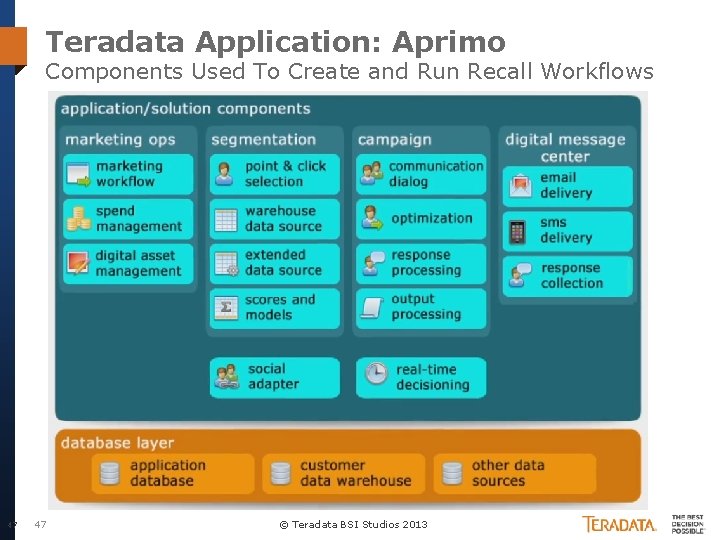
Teradata Application: Aprimo Components Used To Create and Run Recall Workflows 47 47 © Teradata BSI Studios 2013
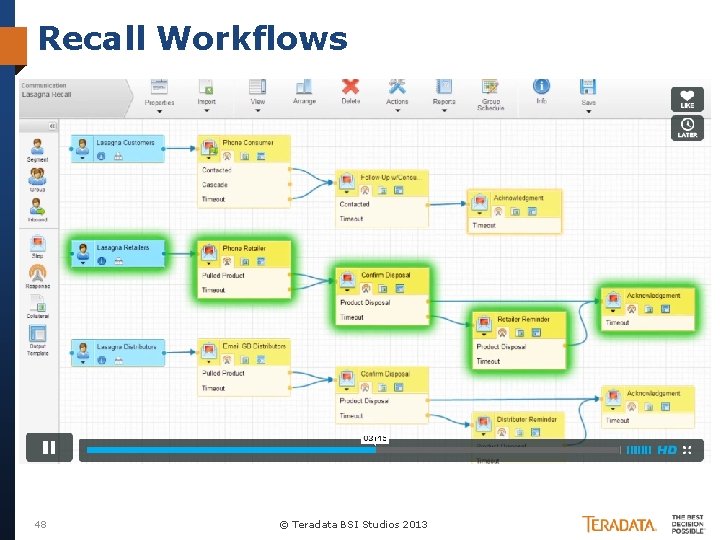
Recall Workflows 48 © Teradata BSI Studios 2013
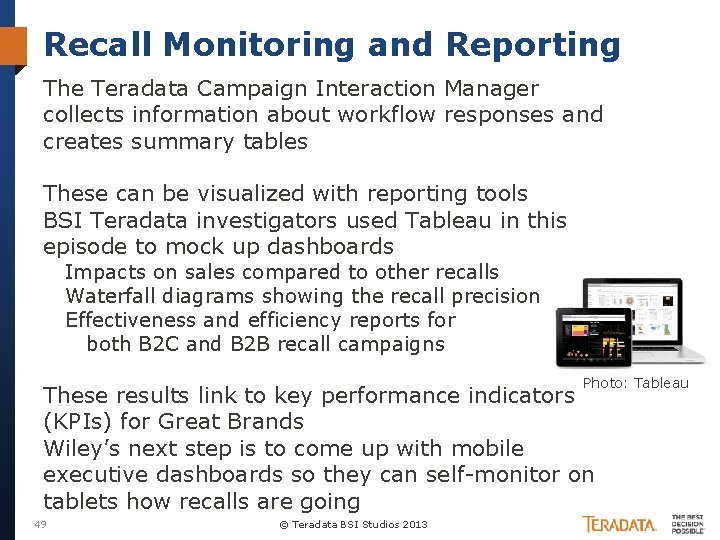
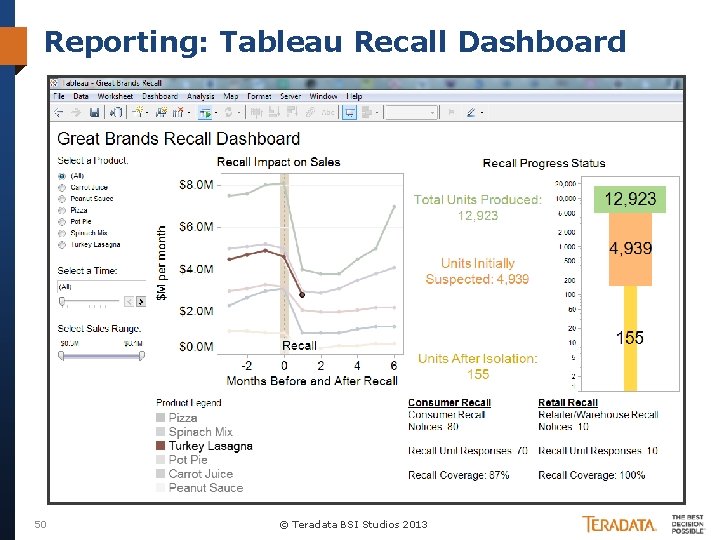
Recall Monitoring and Reporting The Teradata Campaign Interaction Manager collects information about workflow responses and creates summary tables These can be visualized with reporting tools BSI Teradata investigators used Tableau in this episode to mock up dashboards Impacts on sales compared to other recalls Waterfall diagrams showing the recall precision Effectiveness and efficiency reports for both B 2 C and B 2 B recall campaigns Photo: Tableau These results link to key performance indicators (KPIs) for Great Brands Wiley’s next step is to come up with mobile executive dashboards so they can self-monitor on tablets how recalls are going 49 © Teradata BSI Studios 2013
Reporting: Tableau Recall Dashboard 50 © Teradata BSI Studios 2013
Scene 4: Impact 1 year later – system has been used for more recall cases and we take a look at the impacts. Jodice asks Wiley for an example recall they did with the new system and he shows her the results for a pepper-crusted salami product. The problem was bad spices that were imported from overseas. International tracing can also be included in the system. Overall result: much more in control and reduced risk!!! 51 © Teradata BSI Studios 2013
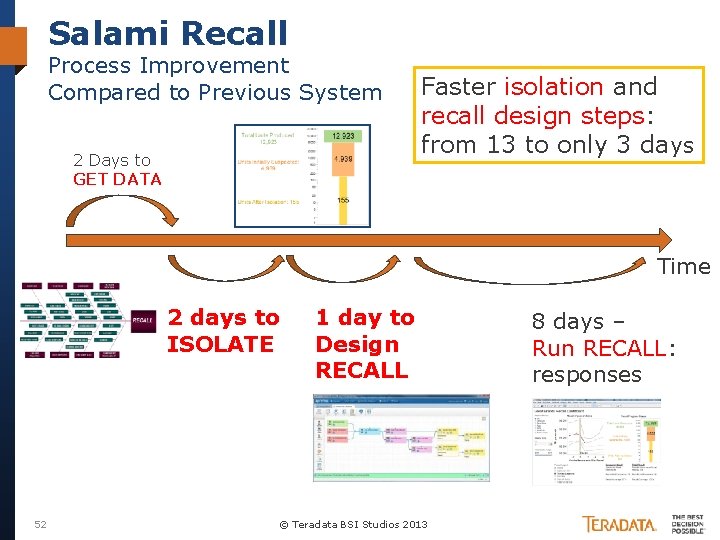
Salami Recall Process Improvement Compared to Previous System 2 Days to GET DATA Faster isolation and recall design steps: from 13 to only 3 days Time 2 days to ISOLATE 52 1 day to Design RECALL © Teradata BSI Studios 2013 8 days – Run RECALL: responses
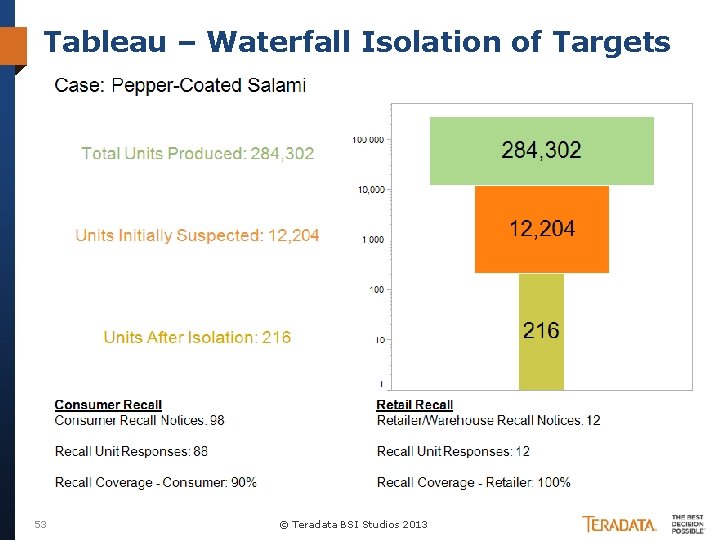
Tableau – Waterfall Isolation of Targets 53 © Teradata BSI Studios 2013
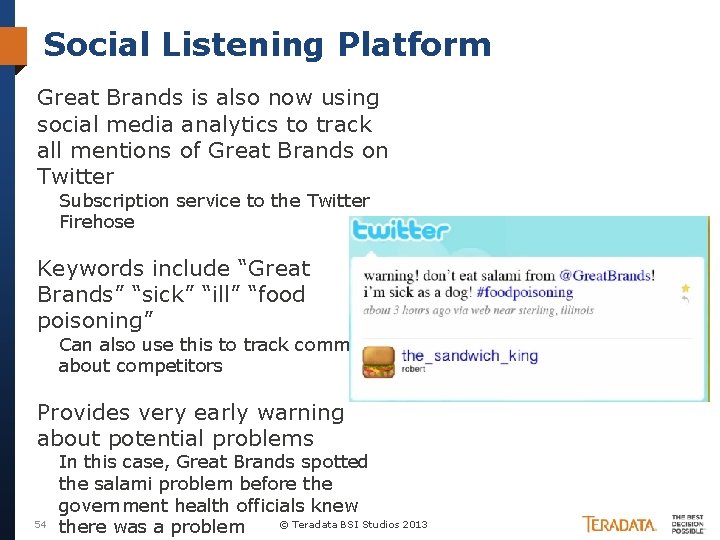
Social Listening Platform Great Brands is also now using social media analytics to track all mentions of Great Brands on Twitter Subscription service to the Twitter Firehose Keywords include “Great Brands” “sick” “ill” “food poisoning” Can also use this to track comments about competitors Provides very early warning about potential problems 54 In this case, Great Brands spotted the salami problem before the government health officials knew © Teradata BSI Studios 2013 there was a problem
WRAPUP
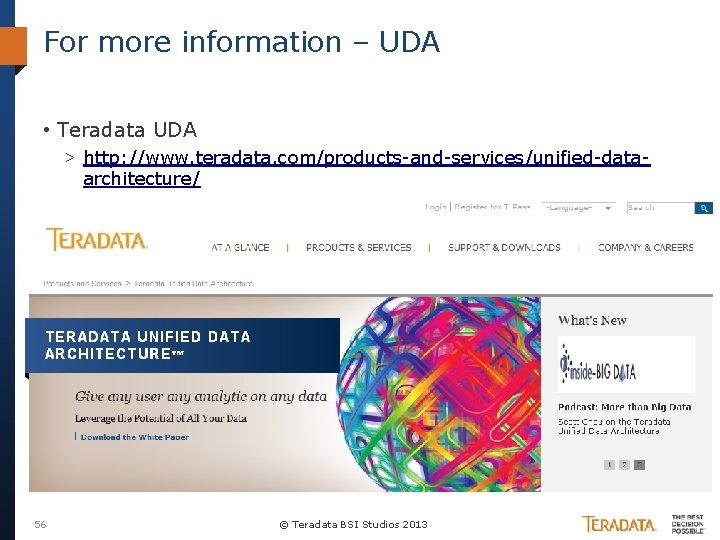
For more information – UDA • Teradata UDA > http: //www. teradata. com/products-and-services/unified-data- architecture/ 56 © Teradata BSI Studios 2013
For more information - Aster Teradata Aster: www. asterdata. com 57 © Teradata BSI Studios 2013
For more information – Teradata Applications www. aprimo. com – Component used is “Teradata Customer Management Interaction Manager” 58 © Teradata BSI Studios 2013
For more information: Teradata • www. teradata. com 59 © Teradata BSI Studios 2013
For more Information: our partner Tableau • www. tableausoftware. com 60 © Teradata BSI Studios 2013
For more information Consumer Goods Manufacturing Industry … 61 © Teradata BSI Studios 2013
Thanks for watching! • This episode appears at: http: //bit. ly/13 M 0 SMl • You can see all our episodes at www. bsi-teradata. com on Facebook: links to 11 Videos and “How We Did It” Powerpoints 62 © Teradata BSI Studios 2013
Other BSI: Teradata Episodes 1. CASE OF THE DEFECTING TELCO CUSTOMERS A Telco uses analytics to see why they have a big customer retention problem 2. CASE OF THE MIS-CONNECTING PASSENGERS An Airline improves its customer rebooking engine using analytics 3. CASE OF THE RETAIL TWEETERS A Fashion Retailer uses social media tweets to get insights on hot and cold products and to find the Fashion. Fluencers! 4. CASE OF THE CREDIT CARD BREACH A Bank and a Retailer collaborate to solve a stolen Credit Card case 5. CASE OF THE FRAGRANT SLEEPER HIT A Consumer Goods Manufacturer uses Social Media to recalibrate Manufacturing and Marketing plans 6. CASE OF DROPPED MOBILE CALLS A major Telco digs into real-time dropped call data to understand high-value and high-influence customers, where to place new towers. Create 5 campaigns to retain their most valuable and influential customers. 7, 8, 9: The SAD CASE OF STAGNOBANK Customer service is lousy, most marketing offers are rejected by customers, and the bank has lost its appeal to younger households. BSI is engaged to work on new ideas for Better Marketing, Better Customer Service, and New Mobile Apps. 10. CASE OF THE RETAIL TURNAROUND A Big-Box Retailer learns how to use web path purchase and bailout analytics to create ways of driving shoppers into stores. 63 © Teradata BSI Studios 2013
- Slides: 63