
BSc Beyond Dr Sohag Saleh Session structure Presentations

BSc & Beyond Dr Sohag Saleh
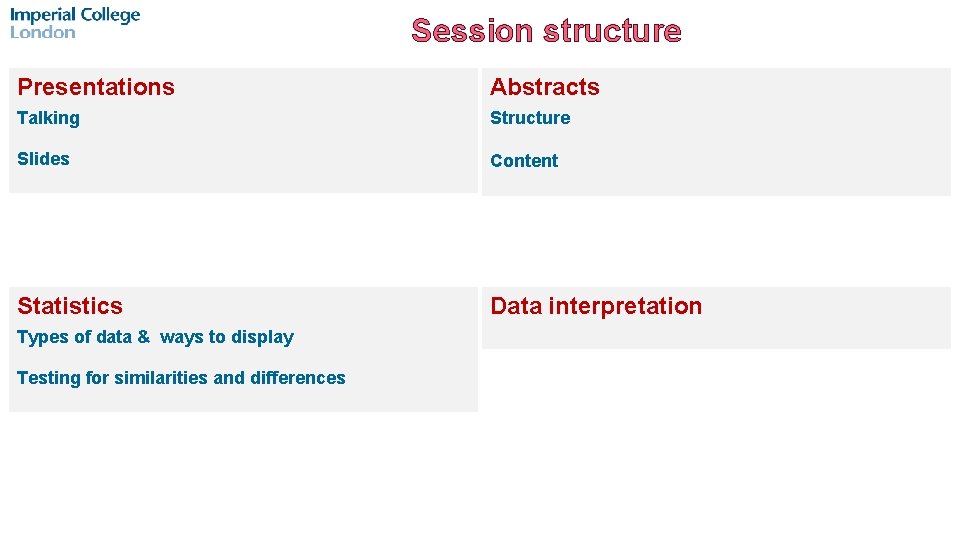
Session structure Presentations Abstracts Talking Structure Slides Content Statistics Data interpretation Types of data & ways to display Testing for similarities and differences
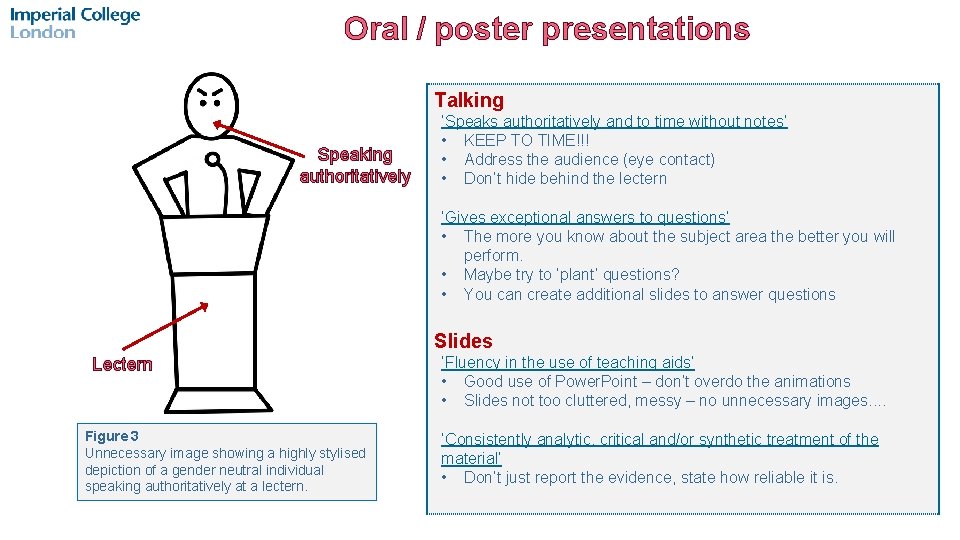
Oral / poster presentations Talking Speaking authoritatively ‘Speaks authoritatively and to time without notes’ • KEEP TO TIME!!! • Address the audience (eye contact) • Don’t hide behind the lectern ‘Gives exceptional answers to questions’ • The more you know about the subject area the better you will perform. • Maybe try to ‘plant’ questions? • You can create additional slides to answer questions Slides Lectern Figure 3 Unnecessary image showing a highly stylised depiction of a gender neutral individual speaking authoritatively at a lectern. ‘Fluency in the use of teaching aids’ • Good use of Power. Point – don’t overdo the animations • Slides not too cluttered, messy – no unnecessary images. . ‘Consistently analytic, critical and/or synthetic treatment of the material’ • Don’t just report the evidence, state how reliable it is.
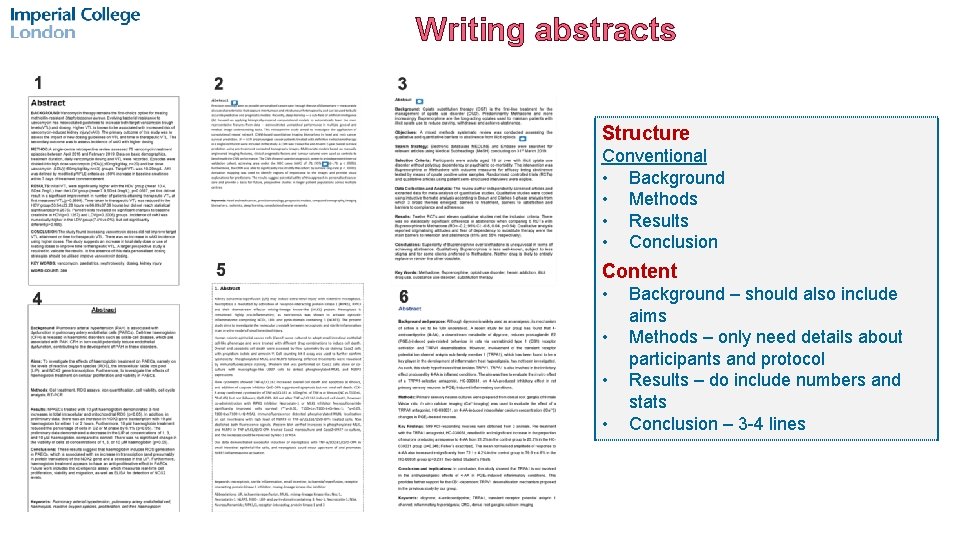
Writing abstracts Structure Conventional • Background • Methods • Results • Conclusion Content • • Background – should also include aims Methods – only need details about participants and protocol Results – do include numbers and stats Conclusion – 3 -4 lines
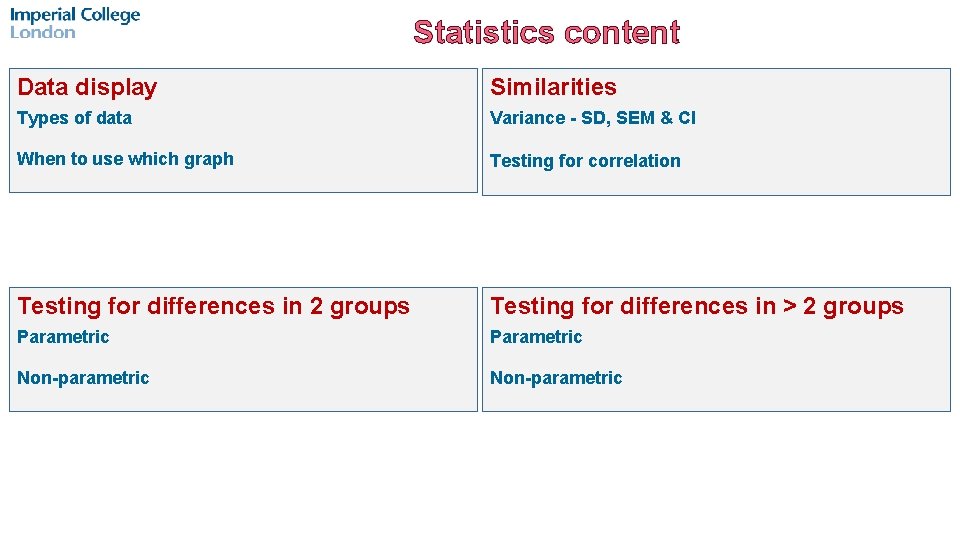
Statistics content Data display Similarities Types of data Variance - SD, SEM & CI When to use which graph Testing for correlation Testing for differences in 2 groups Testing for differences in > 2 groups Parametric Non-parametric
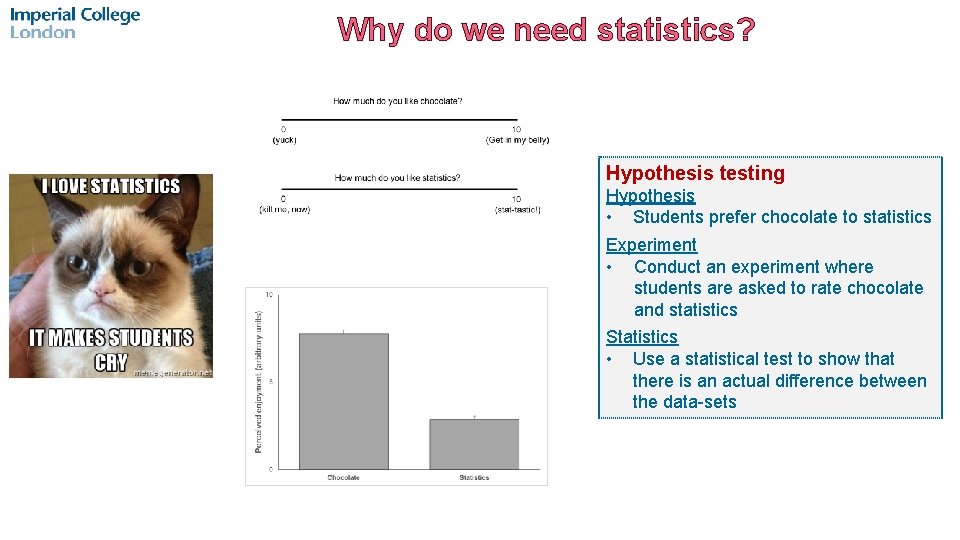
Why do we need statistics? Hypothesis testing Hypothesis • Students prefer chocolate to statistics Experiment • Conduct an experiment where students are asked to rate chocolate and statistics Statistics • Use a statistical test to show that there is an actual difference between the data-sets
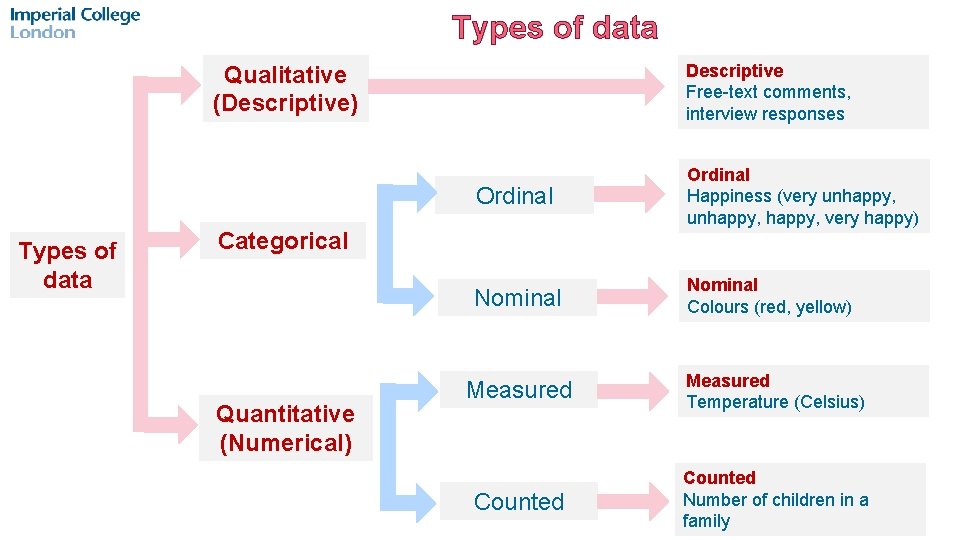
Types of data Descriptive Free-text comments, interview responses Qualitative (Descriptive) Types of data Ordinal Happiness (very unhappy, very happy) Nominal Colours (red, yellow) Categorical Quantitative (Numerical) Measured Temperature (Celsius) Counted Number of children in a family
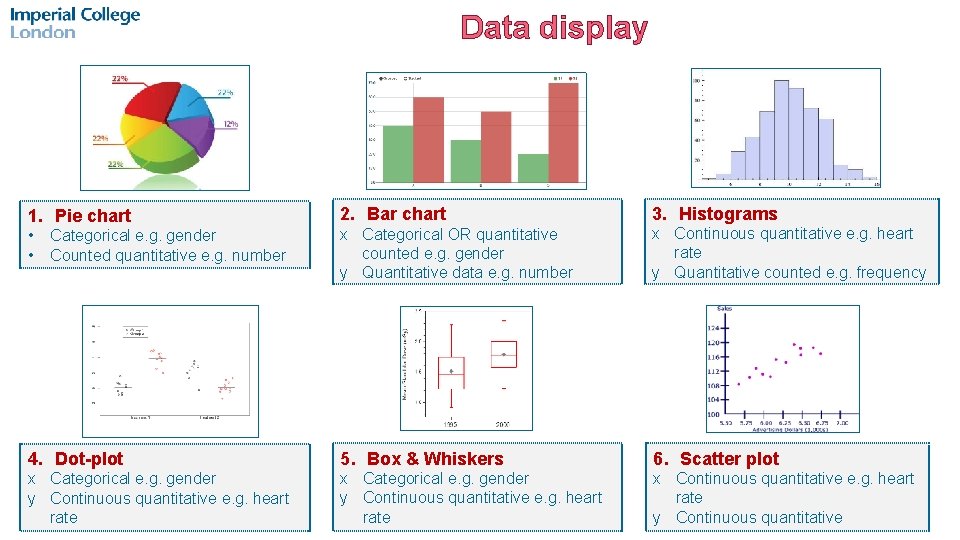
Data display 2. Bar chart 3. Histograms x Categorical OR quantitative counted e. g. gender y Quantitative data e. g. number x Continuous quantitative e. g. heart rate y Quantitative counted e. g. frequency 4. Dot-plot 5. Box & Whiskers 6. Scatter plot x Categorical e. g. gender y Continuous quantitative e. g. heart rate x Continuous quantitative e. g. heart rate y Continuous quantitative 1. Pie chart • • Categorical e. g. gender Counted quantitative e. g. number
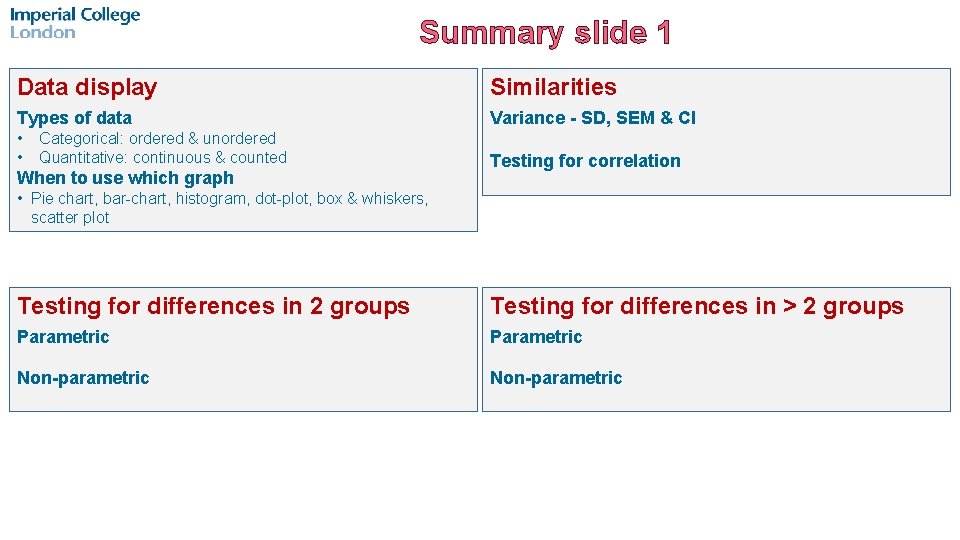
Summary slide 1 Data display Similarities Types of data Variance - SD, SEM & CI • • Testing for correlation Categorical: ordered & unordered Quantitative: continuous & counted When to use which graph • Pie chart, bar-chart, histogram, dot-plot, box & whiskers, scatter plot Testing for differences in 2 groups Testing for differences in > 2 groups Parametric Non-parametric
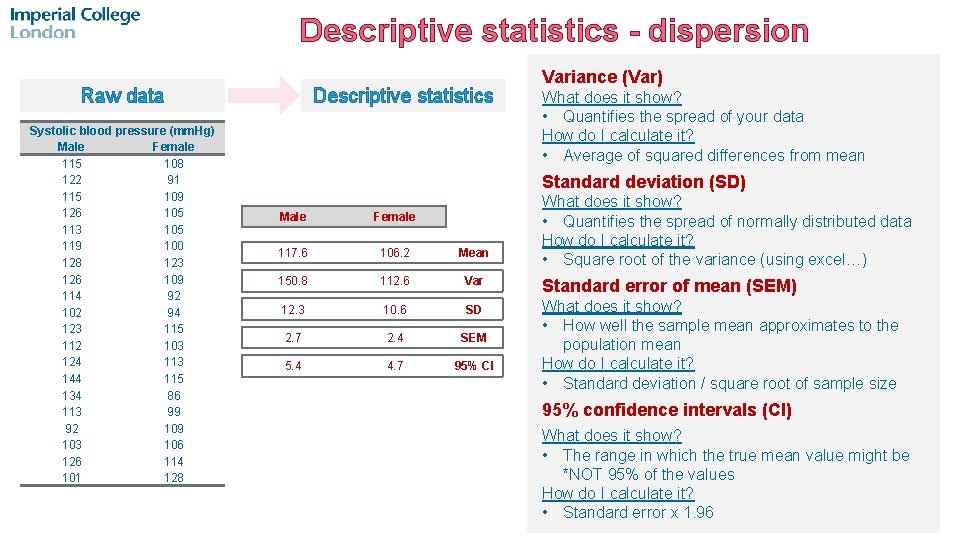
Descriptive statistics - dispersion Raw data Systolic blood pressure (mm. Hg) Male Female 115 108 122 91 115 109 126 105 113 105 119 100 128 123 126 109 114 92 102 94 123 115 112 103 124 113 144 115 134 86 113 99 92 109 103 106 126 114 101 128 Descriptive statistics Variance (Var) What does it show? • Quantifies the spread of your data How do I calculate it? • Average of squared differences from mean Standard deviation (SD) What does it show? • Quantifies the spread of normally distributed data How do I calculate it? • Square root of the variance (using excel…) Male Female 117. 6 106. 2 Mean 150. 8 112. 6 Var Standard error of mean (SEM) 12. 3 10. 6 SD 2. 7 2. 4 SEM 5. 4 4. 7 95% CI What does it show? • How well the sample mean approximates to the population mean How do I calculate it? • Standard deviation / square root of sample size 95% confidence intervals (CI) What does it show? • The range in which the true mean value might be *NOT 95% of the values How do I calculate it? • Standard error x 1. 96
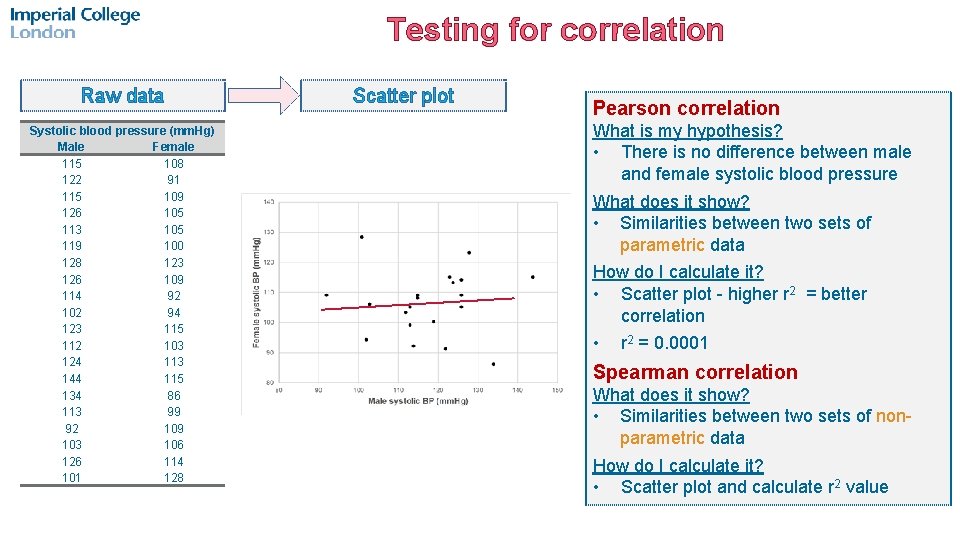
Testing for correlation Raw data Systolic blood pressure (mm. Hg) Male Female 115 108 122 91 115 109 126 105 113 105 119 100 128 123 126 109 114 92 102 94 123 115 112 103 124 113 144 115 134 86 113 99 92 109 103 106 126 114 101 128 Scatter plot Pearson correlation What is my hypothesis? • There is no difference between male and female systolic blood pressure What does it show? • Similarities between two sets of parametric data How do I calculate it? • Scatter plot - higher r 2 = better correlation • r 2 = 0. 0001 Spearman correlation What does it show? • Similarities between two sets of nonparametric data How do I calculate it? • Scatter plot and calculate r 2 value
Types of data USUALLY PARAMETRIC USUALLY NON-PARAMETRIC
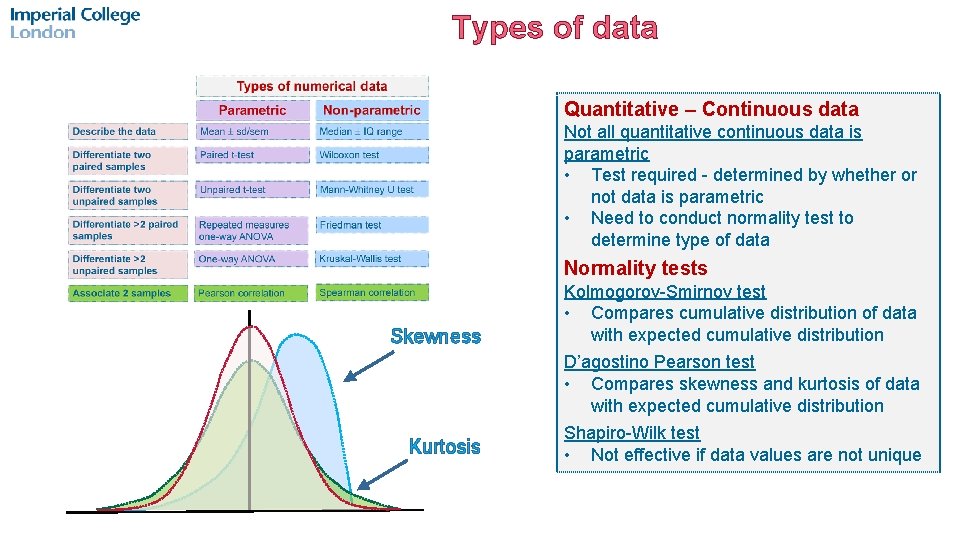
Types of data Quantitative – Continuous data Not all quantitative continuous data is parametric • Test required - determined by whether or not data is parametric • Need to conduct normality test to determine type of data Normality tests Skewness Kolmogorov-Smirnov test • Compares cumulative distribution of data with expected cumulative distribution D’agostino Pearson test • Compares skewness and kurtosis of data with expected cumulative distribution Kurtosis Shapiro-Wilk test • Not effective if data values are not unique
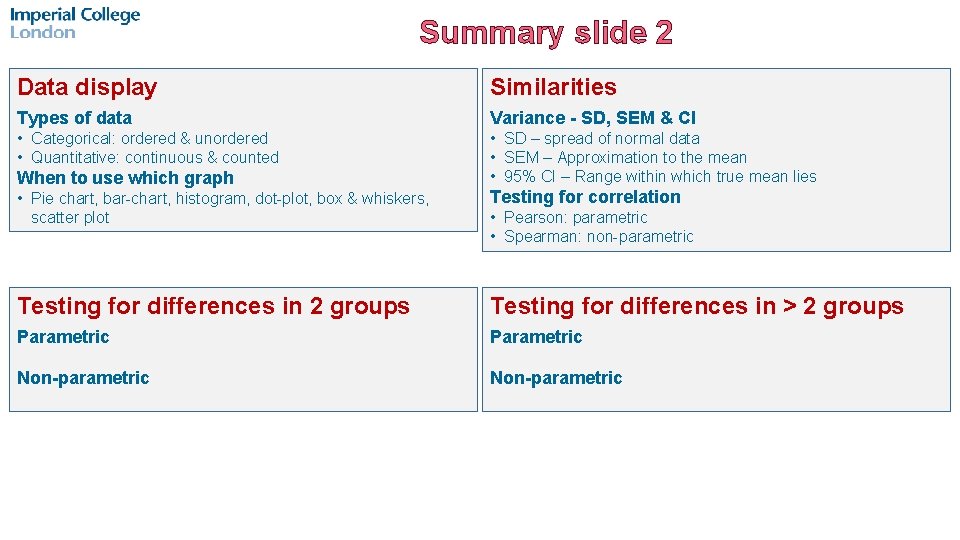
Summary slide 2 Data display Similarities Types of data Variance - SD, SEM & CI • Categorical: ordered & unordered • Quantitative: continuous & counted • SD – spread of normal data • SEM – Approximation to the mean • 95% CI – Range within which true mean lies When to use which graph • Pie chart, bar-chart, histogram, dot-plot, box & whiskers, scatter plot Testing for correlation Testing for differences in 2 groups Testing for differences in > 2 groups Parametric Non-parametric • Pearson: parametric • Spearman: non-parametric
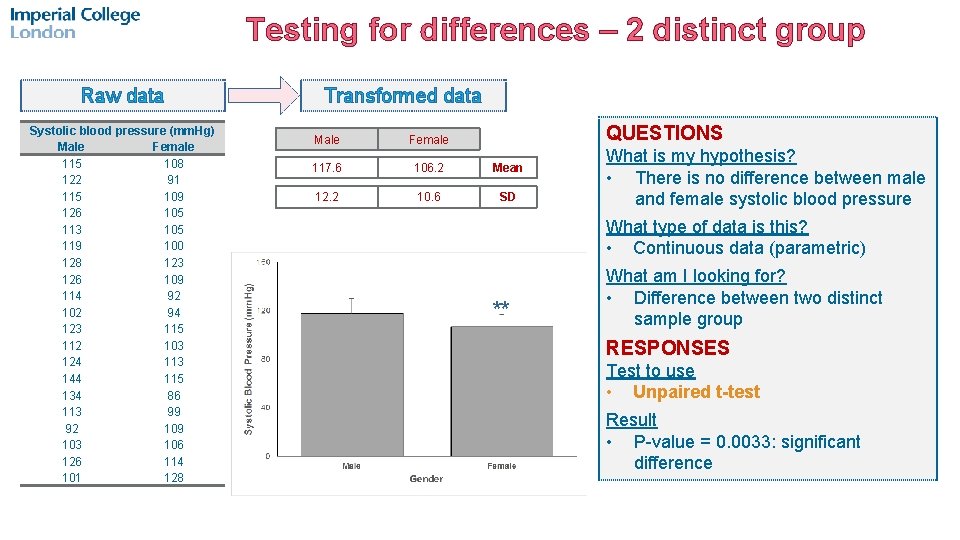
Testing for differences – 2 distinct group Raw data Systolic blood pressure (mm. Hg) Male Female 115 108 122 91 115 109 126 105 113 105 119 100 128 123 126 109 114 92 102 94 123 115 112 103 124 113 144 115 134 86 113 99 92 109 103 106 126 114 101 128 Transformed data QUESTIONS Male Female 117. 6 106. 2 Mean 12. 2 10. 6 SD What is my hypothesis? • There is no difference between male and female systolic blood pressure What type of data is this? • Continuous data (parametric) ** What am I looking for? • Difference between two distinct sample group RESPONSES Test to use • Unpaired t-test Result • P-value = 0. 0033: significant difference
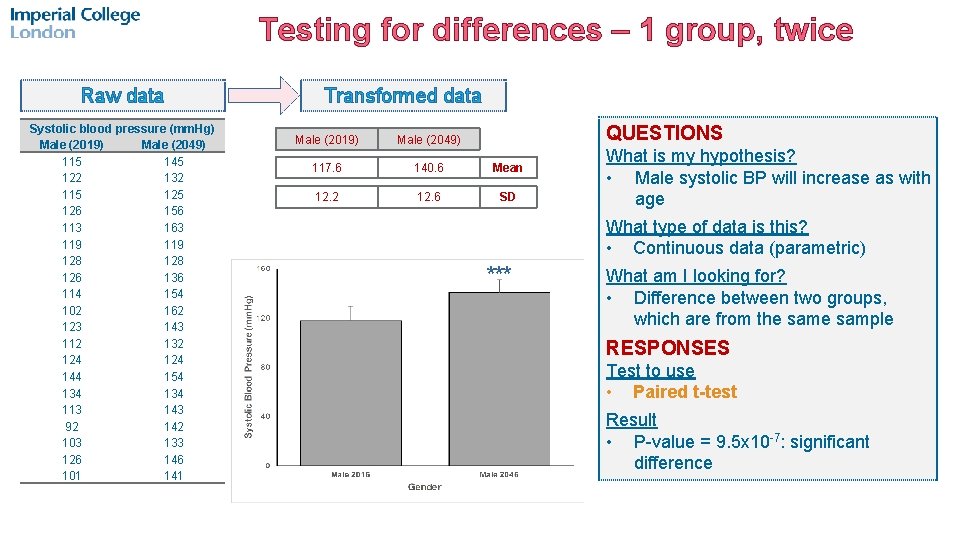
Testing for differences – 1 group, twice Raw data Systolic blood pressure (mm. Hg) Male (2019) Male (2049) 115 145 122 132 115 126 156 113 163 119 128 126 136 114 154 102 162 123 143 112 132 124 144 154 134 113 143 92 142 103 133 126 146 101 141 Transformed data QUESTIONS Male (2019) Male (2049) 117. 6 140. 6 Mean 12. 2 12. 6 SD What is my hypothesis? • Male systolic BP will increase as with age What type of data is this? • Continuous data (parametric) *** What am I looking for? • Difference between two groups, which are from the sample RESPONSES Test to use • Paired t-test Result • P-value = 9. 5 x 10 -7: significant difference
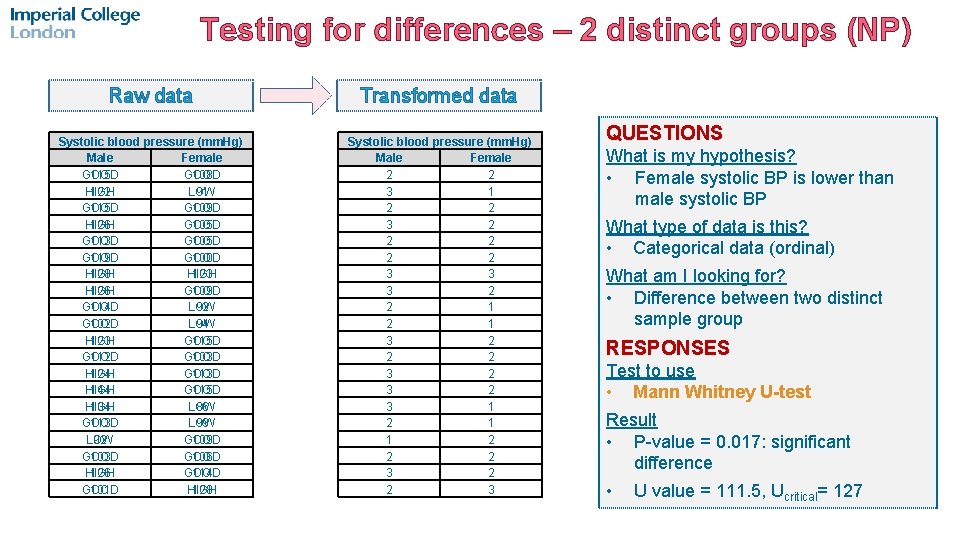
Testing for differences – 2 distinct groups (NP) Raw data Transformed data Systolic blood pressure (mm. Hg) Male Female GOOD 115 GOOD 108 HIGH 122 LOW 91 GOOD 115 GOOD 109 HIGH 126 GOOD 105 GOOD 113 GOOD 105 GOOD 119 GOOD 100 HIGH 128 HIGH 123 HIGH 126 GOOD 109 GOOD 114 LOW 92 GOOD 102 LOW 94 HIGH 123 GOOD 115 GOOD 112 GOOD 103 HIGH 124 GOOD 113 HIGH 144 GOOD 115 HIGH 134 LOW 86 GOOD 113 LOW 99 LOW 92 GOOD 109 GOOD 103 GOOD 106 HIGH 126 GOOD 114 GOOD 101 HIGH 128 Systolic blood pressure (mm. Hg) Male Female 2 2 3 1 2 2 3 2 2 2 3 3 3 2 2 1 3 2 2 2 3 2 3 1 2 1 1 2 2 2 3 QUESTIONS What is my hypothesis? • Female systolic BP is lower than male systolic BP What type of data is this? • Categorical data (ordinal) What am I looking for? • Difference between two distinct sample group RESPONSES Test to use • Mann Whitney U-test Result • P-value = 0. 017: significant difference • U value = 111. 5, Ucritical= 127
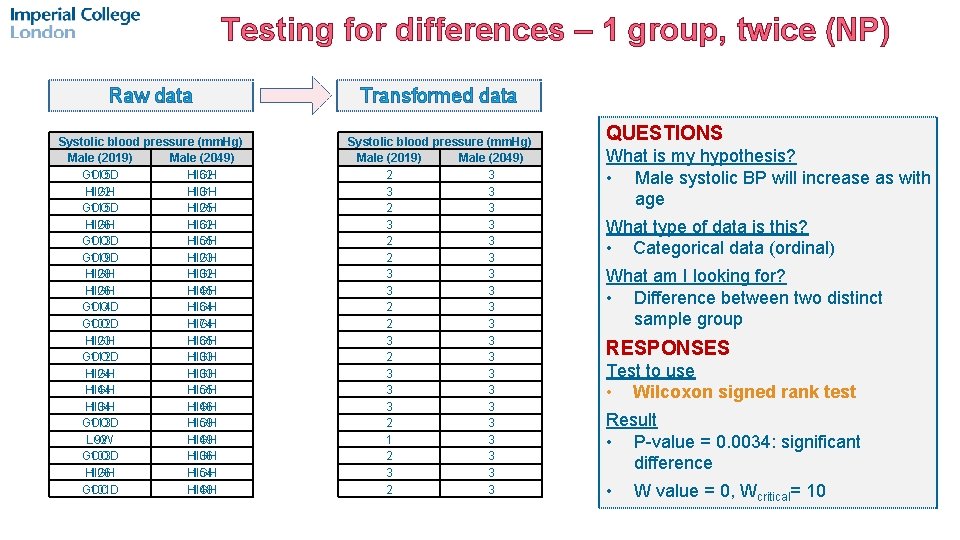
Testing for differences – 1 group, twice (NP) Raw data Transformed data Systolic blood pressure (mm. Hg) Male (2019) Male (2049) GOOD 115 HIGH 162 HIGH 122 HIGH 131 GOOD 115 HIGH 126 HIGH 162 GOOD 113 HIGH 155 GOOD 119 HIGH 123 HIGH 128 HIGH 132 HIGH 126 HIGH 145 GOOD 114 HIGH 164 GOOD 102 HIGH 174 HIGH 123 HIGH 165 GOOD 112 HIGH 133 HIGH 124 HIGH 133 HIGH 144 HIGH 155 HIGH 134 HIGH 146 GOOD 113 HIGH 159 LOW 92 HIGH 149 GOOD 103 HIGH 136 HIGH 126 HIGH 154 GOOD 101 HIGH 148 Systolic blood pressure (mm. Hg) Male (2019) Male (2049) 2 3 3 3 2 3 3 3 3 2 3 1 3 2 3 3 3 2 3 QUESTIONS What is myofhypothesis? type data is this? • Categorical Male systolicdata BP (ordinal) will increase as with age What am I looking for? What type of data is this? • Difference between two groups, • Categorical datathe (ordinal) which are from same sample What am I looking for? RESPONSES • Test. Difference to use between two distinct sample group • Wilcoxon signed-rank test RESPONSES Result Test to use deviation / square root of • Standard • Wilcoxon signed rank test sample size Result • P-value = 0. 0034: significant difference • W value = 0, Wcritical= 10
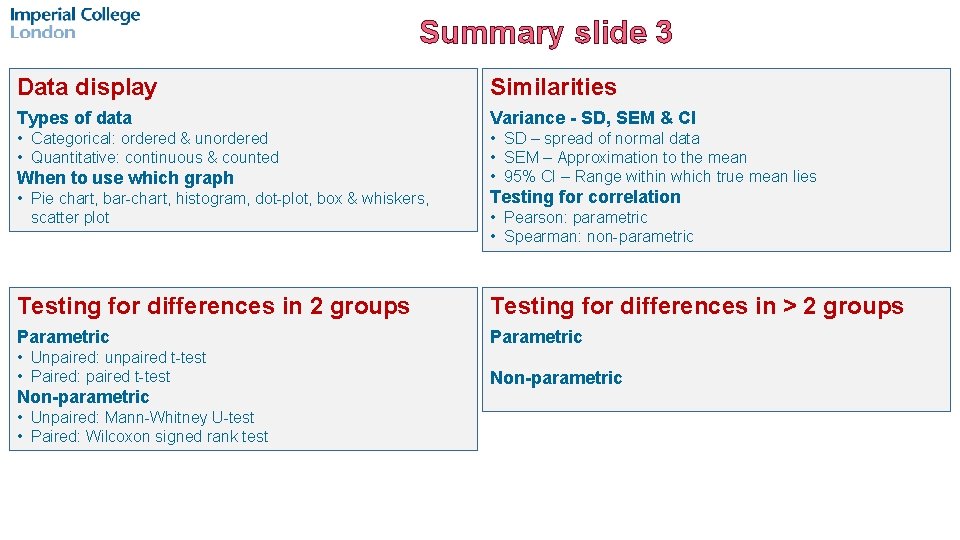
Summary slide 3 Data display Similarities Types of data Variance - SD, SEM & CI • Categorical: ordered & unordered • Quantitative: continuous & counted • SD – spread of normal data • SEM – Approximation to the mean • 95% CI – Range within which true mean lies When to use which graph • Pie chart, bar-chart, histogram, dot-plot, box & whiskers, scatter plot Testing for correlation Testing for differences in 2 groups Testing for differences in > 2 groups Parametric • Unpaired: unpaired t-test • Paired: paired t-test Non-parametric • Unpaired: Mann-Whitney U-test • Paired: Wilcoxon signed rank test • Pearson: parametric • Spearman: non-parametric
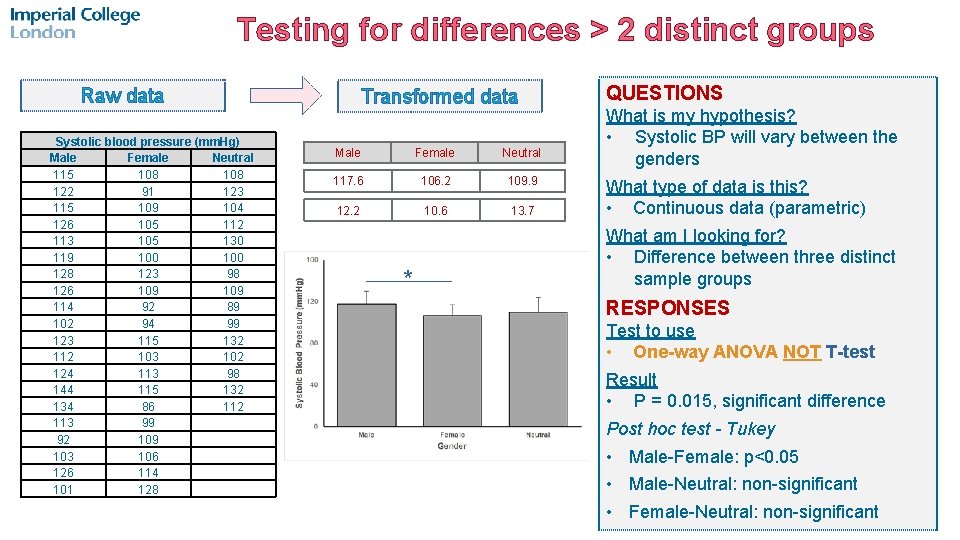
Testing for differences > 2 distinct groups Raw data Systolic blood pressure (mm. Hg) Male Female Neutral 115 108 122 91 123 115 109 104 126 105 112 113 105 130 119 100 128 123 98 126 109 114 92 89 102 94 99 123 115 132 112 103 102 124 113 98 144 115 132 134 86 112 113 99 92 109 103 106 126 114 101 128 Transformed data Male Female Neutral 117. 6 106. 2 109. 9 12. 2 10. 6 13. 7 * QUESTIONS What is my hypothesis? • Systolic BP will vary between the genders What type of data is this? • Continuous data (parametric) What am I looking for? • Difference between three distinct sample groups RESPONSES Test to use • One-way ANOVA NOT T-test Result • P = 0. 015, significant difference Post hoc test - Tukey • Male-Female: p<0. 05 • Male-Neutral: non-significant • Female-Neutral: non-significant
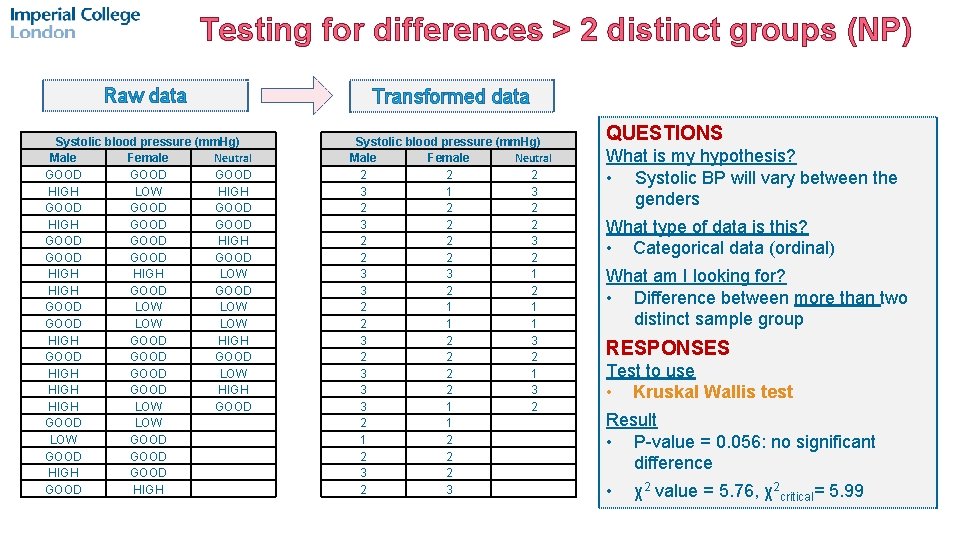
Testing for differences > 2 distinct groups (NP) Raw data Transformed data Systolic blood pressure (mm. Hg) Neutral Male Female GOOD HIGH LOW HIGH GOOD GOOD HIGH GOOD HIGH LOW HIGH GOOD LOW LOW HIGH GOOD HIGH GOOD LOW HIGH GOOD HIGH LOW GOOD GOOD HIGH Systolic blood pressure (mm. Hg) Neutral Male Female 2 2 2 3 1 3 2 2 2 2 3 3 1 3 2 2 2 1 1 3 2 2 2 3 2 1 3 2 3 3 1 2 2 1 1 2 2 2 3 QUESTIONS What is my hypothesis? • Systolic BP will vary between the genders What type of data is this? • Categorical data (ordinal) What am I looking for? • Difference between more than two distinct sample group RESPONSES Test to use • Kruskal Wallis test Result • P-value = 0. 056: no significant difference • χ2 value = 5. 76, χ2 critical= 5. 99
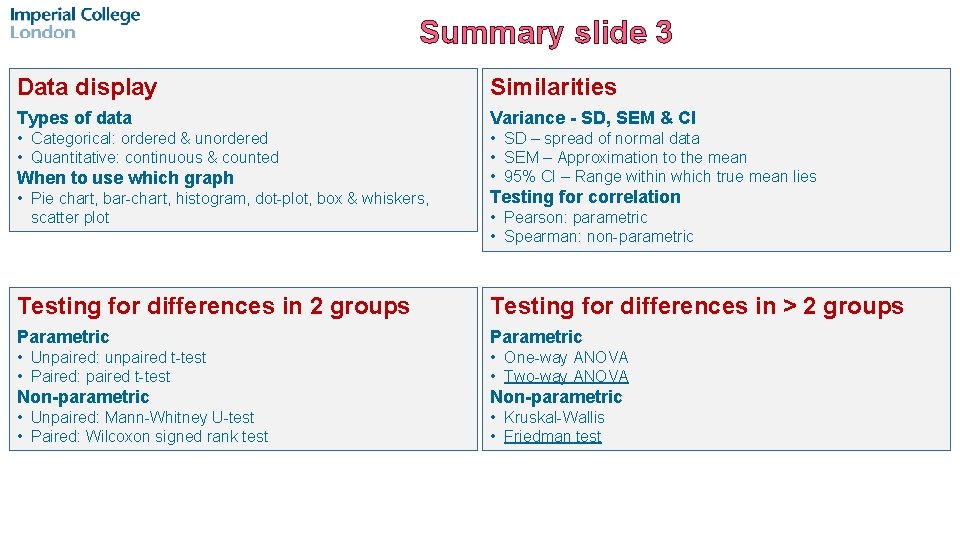
Summary slide 3 Data display Similarities Types of data Variance - SD, SEM & CI • Categorical: ordered & unordered • Quantitative: continuous & counted • SD – spread of normal data • SEM – Approximation to the mean • 95% CI – Range within which true mean lies When to use which graph • Pie chart, bar-chart, histogram, dot-plot, box & whiskers, scatter plot Testing for correlation Testing for differences in 2 groups Testing for differences in > 2 groups Parametric • Unpaired: unpaired t-test • Paired: paired t-test • One-way ANOVA • Two-way ANOVA Non-parametric • Unpaired: Mann-Whitney U-test • Paired: Wilcoxon signed rank test • Kruskal-Wallis • Friedman test • Pearson: parametric • Spearman: non-parametric
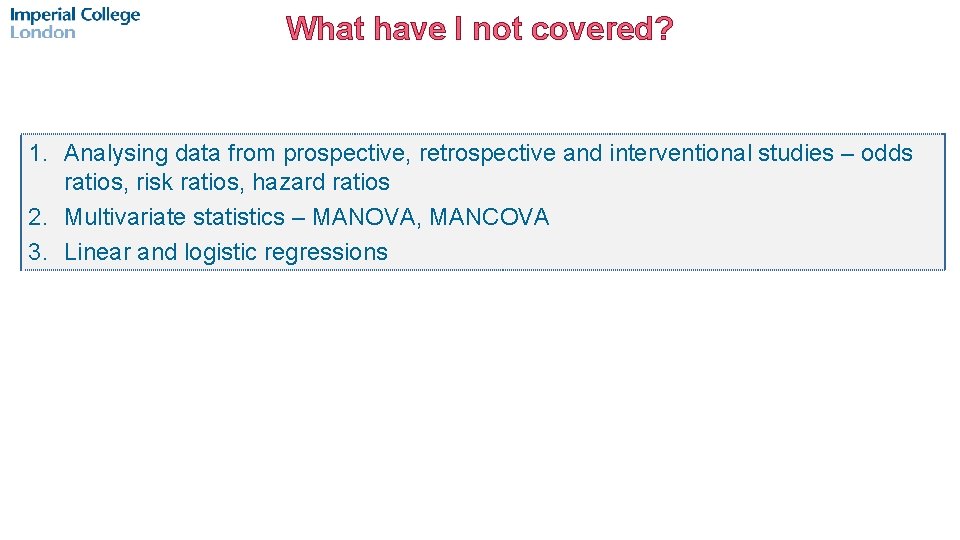
What have I not covered? 1. Analysing data from prospective, retrospective and interventional studies – odds ratios, risk ratios, hazard ratios 2. Multivariate statistics – MANOVA, MANCOVA 3. Linear and logistic regressions
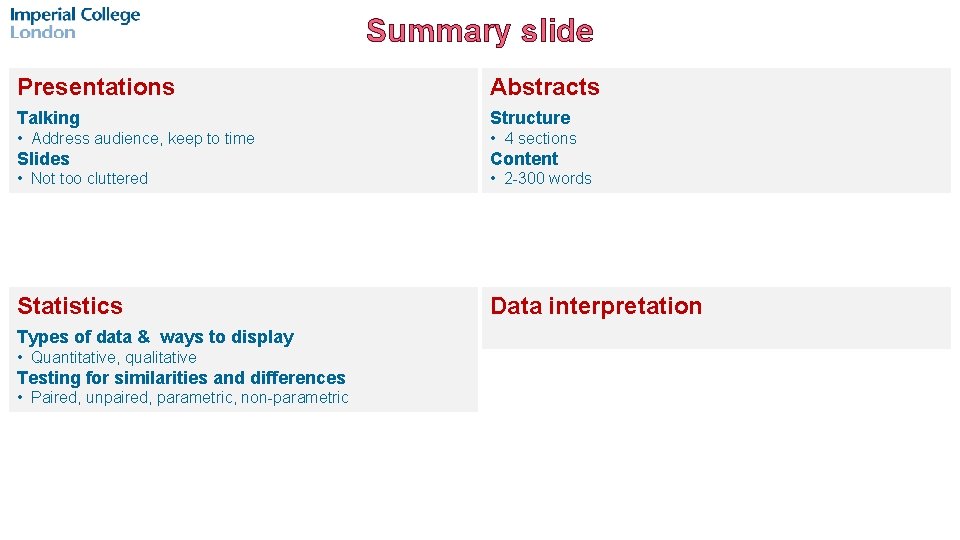
Summary slide Presentations Abstracts Talking Structure • Address audience, keep to time • 4 sections Slides Content • Not too cluttered • 2 -300 words Statistics Data interpretation Types of data & ways to display • Quantitative, qualitative Testing for similarities and differences • Paired, unpaired, parametric, non-parametric
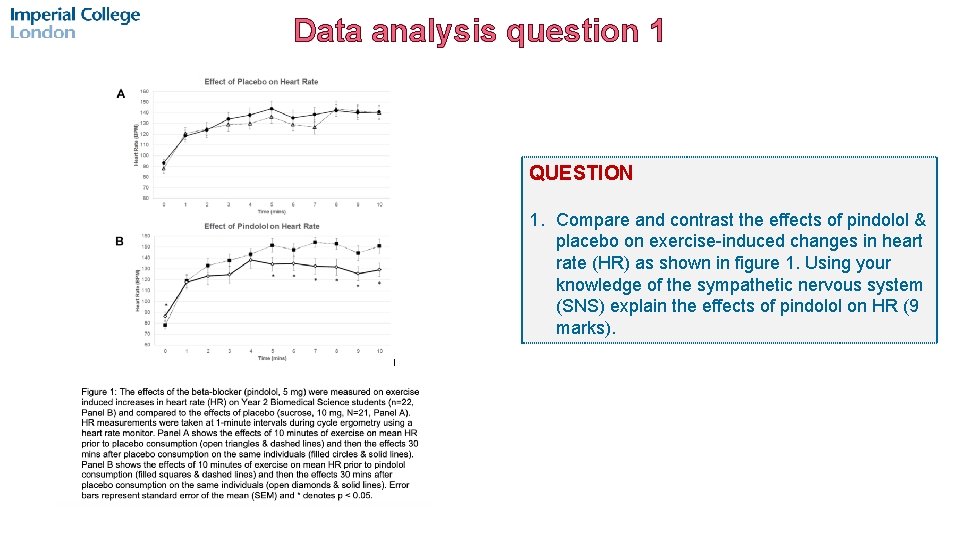
Data analysis question 1 QUESTION 1. Compare and contrast the effects of pindolol & placebo on exercise-induced changes in heart rate (HR) as shown in figure 1. Using your knowledge of the sympathetic nervous system (SNS) explain the effects of pindolol on HR (9 marks).
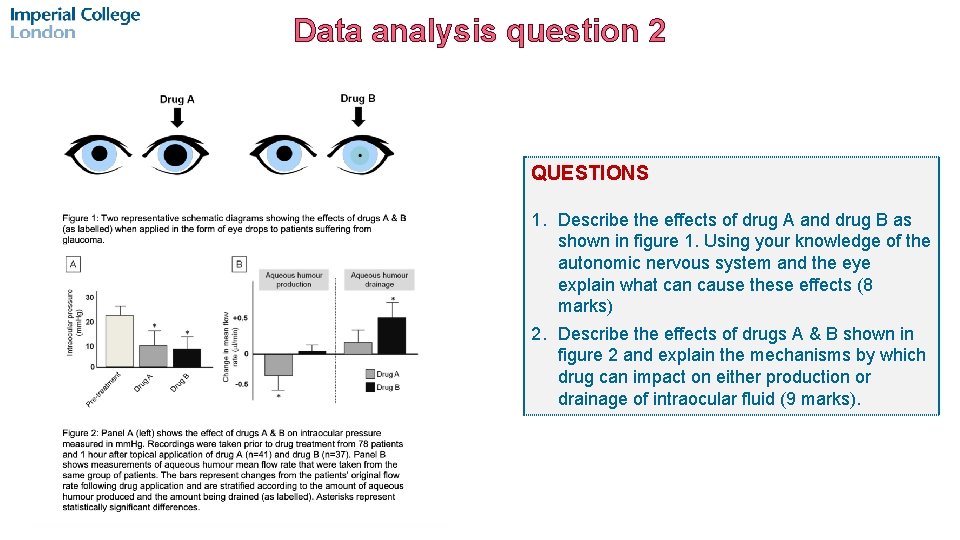
Data analysis question 2 QUESTIONS 1. Describe the effects of drug A and drug B as shown in figure 1. Using your knowledge of the autonomic nervous system and the eye explain what can cause these effects (8 marks) 2. Describe the effects of drugs A & B shown in figure 2 and explain the mechanisms by which drug can impact on either production or drainage of intraocular fluid (9 marks).
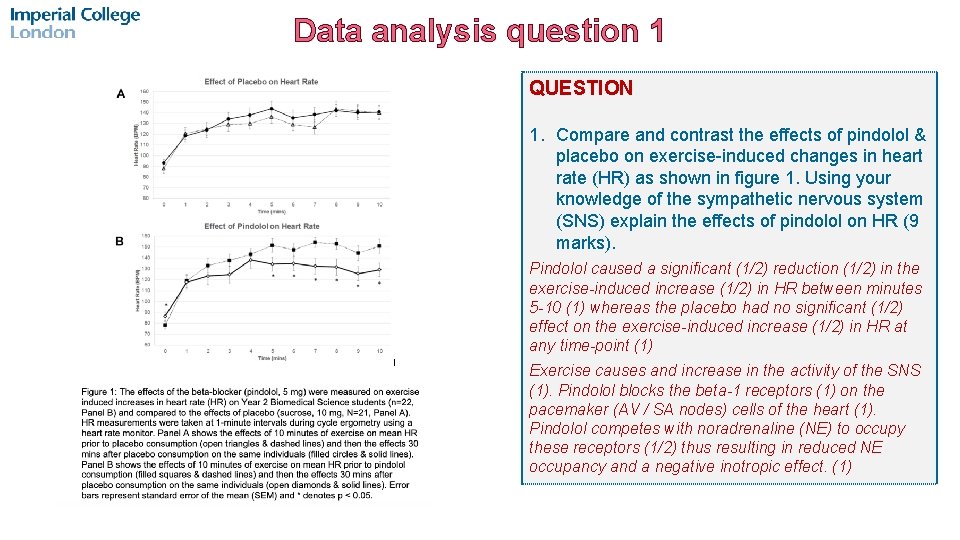
Data analysis question 1 QUESTION 1. Compare and contrast the effects of pindolol & placebo on exercise-induced changes in heart rate (HR) as shown in figure 1. Using your knowledge of the sympathetic nervous system (SNS) explain the effects of pindolol on HR (9 marks). Pindolol caused a significant (1/2) reduction (1/2) in the exercise-induced increase (1/2) in HR between minutes 5 -10 (1) whereas the placebo had no significant (1/2) effect on the exercise-induced increase (1/2) in HR at any time-point (1) Exercise causes and increase in the activity of the SNS (1). Pindolol blocks the beta-1 receptors (1) on the pacemaker (AV / SA nodes) cells of the heart (1). Pindolol competes with noradrenaline (NE) to occupy these receptors (1/2) thus resulting in reduced NE occupancy and a negative inotropic effect. (1)
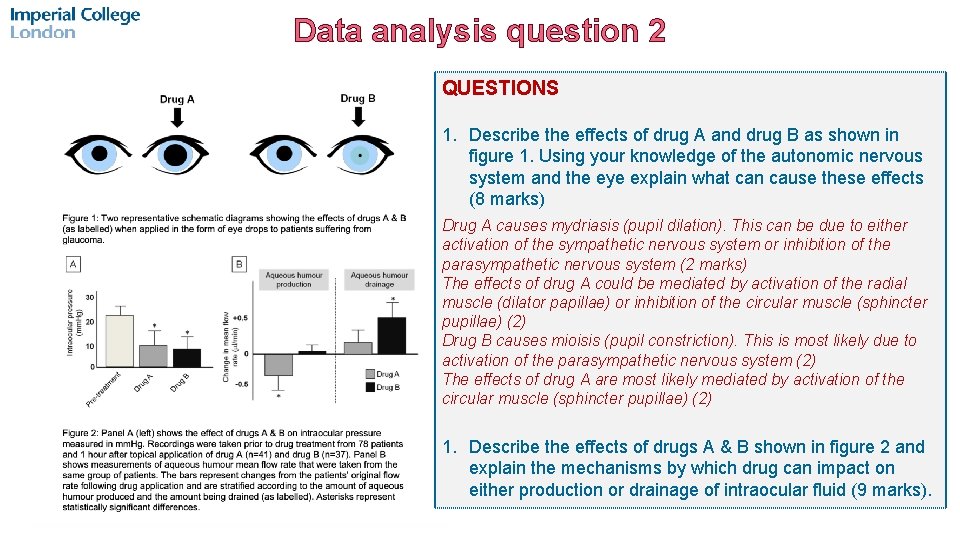
Data analysis question 2 QUESTIONS 1. Describe the effects of drug A and drug B as shown in figure 1. Using your knowledge of the autonomic nervous system and the eye explain what can cause these effects (8 marks) Drug A causes mydriasis (pupil dilation). This can be due to either activation of the sympathetic nervous system or inhibition of the parasympathetic nervous system (2 marks) The effects of drug A could be mediated by activation of the radial muscle (dilator papillae) or inhibition of the circular muscle (sphincter pupillae) (2) Drug B causes mioisis (pupil constriction). This is most likely due to activation of the parasympathetic nervous system (2) The effects of drug A are most likely mediated by activation of the circular muscle (sphincter pupillae) (2) 1. Describe the effects of drugs A & B shown in figure 2 and explain the mechanisms by which drug can impact on either production or drainage of intraocular fluid (9 marks).
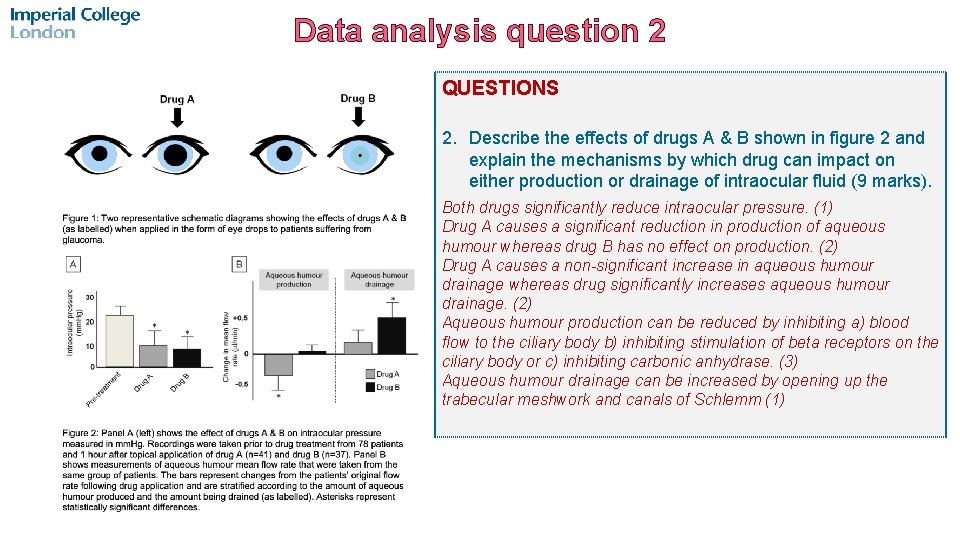
Data analysis question 2 QUESTIONS 2. Describe the effects of drugs A & B shown in figure 2 and explain the mechanisms by which drug can impact on either production or drainage of intraocular fluid (9 marks). Both drugs significantly reduce intraocular pressure. (1) Drug A causes a significant reduction in production of aqueous humour whereas drug B has no effect on production. (2) Drug A causes a non-significant increase in aqueous humour drainage whereas drug significantly increases aqueous humour drainage. (2) Aqueous humour production can be reduced by inhibiting a) blood flow to the ciliary body b) inhibiting stimulation of beta receptors on the ciliary body or c) inhibiting carbonic anhydrase. (3) Aqueous humour drainage can be increased by opening up the trabecular meshwork and canals of Schlemm (1)
- Slides: 29