
Bruin at Work Case Daniel De Wees Justin

Bruin at Work Case Daniel De. Wees Justin Widjaja Samuel Djahanbani April 5, 2012
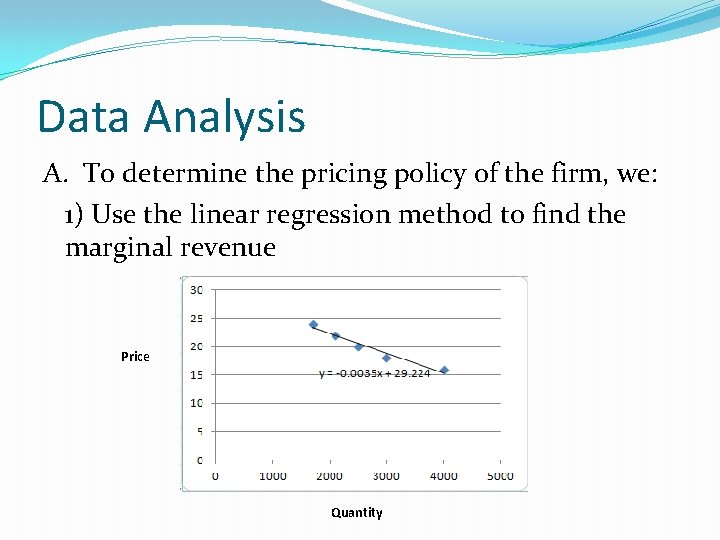
Data Analysis A. To determine the pricing policy of the firm, we: 1) Use the linear regression method to find the marginal revenue Price Quantity
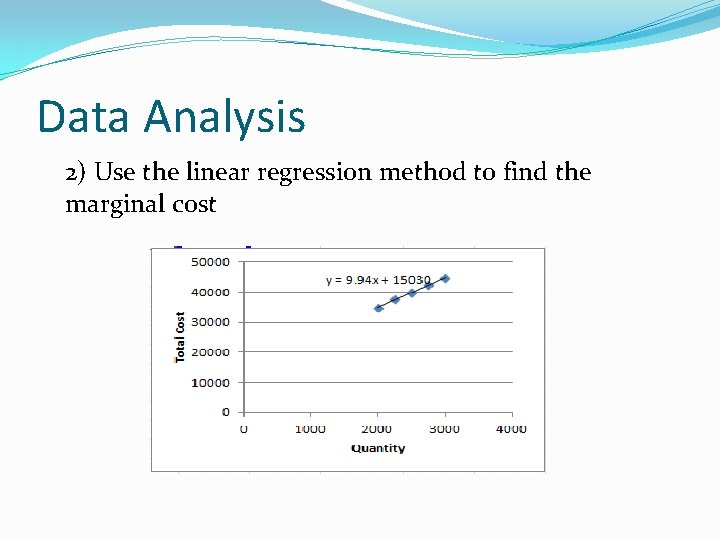
Data Analysis 2) Use the linear regression method to find the marginal cost

Data Analysis 3) We derive a formula for marginal revenue and marginal cost within this relevant range �If MR>MC at our current price, our product is overpriced, and vice versa
Demand Increase B. With a 10% increase in demand at every price: �The total cost curve remains unchanged and it results in a marginal cost of 9. 94 given our current capacity �Our demand curve has changed and is now: P=-0. 0015 Q+29. 22 �Giving us a total revenue = P*Q= -0. 00315 Q 2+29. 22 Q �And a marginal revenue = -0. 0063 Q+29. 22
Demand Increase �At the current price of 20 our quantity sold is 2750 �Our resulting marginal revenue is then 11. 9, which is greater than our marginal cost of 9. 44 �Since at our current price MR>MC, we learn that our product is overpriced given our current fixed factors of production
Sensitivity Analysis C. Optimistic Marketing Numbers: �There would be less of an impact on the sales from a change in the price than she predicted �Based on our analysis in part b, we determined that the product was overpriced if the demand were to increase by 10% �The magnitude of the excess in price would be lower (thus the product would be less overpriced) if the marketing manager was just a bit optimistic in her answers
Sensitivity Analysis �If she was way too optimistic, it is possible our answer would change to the point where the product would be priced perfectly or even underpriced under the set conditions �If sales barely changed at all (or even decreased) from a 10% or 20% increase in price, the product could become underpriced �With an increase in demand, the marginal cost is constant, but the marginal revenue could be lower
- Slides: 8