
Bronx Community Health Dashboard Asthma Last Updated 9242019
Bronx Community Health Dashboard: Asthma Last Updated: 9/24/2019 See end of presentation for more information about this project and links to data sources. 1
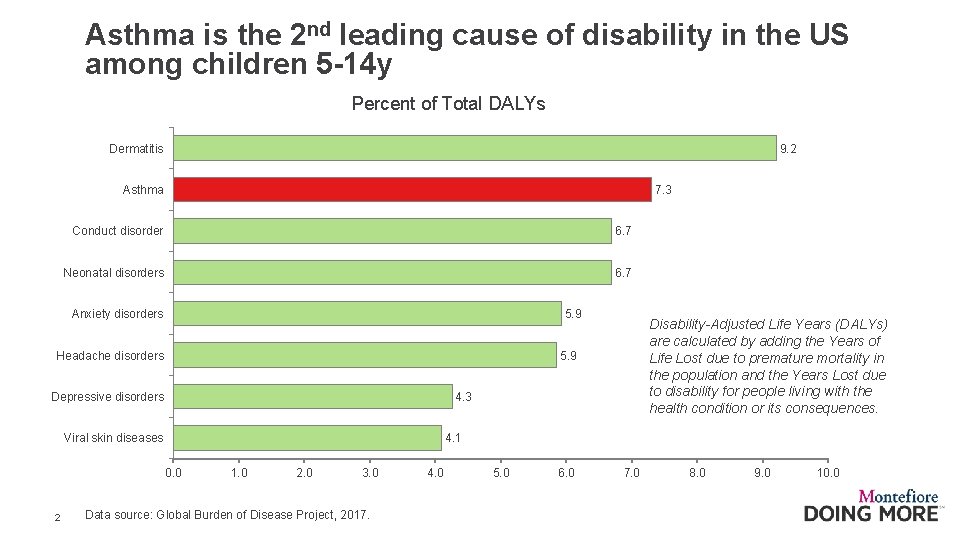
Asthma is the 2 nd leading cause of disability in the US among children 5 -14 y Percent of Total DALYs 9. 2 Dermatitis 7. 3 Asthma Conduct disorder 6. 7 Neonatal disorders 6. 7 Anxiety disorders 5. 9 Headache disorders 5. 9 Depressive disorders 4. 3 Viral skin diseases 4. 1 0. 0 2 Disability-Adjusted Life Years (DALYs) are calculated by adding the Years of Life Lost due to premature mortality in the population and the Years Lost due to disability for people living with the health condition or its consequences. 1. 0 2. 0 3. 0 Data source: Global Burden of Disease Project, 2017. 4. 0 5. 0 6. 0 7. 0 8. 0 9. 0 10. 0
Child & adolescent asthma Lifetime prevalence | Current asthma | Asthma severity | Asthma ED visits | Asthma hospitalizations 3
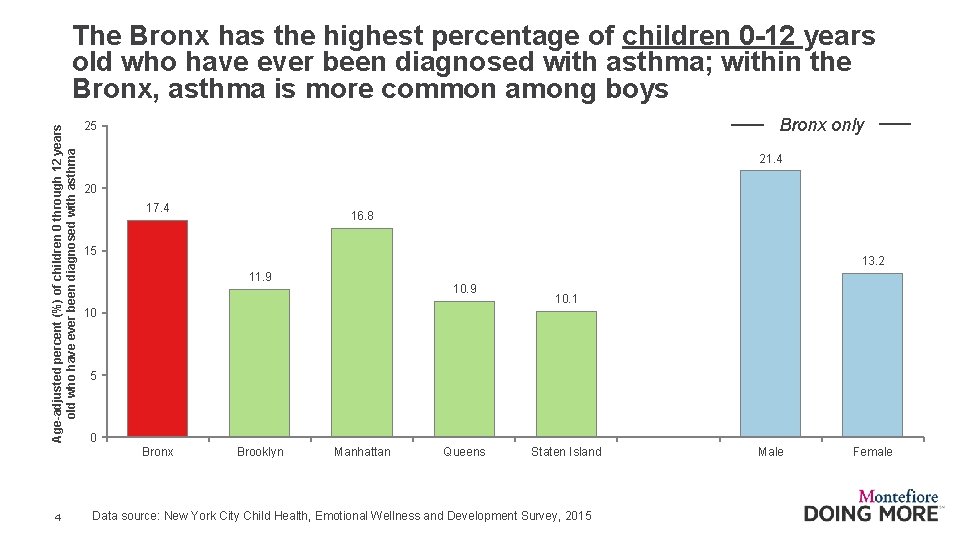
Age-adjusted percent (%) of children 0 through 12 years old who have ever been diagnosed with asthma The Bronx has the highest percentage of children 0 -12 years old who have ever been diagnosed with asthma; within the Bronx, asthma is more common among boys Bronx only 25 21. 4 20 17. 4 15 13. 2 11. 9 10. 1 10 5 0 Bronx 4 16. 8 Brooklyn Manhattan Queens Staten Island Data source: New York City Child Health, Emotional Wellness and Development Survey, 2015 Male Female
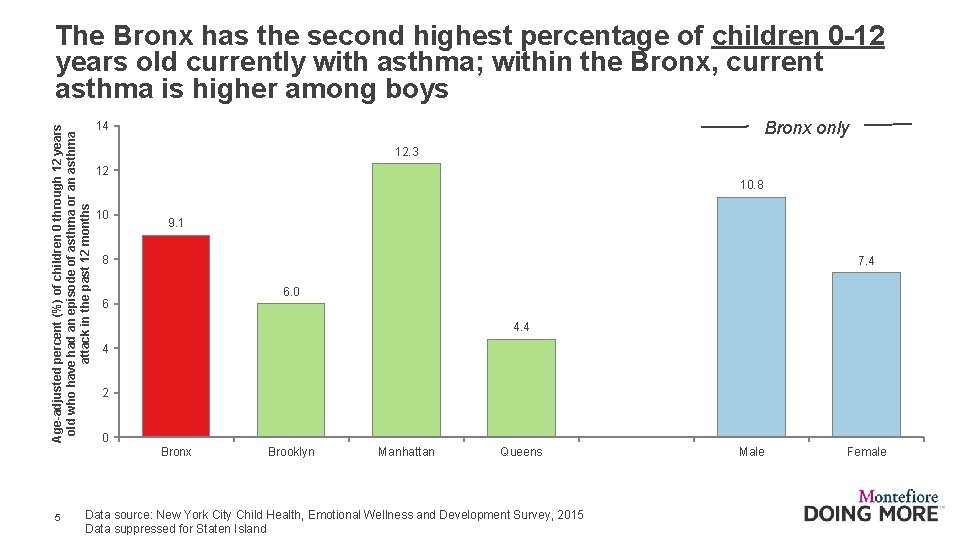
Age-adjusted percent (%) of children 0 through 12 years old who have had an episode of asthma or an asthma attack in the past 12 months The Bronx has the second highest percentage of children 0 -12 years old currently with asthma; within the Bronx, current asthma is higher among boys Bronx only 14 12. 3 12 10. 8 10 9. 1 8 7. 4 6. 0 6 4. 4 4 2 0 Bronx 5 Brooklyn Manhattan Queens Data source: New York City Child Health, Emotional Wellness and Development Survey, 2015 Data suppressed for Staten Island Male Female
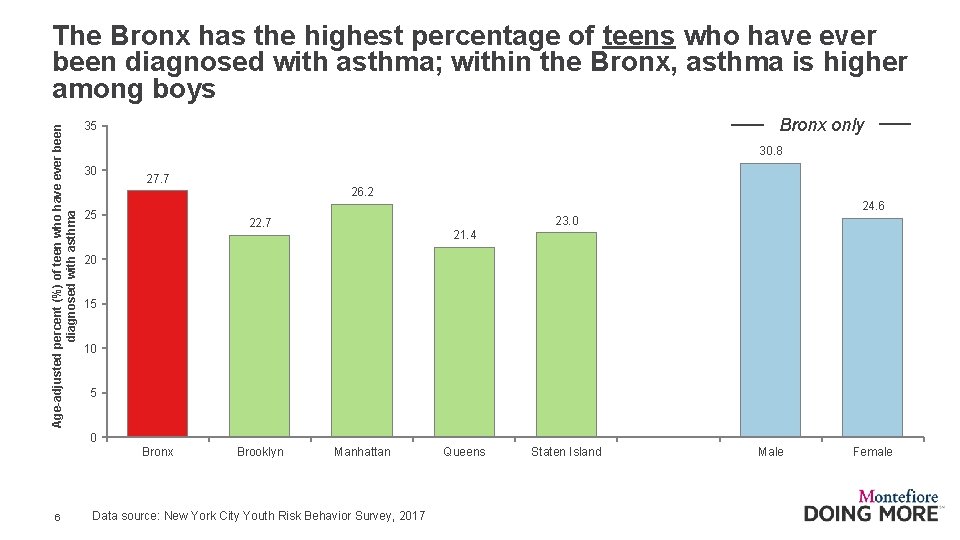
Age-adjusted percent (%) of teen who have ever been diagnosed with asthma The Bronx has the highest percentage of teens who have ever been diagnosed with asthma; within the Bronx, asthma is higher among boys Bronx only 35 30. 8 30 27. 7 26. 2 24. 6 25 23. 0 22. 7 21. 4 20 15 10 5 0 Bronx 6 Brooklyn Manhattan Data source: New York City Youth Risk Behavior Survey, 2017 Queens Staten Island Male Female
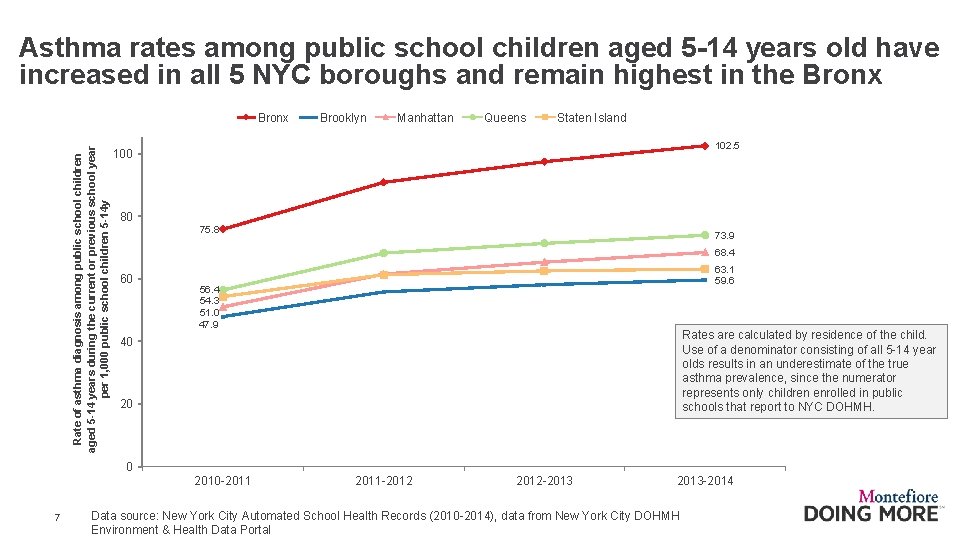
Asthma rates among public school children aged 5 -14 years old have increased in all 5 NYC boroughs and remain highest in the Bronx Rate of asthma diagnosis among public school children aged 5 -14 years during the current or previous school year per 1, 000 public school children 5 -14 y Bronx Brooklyn Manhattan Queens Staten Island 102. 5 100 80 75. 8 73. 9 68. 4 60 63. 1 59. 6 56. 4 54. 3 51. 0 47. 9 Rates are calculated by residence of the child. Use of a denominator consisting of all 5 -14 year olds results in an underestimate of the true asthma prevalence, since the numerator represents only children enrolled in public schools that report to NYC DOHMH. 40 2010 -2011 7 2011 -2012 -2013 -2014 Data source: New York City Automated School Health Records (2010 -2014), data from New York City DOHMH Environment & Health Data Portal
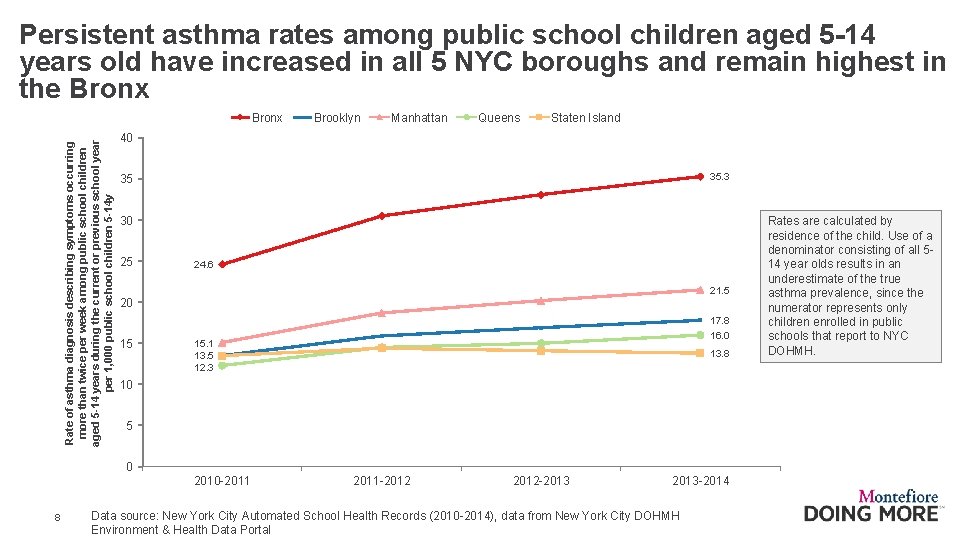
Persistent asthma rates among public school children aged 5 -14 years old have increased in all 5 NYC boroughs and remain highest in the Bronx Rate of asthma diagnosis describing symptoms occurring more than twice per week among public school children aged 5 -14 years during the current or previous school year per 1, 000 public school children 5 -14 y Bronx Brooklyn Manhattan Queens Staten Island 40 35. 3 35 30 25 24. 6 21. 5 20 15 17. 8 16. 0 15. 1 13. 5 12. 3 13. 8 10 5 0 2010 -2011 8 2011 -2012 -2013 -2014 Data source: New York City Automated School Health Records (2010 -2014), data from New York City DOHMH Environment & Health Data Portal Rates are calculated by residence of the child. Use of a denominator consisting of all 514 year olds results in an underestimate of the true asthma prevalence, since the numerator represents only children enrolled in public schools that report to NYC DOHMH.
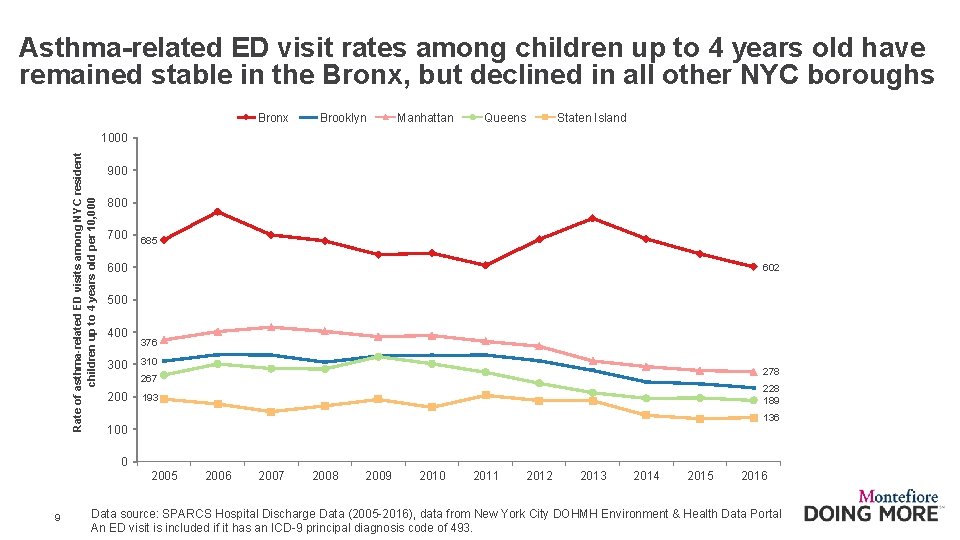
Asthma-related ED visit rates among children up to 4 years old have remained stable in the Bronx, but declined in all other NYC boroughs Bronx Brooklyn Manhattan Queens Staten Island Rate of asthma-related ED visits among NYC resident children up to 4 years old per 10, 000 1000 900 800 700 685 600 602 500 400 376 310 278 267 200 228 189 193 136 100 0 2005 9 2006 2007 2008 2009 2010 2011 2012 2013 2014 2015 2016 Data source: SPARCS Hospital Discharge Data (2005 -2016), data from New York City DOHMH Environment & Health Data Portal An ED visit is included if it has an ICD-9 principal diagnosis code of 493.
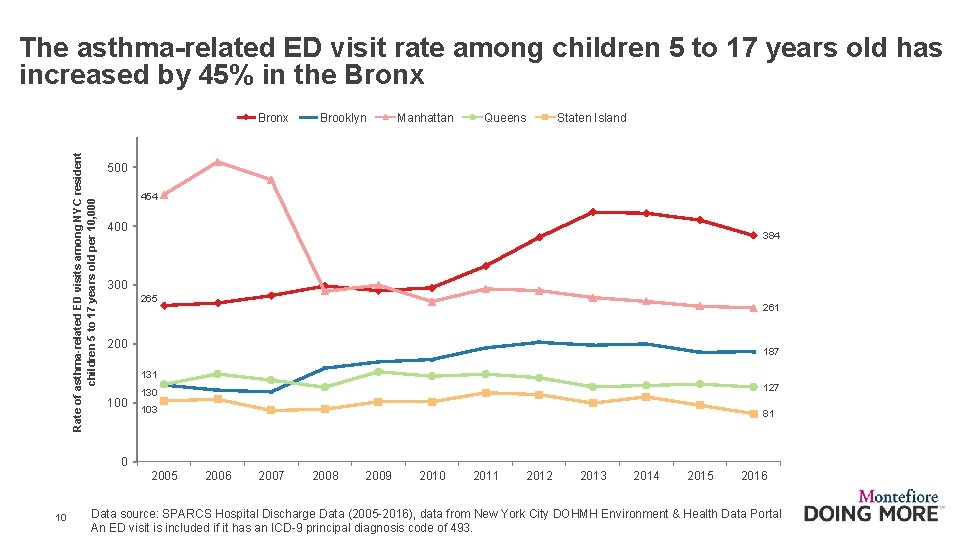
The asthma-related ED visit rate among children 5 to 17 years old has increased by 45% in the Bronx Rate of asthma-related ED visits among NYC resident children 5 to 17 years old per 10, 000 Bronx Brooklyn Manhattan Queens Staten Island 500 454 400 384 300 265 261 200 187 131 100 130 127 103 81 0 2005 10 2006 2007 2008 2009 2010 2011 2012 2013 2014 2015 2016 Data source: SPARCS Hospital Discharge Data (2005 -2016), data from New York City DOHMH Environment & Health Data Portal An ED visit is included if it has an ICD-9 principal diagnosis code of 493.

Asthma-related hospitalization rates among children up to 4 years old have declined in all 5 NYC boroughs; and remain highest in the Bronx Rate of asthma-related hospitalizations among NYC resident children up to 4 years old per 10, 000 Bronx Brooklyn Manhattan Queens Staten Island 212 200 150 123 120 100 95 92 56 51 50 41 39 50 0 2003 11 2004 2005 2006 2007 2008 2009 2010 2011 2012 2013 2014 2015 2016 Data source: SPARCS Hospital Discharge Data (2003 -2016), data from New York City DOHMH Environment & Health Data Portal A hospitalization is included if it has an ICD-9 principal diagnosis code of 493.
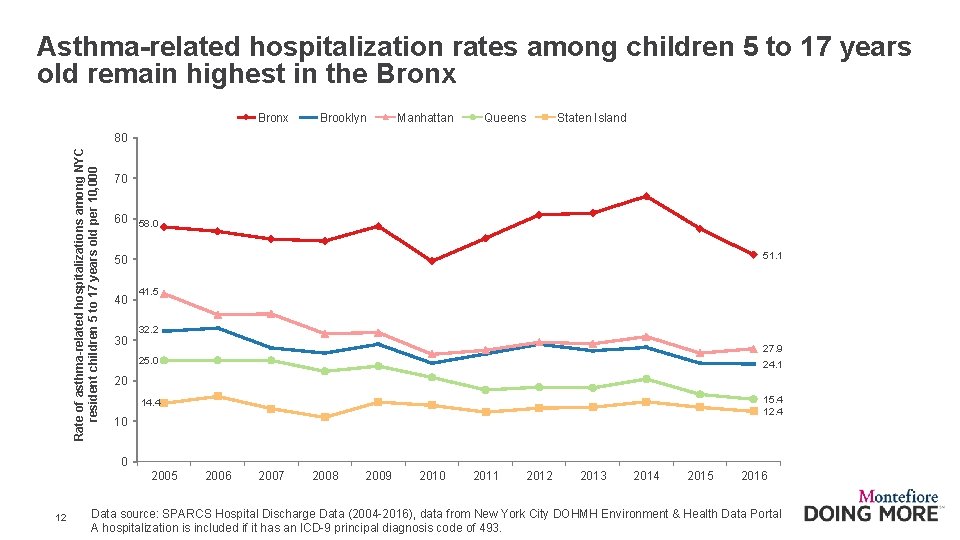
Asthma-related hospitalization rates among children 5 to 17 years old remain highest in the Bronx Brooklyn Manhattan Queens Staten Island Rate of asthma-related hospitalizations among NYC resident children 5 to 17 years old per 10, 000 80 70 60 58. 0 51. 1 50 40 30 41. 5 32. 2 27. 9 25. 0 24. 1 14. 4 15. 4 12. 4 20 10 0 2005 12 2006 2007 2008 2009 2010 2011 2012 2013 2014 2015 2016 Data source: SPARCS Hospital Discharge Data (2004 -2016), data from New York City DOHMH Environment & Health Data Portal A hospitalization is included if it has an ICD-9 principal diagnosis code of 493.
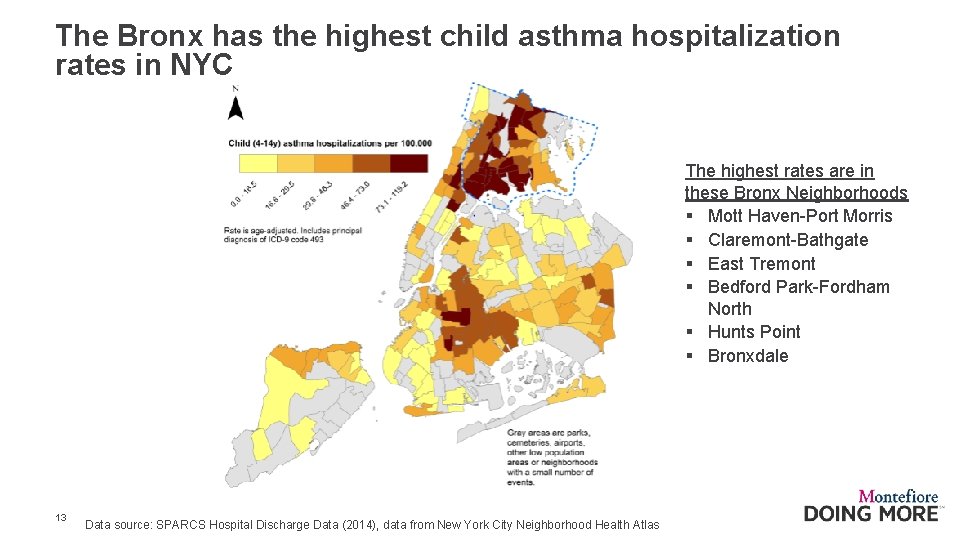
The Bronx has the highest child asthma hospitalization rates in NYC The highest rates are in these Bronx Neighborhoods § Mott Haven-Port Morris § Claremont-Bathgate § East Tremont § Bedford Park-Fordham North § Hunts Point § Bronxdale 13 Data source: SPARCS Hospital Discharge Data (2014), data from New York City Neighborhood Health Atlas
Adult asthma Lifetime prevalence | Current asthma | Asthma ED visits | Asthma hospitalizations 14
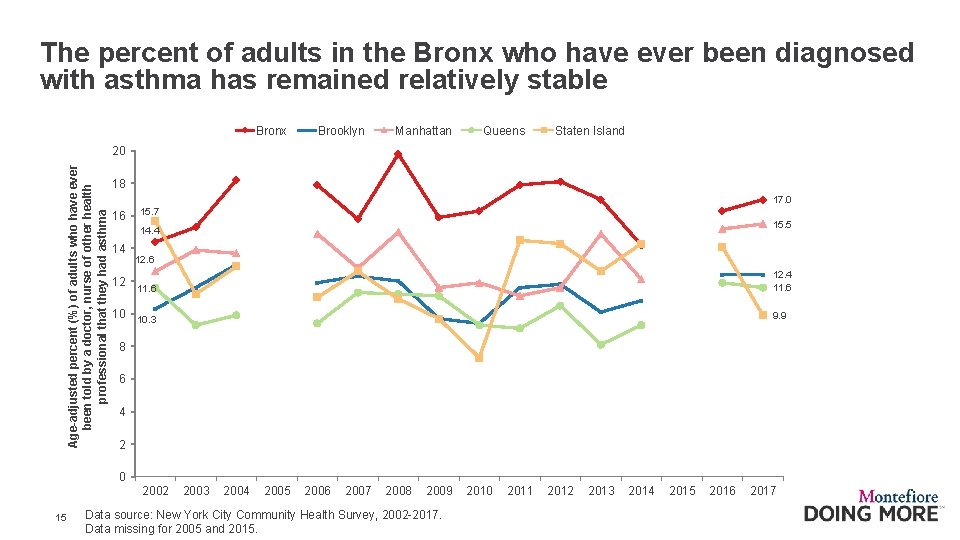
The percent of adults in the Bronx who have ever been diagnosed with asthma has remained relatively stable Bronx Brooklyn Manhattan Queens Staten Island Age-adjusted percent (%) of adults who have ever been told by a doctor, nurse of other health professional that they had asthma 20 18 17. 0 16 15. 7 15. 5 14. 4 14 12 12. 6 12. 4 11. 6 10 10. 3 9. 9 8 6 4 2 0 2002 15 2003 2004 2005 2006 2007 2008 2009 Data source: New York City Community Health Survey, 2002 -2017. Data missing for 2005 and 2015. 2010 2011 2012 2013 2014 2015 2016 2017
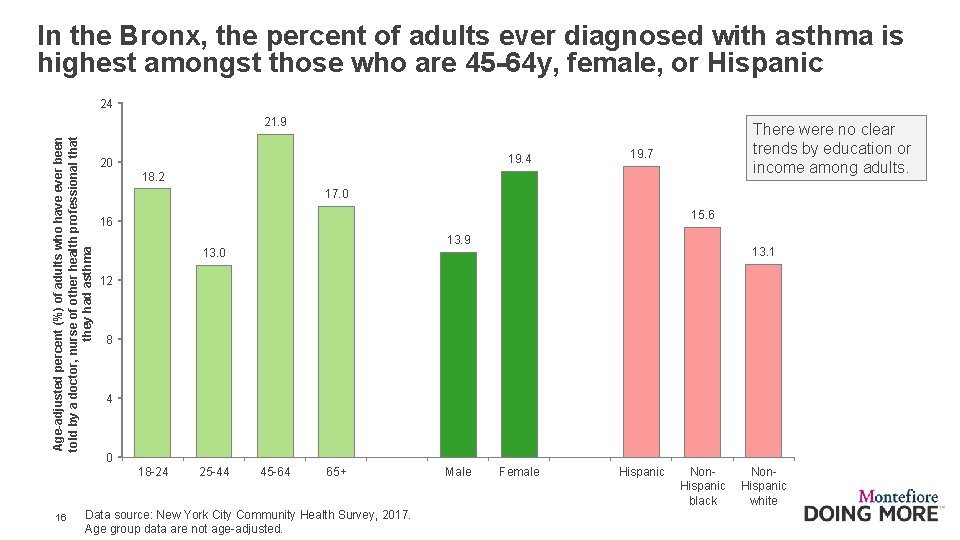
In the Bronx, the percent of adults ever diagnosed with asthma is highest amongst those who are 45 -64 y, female, or Hispanic 24 Age-adjusted percent (%) of adults who have ever been told by a doctor, nurse of other health professional that they had asthma 21. 9 19. 4 20 19. 7 18. 2 17. 0 15. 6 16 13. 9 13. 0 13. 1 12 8 4 0 18 -24 16 There were no clear trends by education or income among adults. 25 -44 45 -64 65+ Data source: New York City Community Health Survey, 2017. Age group data are not age-adjusted. Male Female Hispanic Non. Hispanic black Non. Hispanic white
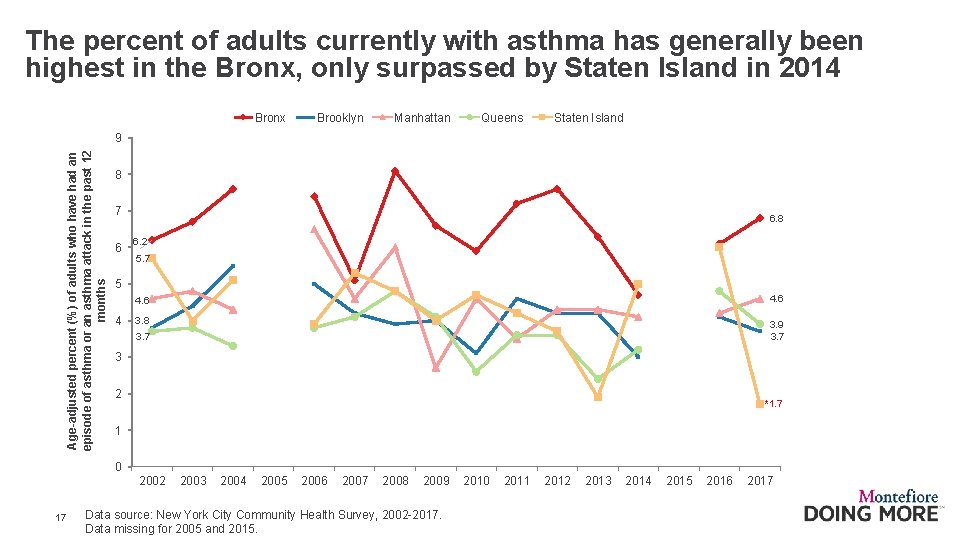
The percent of adults currently with asthma has generally been highest in the Bronx, only surpassed by Staten Island in 2014 Bronx Brooklyn Manhattan Queens Staten Island Age-adjusted percent (%) of adults who have had an episode of asthma or an asthma attack in the past 12 months 9 8 7 6 6. 8 6. 2 5. 7 5 4 4. 6 3. 8 3. 9 3. 7 3 2 *1. 7 1 0 2002 17 2003 2004 2005 2006 2007 2008 2009 Data source: New York City Community Health Survey, 2002 -2017. Data missing for 2005 and 2015. 2010 2011 2012 2013 2014 2015 2016 2017
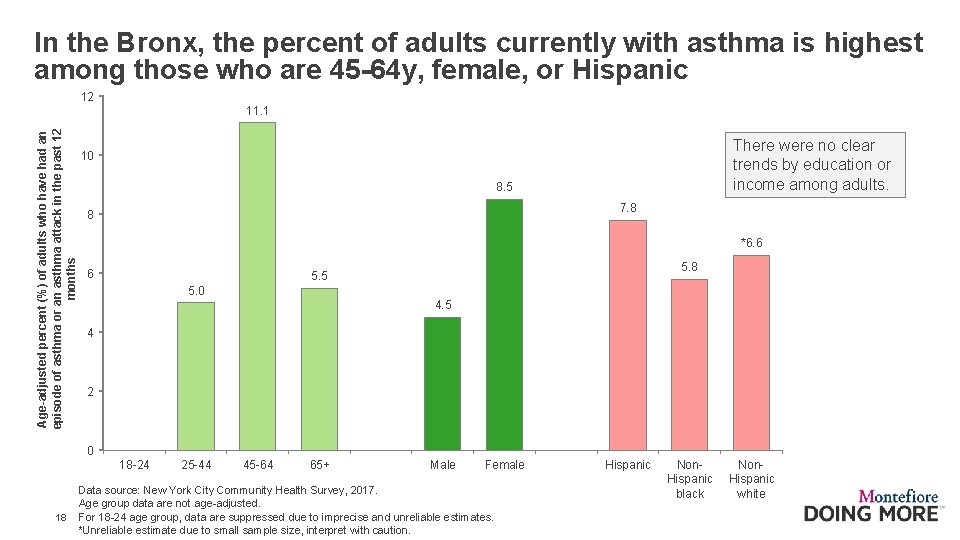
In the Bronx, the percent of adults currently with asthma is highest among those who are 45 -64 y, female, or Hispanic 12 Age-adjusted percent (%) of adults who have had an episode of asthma or an asthma attack in the past 12 months 11. 1 There were no clear trends by education or income among adults. 10 8. 5 7. 8 8 *6. 6 6 5. 8 5. 5 5. 0 4. 5 4 2 0 18 -24 18 25 -44 45 -64 65+ Male Female Data source: New York City Community Health Survey, 2017. Age group data are not age-adjusted. For 18 -24 age group, data are suppressed due to imprecise and unreliable estimates. *Unreliable estimate due to small sample size, interpret with caution. Hispanic Non. Hispanic black Non. Hispanic white
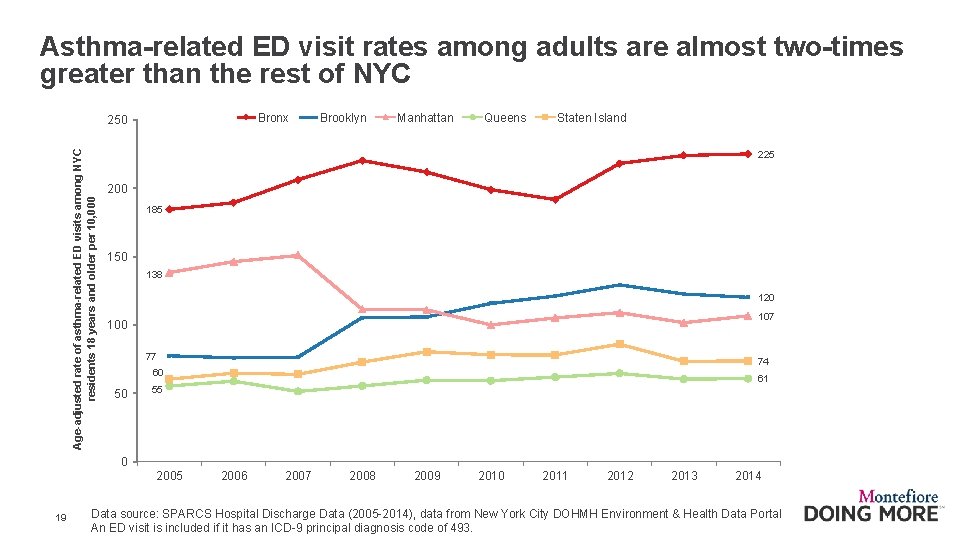
Asthma-related ED visit rates among adults are almost two-times greater than the rest of NYC Bronx Age-adjusted rate of asthma-related ED visits among NYC residents 18 years and older per 10, 000 250 Brooklyn Manhattan Queens Staten Island 225 200 185 150 138 120 107 100 77 74 60 50 61 55 0 2005 19 2006 2007 2008 2009 2010 2011 2012 2013 2014 Data source: SPARCS Hospital Discharge Data (2005 -2014), data from New York City DOHMH Environment & Health Data Portal An ED visit is included if it has an ICD-9 principal diagnosis code of 493.
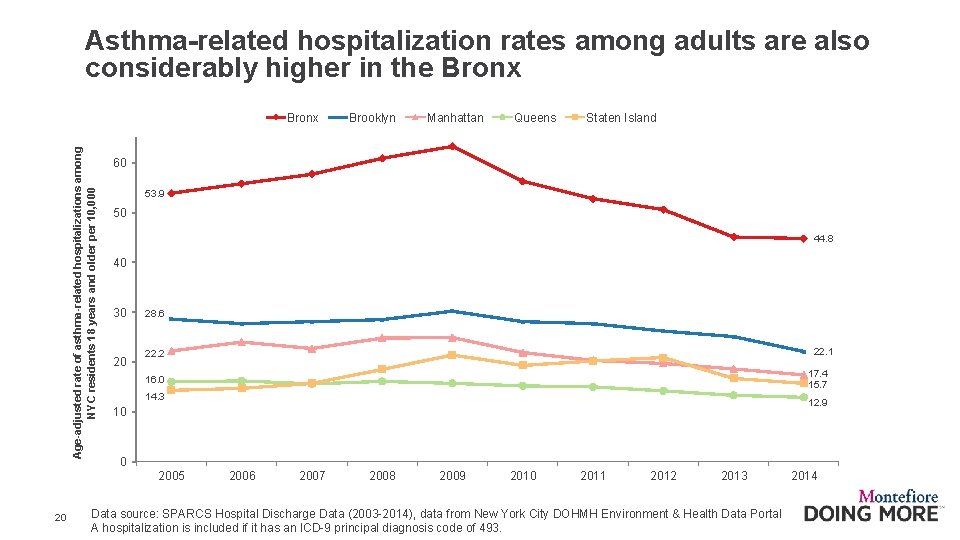
Asthma-related hospitalization rates among adults are also considerably higher in the Bronx Age-adjusted rate of asthma-related hospitalizations among NYC residents 18 years and older per 10, 000 Bronx Manhattan Queens Staten Island 60 53. 9 50 44. 8 40 30 20 28. 6 22. 1 22. 2 17. 4 15. 7 16. 0 14. 3 12. 9 10 0 2005 20 Brooklyn 2006 2007 2008 2009 2010 2011 2012 2013 Data source: SPARCS Hospital Discharge Data (2003 -2014), data from New York City DOHMH Environment & Health Data Portal A hospitalization is included if it has an ICD-9 principal diagnosis code of 493. 2014
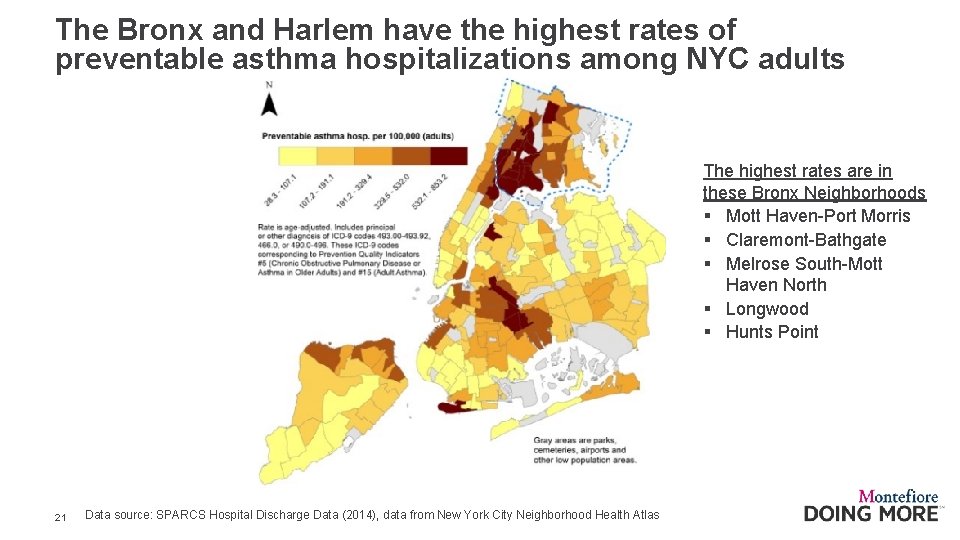
The Bronx and Harlem have the highest rates of preventable asthma hospitalizations among NYC adults The highest rates are in these Bronx Neighborhoods § Mott Haven-Port Morris § Claremont-Bathgate § Melrose South-Mott Haven North § Longwood § Hunts Point 21 Data source: SPARCS Hospital Discharge Data (2014), data from New York City Neighborhood Health Atlas
Risk factors Obesity | Housing quality | Smoking | Air quality 22
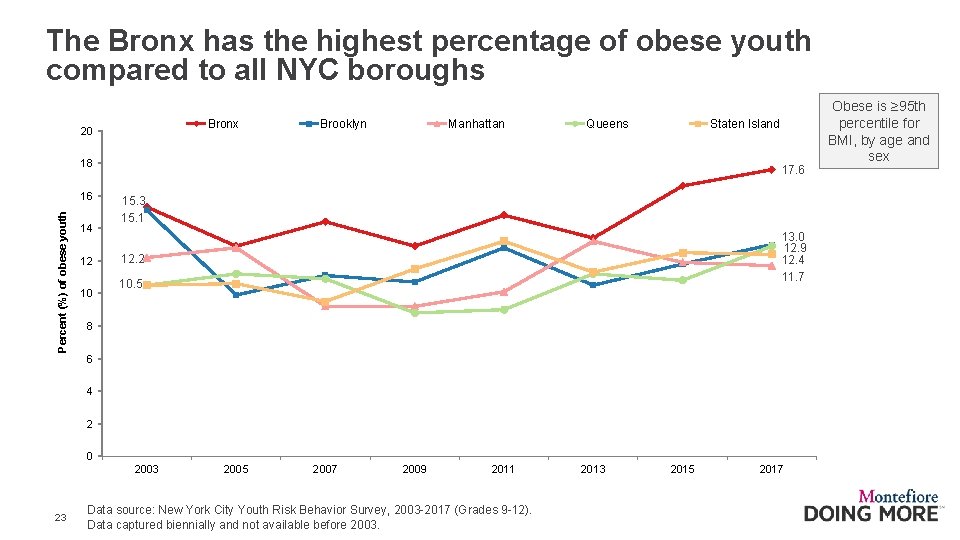
The Bronx has the highest percentage of obese youth compared to all NYC boroughs Bronx 20 Brooklyn Manhattan Queens Staten Island 18 Percent (%) of obese youth 16 14 12 10 17. 6 15. 3 15. 1 13. 0 12. 9 12. 4 11. 7 12. 2 10. 5 8 6 4 2 0 2003 23 2005 2007 2009 2011 Data source: New York City Youth Risk Behavior Survey, 2003 -2017 (Grades 9 -12). Data captured biennially and not available before 2003. 2013 2015 2017 Obese is ≥ 95 th percentile for BMI, by age and sex
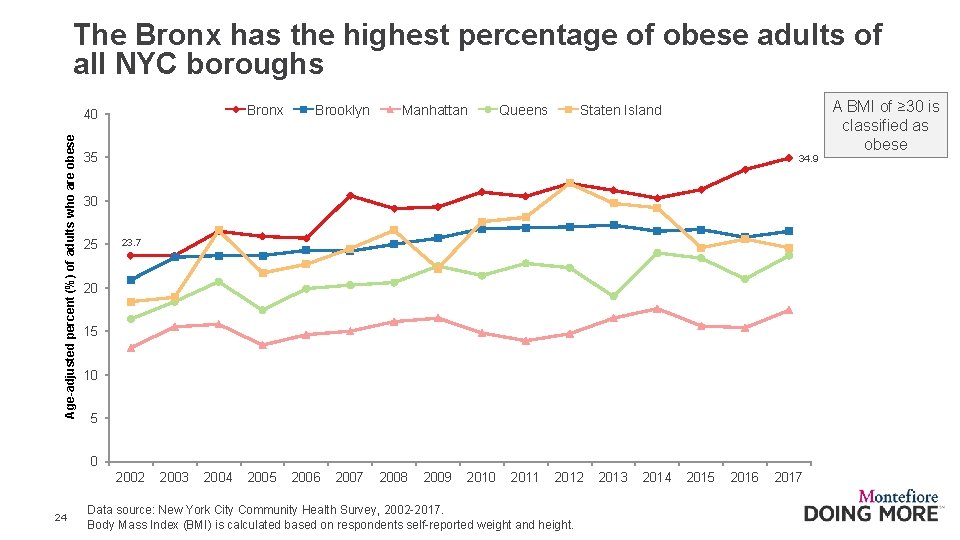
The Bronx has the highest percentage of obese adults of all NYC boroughs Bronx Age-adjusted percent (%) of adults who are obese 40 Brooklyn Manhattan Queens Staten Island 35 34. 9 30 25 23. 7 20 15 10 5 0 2002 24 2003 2004 2005 2006 2007 2008 2009 2010 2011 2012 Data source: New York City Community Health Survey, 2002 -2017. Body Mass Index (BMI) is calculated based on respondents self-reported weight and height. 2013 2014 2015 2016 2017 A BMI of ≥ 30 is classified as obese
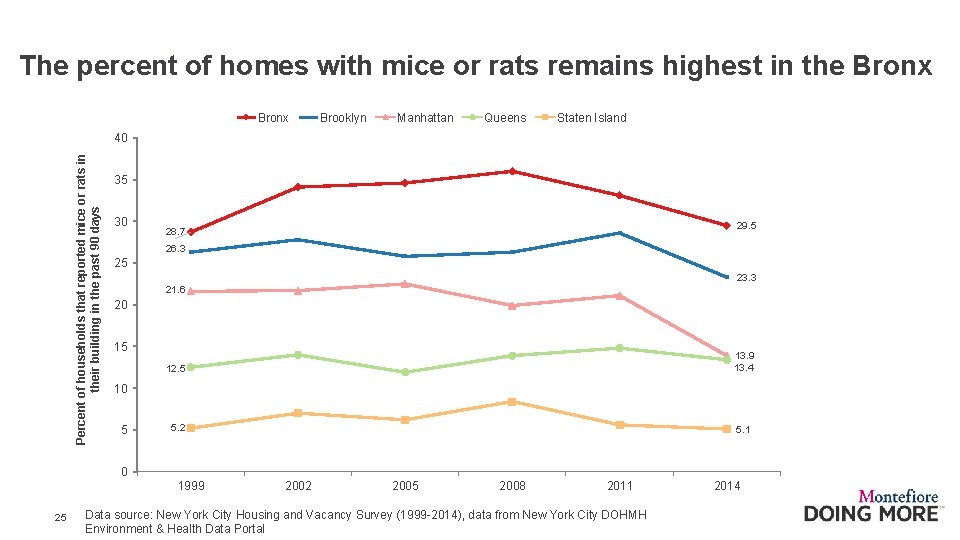
The percent of homes with mice or rats remains highest in the Bronx Brooklyn Manhattan Queens Staten Island Percent of households that reported mice or rats in their building in the past 90 days 40 35 30 29. 5 28. 7 26. 3 25 23. 3 21. 6 20 15 12. 5 13. 9 13. 4 5. 2 5. 1 10 5 0 1999 25 2002 2005 2008 2011 Data source: New York City Housing and Vacancy Survey (1999 -2014), data from New York City DOHMH Environment & Health Data Portal 2014
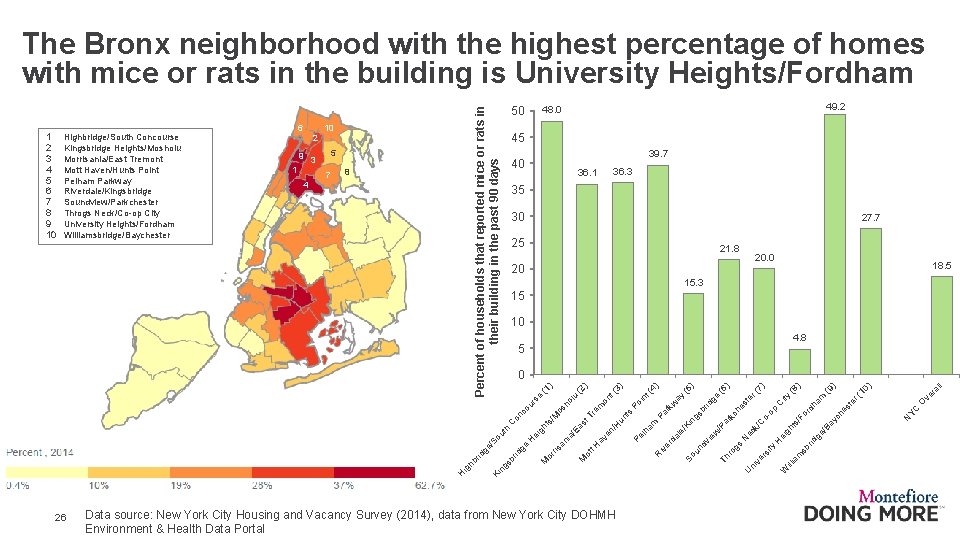
The Bronx neighborhood with the highest percentage of homes with mice or rats in the building is University Heights/Fordham 39. 7 40 35 30 27. 7 25 21. 8 20. 0 20 18. 5 15. 3 15 10 4. 8 5 YC N ch O er ve (1 ra ll 0) ) sb am illi W ay /B rid ge gh ei H ity rs ve ni U es t dh am or /F ts C k/ ec N ro gs (9 (8 ) ity C o- ch ar k /P ew Th vi un d So op es id br gs in /K da le er iv R te ge ay w Pa rk lh am s Pe un t /H t. H ot M r( 7) ) (5 t( 4) Po in on em av en ia /E an ris or M t( 3) (2 ) as t ts ei gh H ge id Tr os /M on c C th ou br gs Ki n Data source: New York City Housing and Vacancy Survey (2014), data from New York City DOHMH Environment & Health Data Portal (6 ) 0 /S rid ge hb ig H 26 36. 3 36. 1 ho lu 4 77 8 102 45 ) 99 3 1033 5 (1 1 10 22 e 6 49. 2 48. 0 ou rs Highbridge/South Concourse Kingsbridge Heights/Mosholu Morrisania/East Tremont Mott Haven/Hunts Point Pelham Parkway Riverdale/Kingsbridge Soundview/Parkchester Throgs Neck/Co-op City University Heights/Fordham Williamsbridge/Baychester Percent of households that reported mice or rats in their building in the past 90 days 1 2 3 4 5 6 7 8 9 10 50
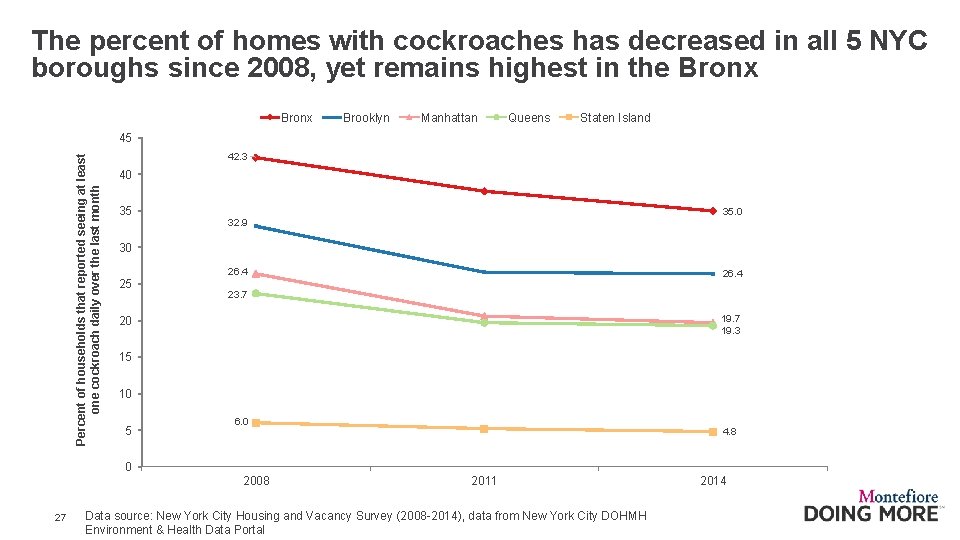
The percent of homes with cockroaches has decreased in all 5 NYC boroughs since 2008, yet remains highest in the Bronx Brooklyn Manhattan Queens Staten Island Percent of households that reported seeing at least one cockroach daily over the last month 45 42. 3 40 35 35. 0 32. 9 30 26. 4 25 26. 4 23. 7 19. 3 20 15 10 5 6. 0 4. 8 0 2008 27 2011 Data source: New York City Housing and Vacancy Survey (2008 -2014), data from New York City DOHMH Environment & Health Data Portal 2014
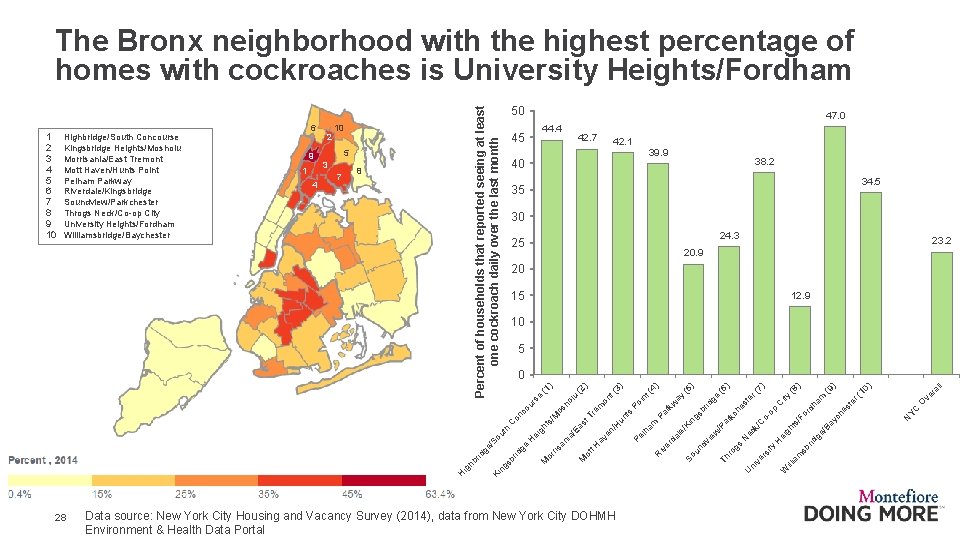
The Bronx neighborhood with the highest percentage of homes with cockroaches is University Heights/Fordham 34. 5 30 24. 3 25 23. 2 20. 9 20 15 12. 9 10 5 YC N ch O er ve (1 ra ll 0) ) sb am illi W ay /B rid ge gh ei H ity rs ve ni U es t dh am or /F ts C k/ ec N ro gs (9 (8 ) ity C o- ch ar k /P ew Th vi un d So op es id br gs in /K da le er iv R te ge ay w Pa rk lh am s Pe un t r( 7) ) (5 t( 4) Po in on em av en ia /E an ris or M /H ts ei gh H ge id t( 3) (2 ) os /M on c C th ou br gs Ki n Data source: New York City Housing and Vacancy Survey (2014), data from New York City DOHMH Environment & Health Data Portal (6 ) 0 /S rid ge hb ig H 28 38. 2 35 Tr 7 as t 4 t. H 103 8 39. 9 40 ot 1 42. 1 M 1033 3 42. 7 ho lu 101 9 ) 5 44. 4 45 (1 22 47. 0 e 101 10 ou rs Highbridge/South Concourse Kingsbridge Heights/Mosholu Morrisania/East Tremont Mott Haven/Hunts Point Pelham Parkway Riverdale/Kingsbridge Soundview/Parkchester Throgs Neck/Co-op City University Heights/Fordham Williamsbridge/Baychester Percent of households that reported seeing at least one cockroach daily over the last month 1 2 3 4 5 6 7 8 9 10 6 50
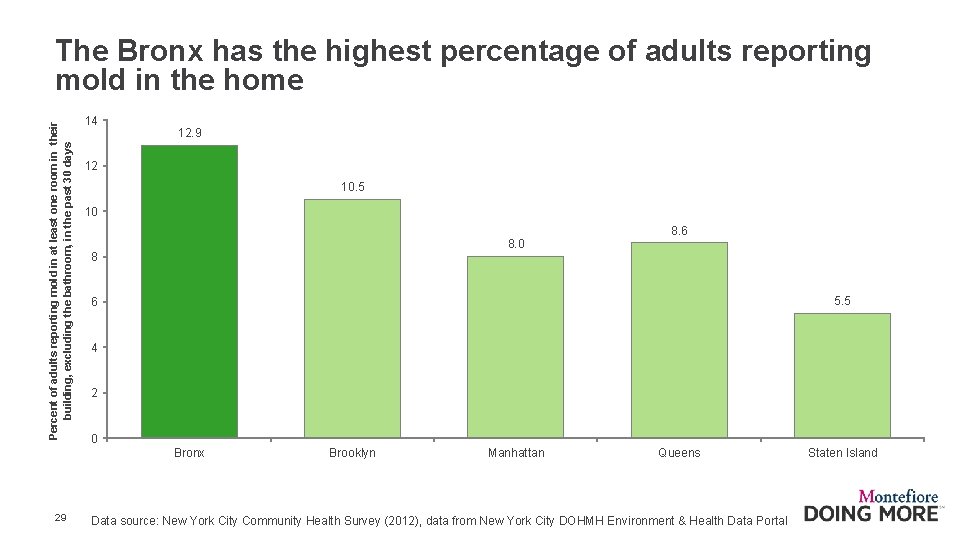
Percent of adults reporting mold in at least one room in their building, excluding the bathroom, in the past 30 days The Bronx has the highest percentage of adults reporting mold in the home 14 12. 9 12 10. 5 10 8. 6 8. 0 8 5. 5 6 4 2 0 Bronx 29 Brooklyn Manhattan Queens Data source: New York City Community Health Survey (2012), data from New York City DOHMH Environment & Health Data Portal Staten Island
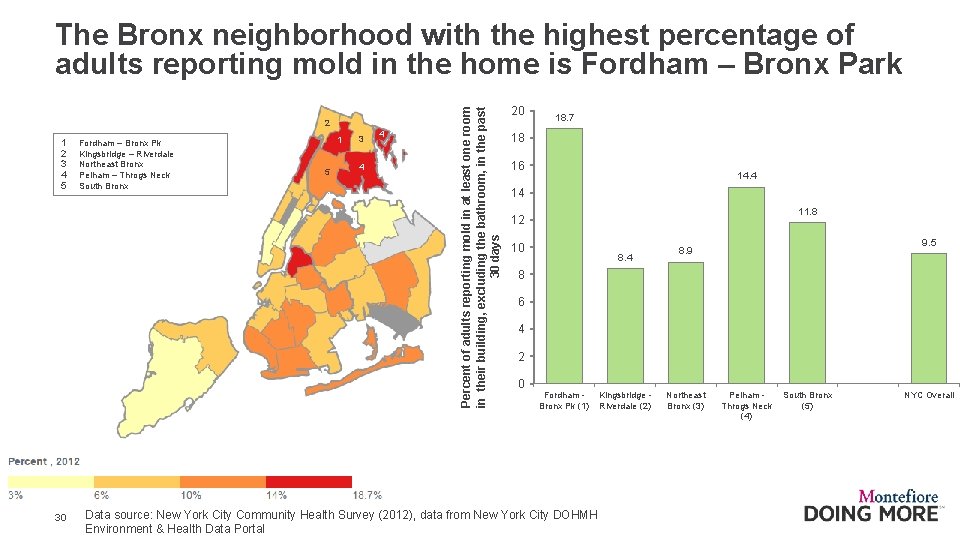
2 1 2 3 4 5 Fordham – Bronx Pk Kingsbridge – Riverdale Northeast Bronx Pelham – Throgs Neck South Bronx 3 1 102 9 4 5 7 103 102 4 1 104 1 30 4 Percent of adults reporting mold in at least one room in their building, excluding the bathroom, in the past 30 days The Bronx neighborhood with the highest percentage of adults reporting mold in the home is Fordham – Bronx Park 20 18. 7 18 16 14. 4 14 11. 8 12 10 8. 4 9. 5 8. 9 8 6 4 2 0 Fordham Bronx Pk (1) Data source: New York City Community Health Survey (2012), data from New York City DOHMH Environment & Health Data Portal Kingsbridge Riverdale (2) Northeast Bronx (3) Pelham Throgs Neck (4) South Bronx (5) NYC Overall
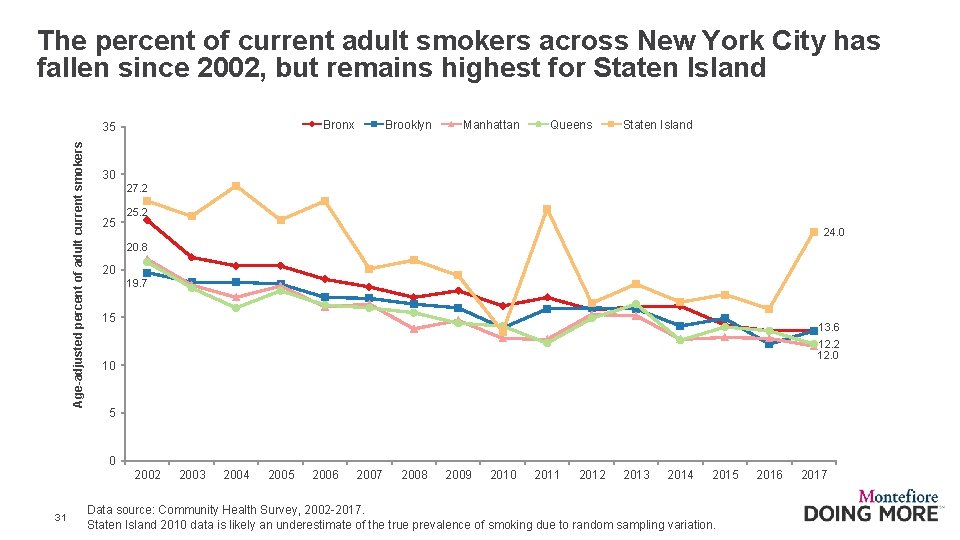
The percent of current adult smokers across New York City has fallen since 2002, but remains highest for Staten Island Bronx Age-adjusted percent of adult current smokers 35 Brooklyn Manhattan Queens Staten Island 30 27. 2 25 25. 2 24. 0 20. 8 20 19. 7 15 13. 6 12. 2 12. 0 10 5 0 2002 31 2003 2004 2005 2006 2007 2008 2009 2010 2011 2012 2013 2014 2015 Data source: Community Health Survey, 2002 -2017. Staten Island 2010 data is likely an underestimate of the true prevalence of smoking due to random sampling variation. 2016 2017
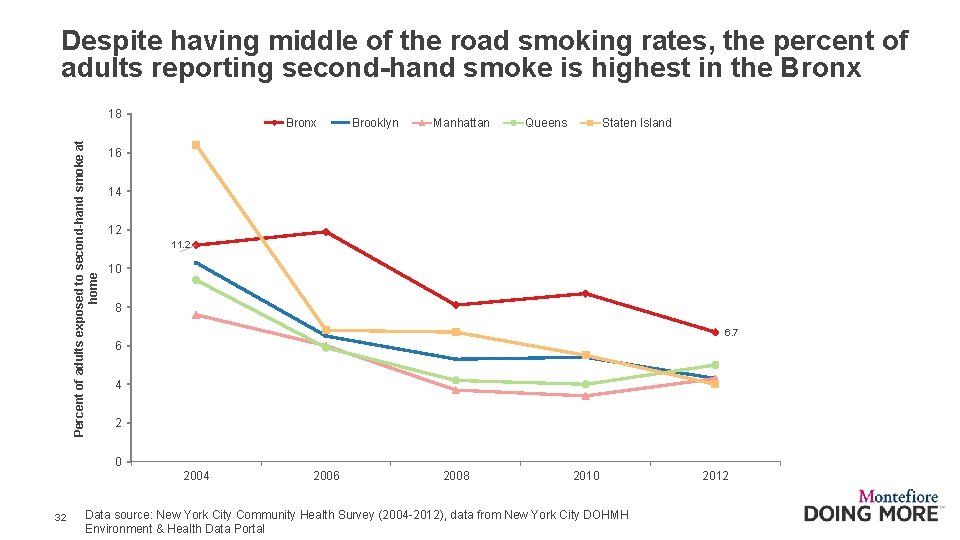
Despite having middle of the road smoking rates, the percent of adults reporting second-hand smoke is highest in the Bronx Percent of adults exposed to second-hand smoke at home 18 Bronx Brooklyn Manhattan Queens Staten Island 16 14 12 11. 2 10 8 6. 7 6 4 2 0 2004 32 2006 2008 2010 Data source: New York City Community Health Survey (2004 -2012), data from New York City DOHMH Environment & Health Data Portal 2012
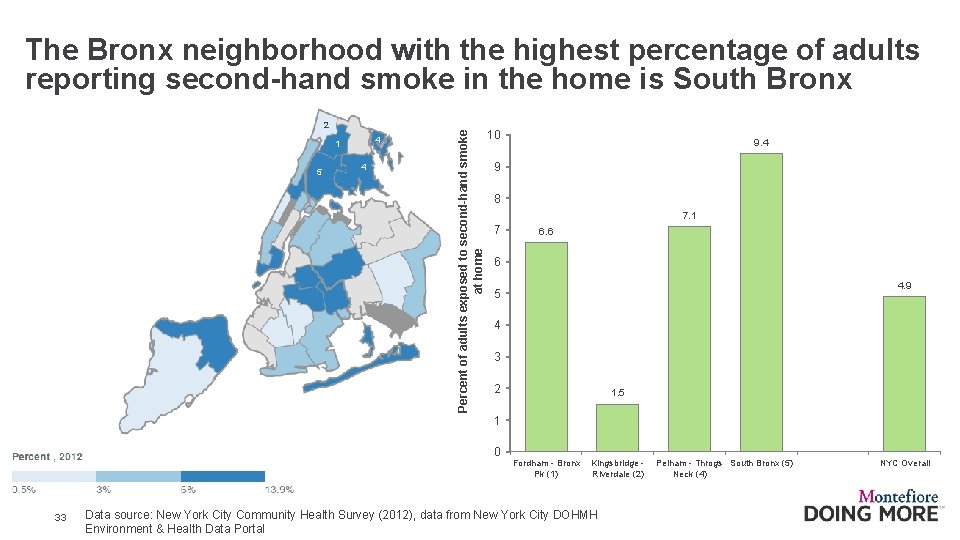
22 4 4 11 9 102 44 55 7 103 102 4 1 104 1 Percent of adults exposed to second-hand smoke at home The Bronx neighborhood with the highest percentage of adults reporting second-hand smoke in the home is South Bronx 10 9. 4 9 8 7. 1 7 6. 6 6 4. 9 5 4 3 2 1. 5 1 0 33 Fordham - Bronx Pk (1) Kingsbridge Riverdale (2) Data source: New York City Community Health Survey (2012), data from New York City DOHMH Environment & Health Data Portal Pelham - Throgs South Bronx (5) Neck (4) NYC Overall
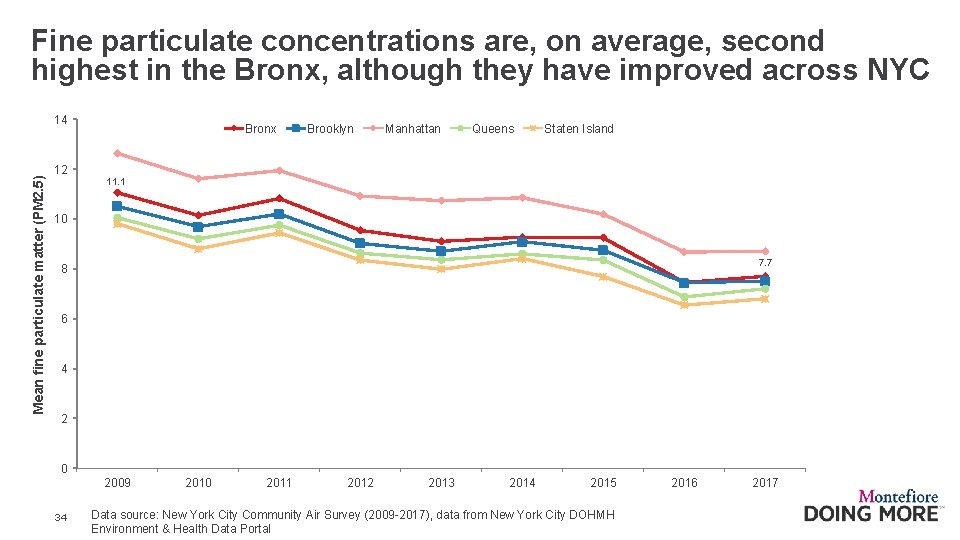
Fine particulate concentrations are, on average, second highest in the Bronx, although they have improved across NYC Mean fine particulate matter (PM 2. 5) 14 12 Bronx Brooklyn Manhattan Queens Staten Island 11. 1 10 7. 7 8 6 4 2 0 2009 34 2010 2011 2012 2013 2014 2015 Data source: New York City Community Air Survey (2009 -2017), data from New York City DOHMH Environment & Health Data Portal 2016 2017
Potential risk factors for which there is evidence of an association with asthma, but no data available for the Bronx § Pets (exposure to pet dander exacerbates asthma) § Pollen (exposure to pollen exacerbates asthma) 35
About the Community Health Dashboard Project § The goal of the project is to provide Bronx-specific data on risk factors and health outcomes with an emphasis on presenting data on trends, socio-demographic differences (e. g. , by age, sex, race/ethnicity, etc. ) and sub-county/neighborhood level data § Data will be periodically updated as new data becomes available. § Produced by Montefiore’s Office of Community & Population Health using publicly-available data sources § For more information, please contact us at OCPHDept@montefiore. org 36
Links to data sources § Global Burden of Disease Project: https: //vizhub. healthdata. org/gbd-compare/ § New York City Child Health, Emotional Wellness and Development Survey: https: //a 816 healthpsi. nyc. gov/epiquery/Child/CCHSIndex. html § New York City Community Health Survey: https: //a 816 -healthpsi. nyc. gov/epiquery/CHSXIndex. html § New York City Youth Risk Behavior Survey: https: //a 816 -healthpsi. nyc. gov/epiquery/YRBS/yrbs. Index. html § New York City Environment & Health Data Portal: http: //a 816 dohbesp. nyc. gov/Indicator. Public/publictracking. aspx § New York City Neighborhood Health Atlas: https: //public. tableau. com/profile/nyc. health#!/vizhome/New. York. City. Neighborhood. Health. Atlas/Home 37
- Slides: 37