BRIDGING THE GAP BETWEEN SEVERE WEATHER WATCHES AND

BRIDGING THE GAP BETWEEN SEVERE WEATHER WATCHES AND WARNINGS Steven J. Weiss steven. j. weiss@noaa. gov MDL User Group Meeting on Severe Weather Technology for NWS Warning Decision Making July 11 -14, 2005 Silver Spring, MD Where Americas Climate and Weather Services Begin

Outline • Severe Thunderstorm Forecasting – Role of the environment in assessment of storm potential – Sampling and resolution issues • Use of models to supplement observational data • Eta and RUC Errors (especially PBL and instability) – Sensitivity of convection to environment details • Observed storms and convective mode • Modeled storms – WRF, cloud models, and high resolution ensembles – Verification of high resolution models – Summary of analysis and prediction limitations • Some requirements that may result in improved short-term forecasting of severe thunderstorms

Synergy Between Severe Weather Forecasting and Warning • Correct anticipation of what to expect: – Reduces “surprise” events – Allows timely implementation of office severe weather plans • Enhanced Staffing Levels and Delegation of Duties • Collaboration with EMs / Media / Spotter Deployment, etc. – Leads to more confidence when issuing warnings • Use of appropriate radar interrogation strategies • Fosters increased lead time • Summary: accurate forecasts can result in better warnings and improved public service
 of existing severe")
Some Differences Between Severe Weather Forecasting and Warning • Detection (warning) of existing severe weather is not the same as prediction (forecasting) of future occurrence or evolution – Warnings have improved because of advances in: • • Technology (NEXRAD & AWIPS / WDSSII) Science (Understanding of storm structure/processes) Forecaster training and education Delivery systems to the public – But analogous technological advancement for severe weather prediction has not yet occurred • Considerable uncertainty can exist in both the prediction and detection phases

Modified Forecast Funnel • SPC focuses on relationship between synoptic - mesoscale environment and subsequent thunderstorm development and evolution • Must maintain awareness of mesoscale - synoptic scale interactions • Severe weather events occur on scales smaller than standard observational data (and typical model data) • The real atmosphere is more important than a model atmosphere

Severe Thunderstorm Forecasting • Assessment of convective potential is often limited by insufficient sampling on the mesoscale in time and space (especially 3 D water vapor) – Radiosondes • High vertical resolution, poor time and space resolution – Surface METARS • High horizontal and time resolution, no vertical information – Wind profilers and VAD winds • High vertical and time resolution, moderate horizontal res. • No thermodynamic data – Satellite retrievals (winds and thermodynamic) • Mod. /high horizontal and time resolution, poor vertical res. – GPS Integrated Water Vapor • High time res. , mod. /high horizontal res. , poor vertical res.

The Link Between Observable Scales and Stormscale is not Necessarily Clear Observable scales Stormscale
 knowledge of")
Severe Weather Forecasting • Key premise - We must use our (incomplete) knowledge of the environment and convective processes to determine the spectrum of storms that are possible, where & when they may occur, and how they may evolve over time

Severe Thunderstorm Forecasting • We utilize NWP model output to supplement the limited sampling of real atmosphere (e. g. , Eta and RUC output) • Model output forms the foundation for most SPC outlooks, and it also impacts watch decisions – But accounting for uncertainties in IC’s (inadequate sampling) and model physics errors is not easy – Example: Eta forecast soundings exhibit characteristic errors caused by: • Early / late activation of deep convection • Shallow convective scheme in BMJ

Impact of Eta Model Deep Convection on Forecasts of CAPE Eta 24 hr forecast valid 12 z 8 Nov 2000 3 hr Conv Pcpn CAPE

Impact of Eta Model Deep Convection on Forecasts of CAPE Verifying Data 12 z 8 Nov 2000 Radar Reflectivity CAPE

Impact of Eta Model Deep Convection on Forecast Soundings 24 hr Eta Fcst Valid 12 z 8 Nov Observed LCH Sounding 12 z 8 Nov MUCAPE 929 J/kg MUCAPE 2634 J/kg Mean RH 75% Mean RH 28%
 and 12 hr Eta")
Impact of Eta BMJ Shallow Convection Observed Verifying Sounding (Red/Green) and 12 hr Eta Fcst (Purple)

Short-Term Severe Thunderstorm Environmental Parameter Guidance • Hourly Update Information on 3 D Convective Parameters is routinely available – LAPS in AWIPS – MSAS/RSAS in AWIPS – SPC Mesoscale Analysis Web Page • All utilize observational data blended with model data for atmosphere above the ground

Use of Objective Parameter Guidance • The availability of hourly 3 D guidance fields can improve our situational awareness prior to and during severe weather episodes • In many instances, it provides very useful diagnostic guidance for severe weather forecasting – It can help us “recover” from inaccurate mesoscale model guidance (outlook products) • But, it can also give us a false sense of security – We must be cautious in treating these hourly fields as if they are actual observational data – Short-term model input can and will have errors in key fields (e. g. , PBL structure)

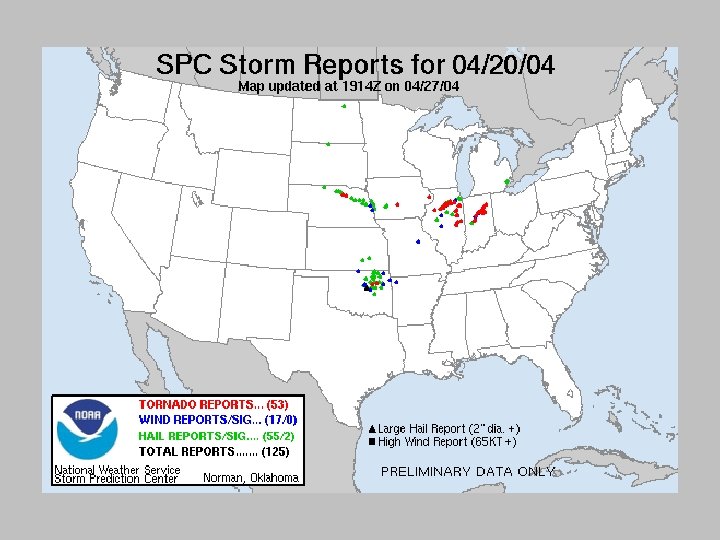
April 20, 2004 Challenges in Sfc Data Assim. and Fcstg PBL Evolution 34 Tornadoes Including One F 3 8 Deaths, 21 Inj. , $19 Million in Damage Jim Krancic

12 z Eta Model Guidance

12 hr Eta Model 500 mb Forecasts Valid 00 z 21 Apr 04 Height and Vorticity Height, Temperature, Wind

12 hr Eta Model 850 mb and Sfc Forecasts Valid 00 z 21 Apr 04 850 mb Height, Temperature, Wind MSLP Isobars, 2 m Dewpoint

12 hr Eta CAPE/Shear/SRH Forecasts Valid 00 z 21 Apr 04 MLCAPE/SHR 6/SRH 3 MUCAPE/SHR 6/SRH 3

12 hr Eta 3 h Accum. Pcpn/VV Forecast Valid 00 z 21 Apr 04

15 hr Eta 3 h Accum. Pcpn/VV Forecast Valid 03 z 21 Apr 04

18 hr Eta 3 h Accum. Pcpn/VV Forecast Valid 06 z 21 Apr 04
 Valid 18 z 20 Apr 04")
6 hr Eta PFC for Peoria, IL (PIA) Valid 18 z 20 Apr 04
 Valid 21 z 20 Apr 04")
9 hr Eta PFC for Peoria, IL (PIA) Valid 21 z 20 Apr 04
 Valid 00 z 21 Apr 04")
12 hr Eta PFC for Peoria, IL (PIA) Valid 00 z 21 Apr 04

12 z RUC Model Guidance

12 hr RUC Forecasts Valid 00 z 21 Apr 04 MSLP Isobars and 2 m Dewpoint CAPE/SHR 6/SRH 3

12 hr RUC 3 h Accum. Pcpn/VV Forecast Valid 00 z 21 Apr 04
 Valid 18 z 20 Apr 04")
6 hr RUC PFC for Peoria, IL (PIA) Valid 18 z 20 Apr 04
 Valid 21 z 20 Apr 04")
9 hr RUC PFC for Peoria, IL (PIA) Valid 21 z 20 Apr 04
 Valid 00 z 21 Apr 04")
12 hr RUC PFC for Peoria, IL (PIA) Valid 00 z 21 Apr 04

SPC Meso Analysis 21 z 100 mb MLCAPE and MUCAPE

21 z Radar and MLCAPE

21 z Radar and MUCAPE

CAPE Assessment • To diagnose differences between MLCAPE and MUCAPE, examination of hourly RUC soundings and surface data are required – SPC Meso Analysis combines hourly surface data with 1 -hr forecasts from the previous hour RUC that provide environment information above the ground • For example, the 21 z analysis incorporates 21 z METAR data with a 1 -hr forecast from the 20 z RUC
 Modified with Observed T/Td Valid 19")
1 hr RUC PFC for Peoria, IL (PIA) Modified with Observed T/Td Valid 19 z 20 Apr 04
 Modified with Observed T/Td Valid 20")
1 hr RUC PFC for Peoria, IL (PIA) Modified with Observed T/Td Valid 20 z 20 Apr 04
 Modified with Observed T/Td Valid 21")
1 hr RUC PFC for Peoria, IL (PIA) Modified with Observed T/Td Valid 21 z 20 Apr 04
 Modified with Observed T/Td Valid 22")
1 hr RUC PFC for Peoria, IL (PIA) Modified with Observed T/Td Valid 22 z 20 Apr 04

Meso Analysis Summary of CAPE • Looking at hourly RUC 1 -hr forecast soundings at PIA as warm front lifted north of PIA indicates – Observed surface dew points did not blend well with model PBL background field from 1 -hr forecast – Dry layer immediately above model ground during 20 -22 z period limited MLCAPE values to < 200 J/kg

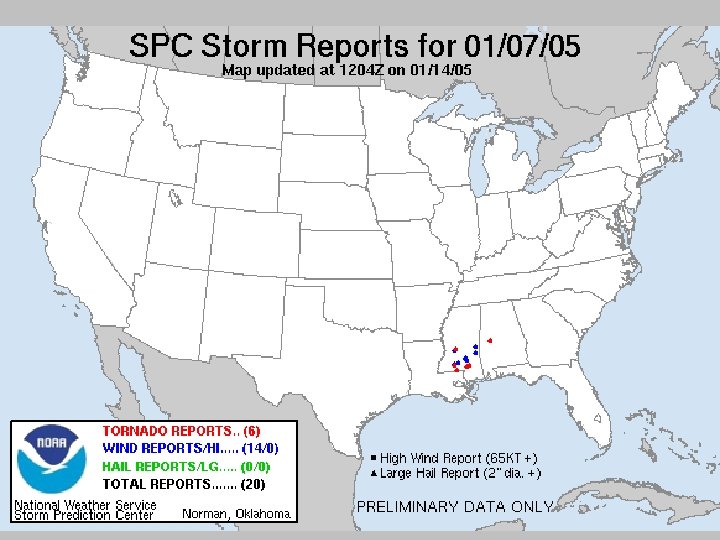
RUC Model Upgrade in 2004 • The RUC was upgraded in September 2004 – One change was designed to increase the vertical impact of observed surface T/Td data on model PBL profiles • The RUC PBL-based data assimilation should result in more accurate T/Td profiles in low levels – This should improve RUC hourly analyses – Better PBL profiles should result in improved short-term forecasts (including PFCs and 1 -hr forecasts that feed the Meso Analyses) • Let’s examine RUC soundings for a January 2005 case

SPC Meso Analysis 21 z MLCAPE and MUCAPE

21 z Radar and MLCAPE

21 z Radar and MUCAPE

RUC Soundings at Slidell 20 -00 z
 Modified with Observed T/Td Valid 20")
1 hr RUC PFC for Slidell (6 RO) Modified with Observed T/Td Valid 20 z 7 Jan 05
 Modified with Observed T/Td Valid 21")
1 hr RUC PFC for Slidell (6 RO) Modified with Observed T/Td Valid 21 z 7 Jan 05
 Modified with Observed T/Td Valid 22")
1 hr RUC PFC for Slidell (6 RO) Modified with Observed T/Td Valid 22 z 7 Jan 05
 Modified with Observed T/Td Valid 23")
1 hr RUC PFC for Slidell (6 RO) Modified with Observed T/Td Valid 23 z 7 Jan 05
 Modified with Observed T/Td Valid 00")
1 hr RUC PFC for Slidell (6 RO) Modified with Observed T/Td Valid 00 z 8 Jan 05

RUC 1 -hr PFC Assessment • Again, the RUC 1 -hr soundings exhibit dry low levels • For this case, we have a 00 z observed raob at Slidell for comparison purposes
 Raob 00 z 8 Jan 05")
Observed Slidell (LIX) Raob 00 z 8 Jan 05
 and RUC 1 -hr PFC with METAR Slidell Soundings Valid 00 z")
Observed (Red/Green) and RUC 1 -hr PFC with METAR Slidell Soundings Valid 00 z 8 Jan 05

Use of Objective Parameter Guidance • The availability of hourly 3 D guidance fields can improve our situational awareness prior to and during severe weather episodes • But, it can also give us a false sense of security – We must be cautious in treating these hourly fields and model soundings as if they are actual observational data – Short-term model input can and will have errors in key fields (e. g. , PBL structure) • Suggests considerable improvement in our real-time assessment of the environment (especially PBL structure) is needed.

How Sensitive is Convection to Environmental Conditions? • Significant severe weather events can occur over a wide range of CAPE – Shear parameter space • Predictability is increased within the middle of the parameter distributions • Uncertainty is largest when either CAPE or shear are on the margins of the distributions • For example, cool season environments characterized by low CAPE – high shear are problematic • Shear profiles are often “supportive” of tornadoes • How much CAPE is “enough”? From Johns et al. (1993)

Results from Updated Thompson et al. RUC Analysis Sample Most Sig Tor Events Occur with MLCAPE > 1000 J/kg and ESRH > 100 m 2 s 2 Sig Tor Non-Tor Supercell But many non-tornadic supercells also occur in that parameter space Similar environments produce different storm types Different environments produce similar storm types MLCAPE/Effective SRH Scatterplot

How Sensitive is Convection to Environmental Conditions? • Operational experience and proximity sounding studies suggest relationship of storm character to environment is highly variable Example - Numerous severe storms in Arkansas but only one produced a significant tornado

Very Similar Environments May Support Very Different Convective Modes 18 UTC BMX 16 Dec 2000 Tornadic supercell 18 UTC BMX 16 Feb 2001 Bow echo

Importance of Convective Mode • Basic law of severe weather forecasting: –Correct prediction of convective mode is of paramount importance –If you don’t get the mode right, the predominant type of severe weather that occurs may be different than you expected

Importance of Convective Mode • Corollary - even when the mode is the same, different events may occur in close proximity to each other • 22 June 2003 severe storms in Nebraska
")
2245 UTC Satellite and Analysis (from Guyer and Ewald)

0. 5 deg Reflectivity 2358 UTC Aurora Supercell Produced Record 7” Hailstone Deshler Supercell Produced F 2 Killer Tornado (from Guyer and Ewald)
 • Primary Objectives in")
NOAA Hazardous Weather Testbed (Can High Resolution Models Help? ) • Primary Objectives in 2004 and 2005 – Can non-hydrostatic high resolution WRF models provide unique and meaningful information about details of subsequent severe thunderstorms? – Can forecasters use the WRF output to supplement current operational data and produce improved severe weather forecasts?
 versions of the")
Spring Experiments 2004 and 2005 • Experimental near-stormscale (dx~2 -4 km) versions of the WRF examined (EMC, NCAR, OU/CAPS/PSC) – Explore impacts of grid resolution and parameterized convection versus explicit microphysics • Determine usefulness of high resolution WRF output to SPC severe storm forecasters – Can Hi Res WRF provide unique information on convective initiation, evolution, and mode, e. g. , supercells and bow echoes? • Provide feedback to model developers so they can improve models

Model Domains in 2005

Example of Good WRF Forecast 28 -29 May 2004
 12 km ETA (F 10) 1 h Tot Pcp")
1 h BREF (22 Z) 12 km ETA (F 10) 1 h Tot Pcp 4 km WRF-ARW(F 22) 4. 5 km WRF-NMM (F 22) 1 h Tot Pcp
 12 km ETA (F 11) 1 h Tot Pcp")
1 h BREF (23 Z) 12 km ETA (F 11) 1 h Tot Pcp 4 km WRF-ARW(F 23) 4. 5 km WRF-NMM (F 23) 1 h Tot Pcp
 12 km ETA (F 12) 1 h Tot Pcp")
1 h BREF (00 Z) 12 km ETA (F 12) 1 h Tot Pcp 4 km WRF-ARW(F 24) 4. 5 km WRF-NMM (F 24) 1 h Tot Pcp
 12 km ETA (F 13) 1 h Tot Pcp")
1 h BREF (01 Z) 12 km ETA (F 13) 1 h Tot Pcp 4 km WRF-ARW(F 25) 4. 5 km WRF-NMM (F 25) 1 h Tot Pcp
 12 km ETA (F 14) 1 h Tot Pcp")
1 h BREF (02 Z) 12 km ETA (F 14) 1 h Tot Pcp 4 km WRF-ARW(F 26) 4. 5 km WRF-NMM (F 26) 1 h Tot Pcp
 12 km ETA (F 15) 1 h Tot Pcp")
1 h BREF (03 Z) 12 km ETA (F 15) 1 h Tot Pcp 4 km WRF-ARW(F 27) 4. 5 km WRF-NMM (F 27) 1 h Tot Pcp

Example of WRF Forecasts of Simulated Reflectivity Generation of WRF supercells in Arkansas (But atmosphere did not agree) 29 April 2005

0100 UTC 29 April 2005: 25 hr model reflectivity, NEXRAD BREF ARW 4 NMM 4 ARW 2 BREF

0200 UTC 29 April 2005: 26 hr model reflectivity, NEXRAD BREF ARW 4 NMM 4 ARW 2 BREF

0300 UTC 29 April 2005: 27 hr model reflectivity, NEXRAD BREF ARW 4 NMM 4 ARW 2 BREF

0400 UTC 29 April 2005: 28 hr model reflectivity, NEXRAD BREF ARW 4 NMM 4 ARW 2 BREF

0500 UTC 29 April 2005: 29 hr model reflectivity, NEXRAD BREF ARW 4 NMM 4 ARW 2 BREF

0600 UTC 29 April 2005: 30 hr model reflectivity, NEXRAD BREF ARW 4 NMM 4 ARW 2 BREF

0600 UTC 29 April 2005: 30 hr ARW 2 Reflectivity Good news is the ARW 2 can create welldefined, realistic supercell structures An even bigger challenge is to consistently generate storms in the right place at the right time
 • An ensemble forecasting experiment")
Elmore et al. Ensemble Cloud Model Experiment (WAF 2002) • An ensemble forecasting experiment generated 702 separate cloud-scale model runs – 531 storms for which maximum vertical velocity exceeds 8 m s-1 for at least 6 min. • Input soundings derived from operational Eta • How much does simulated storm lifetime vary relative to sounding similarities or differences?
")
Operationally Distinguishable Sounding that Results in Similar Storm Lifetimes (Inferring Similar Evolution)

Operationally Indistinguishable Sounding that Results in Different Storm Lifetimes

What is Happening? Is it the Cloud Model? The Atmosphere? • If we assume the model realistically reflects atmospheric processes at arbitrarily small scales, then the atmosphere itself is the root of the sensitivity. – This would require great accuracy in resolving / predicting environmental conditions

What is Happening? Is It The Cloud Model? The Atmosphere? • It could be model forecast errors – Model physics may introduce parameterized, irreversible processes that depend on threshold trigger points. • Choices for microphysics, PBL, radiation, etc. – Selection of different thresholds or physics packages will move the sensitivity from one set of soundings to another • No direct way to know which explanation is correct – But evidence suggests model physics and our limited ability to accurately resolve and predict the atmosphere at smaller scales both play a role

Future Course of Operational NWP • There is considerable discussion about the best use of computer, communications bandwidth, and workstation display resources – Some have advocated development of single highest resolution deterministic model (historical approach) – Others favor coarser resolution ensembles to account for initial condition and model physics uncertainties – What about combining both concepts with high resolution ensemble systems? • Let’s look at some results from a 5 -member ARPS ensemble run with dx=3 km (from Levit et al. 2004)

28 March 2000 Damage Summary Image from COMET Case Study • Tornadoes: – Fort Worth – F 2, 2 Fatalities, 80 Injuries – Arlington/Grand Prairie – F 3 – Hail – 3. 50 Inch, 1 Fatality
 Ensemble Postage Stamp Display")
3 km ARPS Ensemble Results (from Levit et al. ) Ensemble Postage Stamp Display Probability of 50 d. BZ Reflectivity 90 min forecast 90 min Reflectivity Forecasts • • Ensemble members “similar” to each other (underdispersive? ) and radar Is this a “good” forecast? – Answer depends on your specific time/space requirements – Good from watch scale perspective – Not as good from county warning perspective (esp. Tarrant County!) • How should we verify Hi. Res models? Image from COMET Case Study Actual Radar

Verification of High Res Models • High resolution models also introduce new issues for verification of model forecasts – Gridded output (e. g. , temperature, winds) is at much higher resolution than standard observational data • Analysis of Record (AOR) issues – Traditional precipitation measures such as Equitable Threat Score may provide misleading information about model skill • Makes it difficult to determine if new models or upgrades are producing “better” forecasts – Subjective verification methods are needed to complement existing metrics and to guide development of new measures

OBSERVED FCST #1: smooth Forecast #1: smooth OBSERVED Courtesy: Mike Baldwin FCST #2: detailed
 Forecast")
Traditional “measures-oriented” approach to verifying these forecasts (Almost all favor the smooth forecast) Forecast #1 (smooth) Forecast #2 (detailed) Mean absolute error 0. 157 0. 159 RMS error 0. 254 0. 309 Bias 0. 98 Threat score 0. 214 0. 161 Equitable threat score 0. 170 0. 102 Verification Measure Courtesy: Mike Baldwin

Summary – Improving Thunderstorm Forecasting • There are many issues that suggest accurate prediction of convective details will be a slow, incremental process – We don’t understand small scale phenomena and processes as well as synoptic scale processes • As we go down in scale the science is less and less mature – We don’t sample the atmosphere in enough detail • Small differences in structure may impact storm evolution – It is hard enough to accurately predict a single storm and its evolution • Complexity increases (by orders of magnitude? ) once multiple storms develop and they begin to interact – Large uncertainty is inherent in convective prediction and we can’t ignore it --> probabilistic approaches

Summary – Improving Thunderstorm Forecasting • Improvements in short term convective forecasting will require (among other things): – Substantially improved 4 D sampling of the environment • Development and operational deployment of new technology • Focus on detailed water vapor distribution and PBL evolution – Improved representations of boundary layer, convection, radiation, etc. processes in high resolution models • Scientific understanding of smaller scale phenomena will not systematically improve until observing systems improve – Data assimilation systems appropriate for high resolution models that incorporate enhanced sampling of 4 D environment • Radar and other high resolution remote sensing datasets – Development of cloud resolving, rapid update, multi-analysis / multimodel ensemble prediction systems that include microphysical stochastic processes • Must not “wash out” high resolution observed data

Summary – Improving Thunderstorm Forecasting • Improvements in short term convective forecasting will require (among other things): – New objective metrics to properly evaluate high resolution model forecasts – More interaction between model developers and forecasters • Greater understanding by model and systems developers of how forecasters use models and what information they need – Collaboration with cognitive and computer scientists to help develop innovative displays that enhance information transfer to humans • More education and training of forecasters on new modeling systems (including strengths/weaknesses and “why”) – If forecasters do not play major roles in design and testing of new guidance/support systems, systems may become “black boxes” • Otherwise we increase the risk of ultimately removing humans from the forecasting and warning process

Improving Service from SPC to WFOs • As warning lead time increases, a domino effect flows upstream in the integrated watch-warning system – It will be necessary to issue SPC Watches with longer lead time • How to factor in increasing uncertainty in convective details? • How should watch lead time be defined? – Currently defined as period from issue to first report – is this appropriate for larger time/space watches? • What is optimal watch lead time from user perspective? – Do different users have different requirements? • Should watches eventually become “fluid” products where counties are added and deleted on a semi-continuous (~hourly) basis? – How much lead time should be strived for when deciding if additional counties should be added? • Do we assume the same science, observing system, and prediction challenges impact the watch and warning process? – Or does convective predictability change with time in the 0 -6 hr window (in other words, what is limit of thunderstorm predictability)?
- Slides: 100