BRIDGE HYDRAULICS Ramesh Pinjani Sr Prof BridgesIRICEN Pune

BRIDGE HYDRAULICS Ramesh Pinjani Sr Prof Bridges/IRICEN Pune

Lecture plan 1. Important definitions / Terminology 2. Methods of estimation of design dischargesub structure code provisions(Para 4. 3) 3. Working out Q 50 for catchment area < 25 sqkm – RDSO report RBF-16 4. Sample calculations on Q 50 estimation 5. Working out Q 50 for catchment area 25 sqkm – 2500 sqkm – Flood estimation report ( A joint work of CWC, RDSO, IMD, MOT)
 7.")
6. Sample calculations on Q 50 estimation SUH concept( catchment 25 -2500 sqkm) 7. Design of water ways – various provisions in sub structure code (Para-4. 5) 8. Depth of scour various provisions in sub structure code (Para-4. 6) 9. Sub structure code provisions on afflux, clearance, free board (Para 4. 7, 4. 8, 4. 9) 10. Method statement for finalisation of span arrangement & foundation depth.
 1. Design discharge Q: The")
Important definitions (para 2 0 f sub structure code) 1. Design discharge Q: The estimated discharge for the design of the bridge and its appurtenances. 2. Afflux(h) : The rise in water level upstream of bridge as a result of obstruction to the natural flow caused by the construction of the bridge & its approaches 3. Free board (F): The vertical distance between the water level corresponding to design discharge (Q) including afflux(h) and the formation level of its approach bank / top level of guide bank 4. Clearance ( C ) : The vertical distance between the water level corresponding to design discharge Q including afflux and the point on the bridge super structure where the clearance is required to be measured

5. Depth of Scour: The depth of eroded bed of river measured from the water level for the discharge considered 6. Highest flood level (HFL): Highest water level known to have occurred 7. Low Water level(LWL) : water level generally obtained during dry weather 8. Important bridge: Those having a) Linear water way >= 300 m OR b) Total water way >= 1000 sqm OR c) Classified as important by CE/CBE depending upon consideration such as depth of water way, extent of river training works & maintenance problems
 Total water way >= 18 m OR b)")
9. Major Bridge: Those having a) Total water way >= 18 m OR b) Clear opening of 12 m or more in any one span 10. Protection works: Works to protect the bridge and its approaches from damage of flood water 11. Training works: The works designed to guide and confine the flow of river

Relevance of Design discharge • It is required for proper and economical design, construction and maintenance of Ø Bridge water way Ø Foundations Ø Protection works • Fixing / deciding Other parameters v. Afflux v. Free board & v. Vertical clearances
 (Para 4. 2 S. S. C) Para 4. 2.")
Estimation of Design discharge (Q) (Para 4. 2 S. S. C) Para 4. 2. 1 (Design discharge on the basis of catchment properties) The estimation of design discharge for waterway shall preferably be based, wherever possible, on procedures evolved from actual hydro meteorological observations of the same or similar catchments. ” Para 4. 2. 2 (Q 50, a flood with recurrence interval of 50 years) The design discharge (Q) normally shall be computed flood with a probable recurrence interval of 50 years. However at the discretion of PCE/CBE: a) Bridges where damage is likely to have severe consequences, may be designed with flood recurrence interval of more than 50 years b) Bridges on less important lines or sidings may be designed for floods with a probable recurrence interval of less than 50 years
 Conceptually")
Method of Estimation of Design discharge (Para 4. 3 of substructure code ) Conceptually the methods are based on a) From actual data (Para - 4. 3. 1) b) Statistical methods (Para - 4. 3. 2) c) Unit hydrograph (Para – 4. 3. 3) d) Synthetic hydrograph (Para-4. 3. 4 ) e) Other methods (stage-discharge relationship) (Para – 4. 3. 5)
 Contd")
Method of Estimation of Design discharge (Para 4. 3 of substructure code ) Contd Para 4. 3. 1 (Based on actual data) where Stream flow records (yearly peak discharges) are available for the desired recurrence interval or more – design discharge shall be : The computed flood for the desired recurrence interval Para 4. 3. 2 (Based on statical methods) Where such Stream flow records exist for less than the desired recurrence interval but sufficient for the statistical analysisdesign discharge may be : Computed statistically for the desired recurrence interval.
 Para")
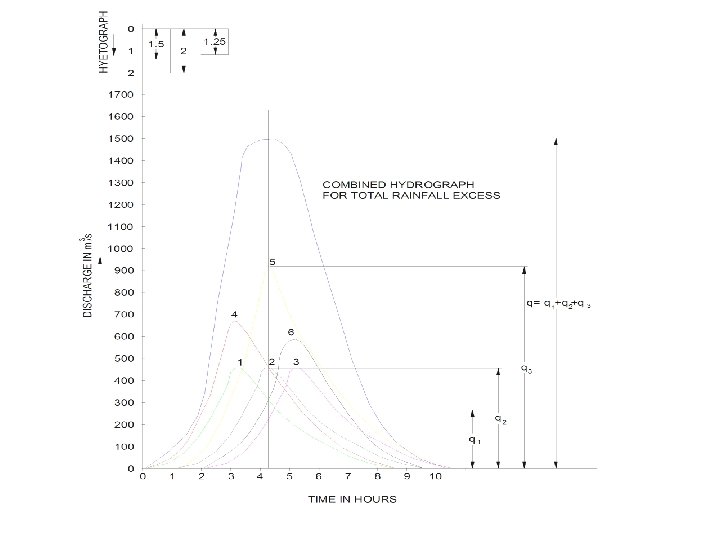
Method of Estimation of Design discharge (Para 4. 3 S. S. C ) Para 4. 3. 3 (Based on Unit hydrograph method) where records of floods are not of sufficient length to permit reliable statistical analysis but where a) Rainfall pattern & intensity records are available for sufficient length of time & b) Where it is feasible to carry out at least limited observations of rainfall & discharge to develop unit hydrograph based on such observations The design discharge for desired recurrence interval is computed using above unit hydrograph developed and applying appropriate design storm

Hydrograph A hydrograph is graph showing the discharge versus time at a specific point in river / channel. it commonly includes base flow component ( which is relatively steady contribution from ground water return flow) & direct run off component ( additional stream flow contributed by surface run off) Development of hydrograph( i. e. discharge v/s time graph on occurrence of rainfall in catchment

A unit hydrograph is the hypothetical response of a water shed ( in terms of run off volume & timing) to a unit input of rainfall It can be defined as direct run off hydrograph resulting from one unit( say 1 cm) of effective rainfall occurring uniformly over the water shed at a uniform rate over a unit period of time It is a hydrograph of direct surface run off resulting from unit effective excess rainfall generated uniformly over catchment.

Basic principles of UH For a given watershed Ø Storms of equal duration will produce runoff hydrographs with equivalent time bases regardless the intensity of rain. ( the base of the hydrograph of direct run off due to any effective rainfall depth in unit duration is constant) Ø The ordinates of direct surface run off hydrograph of a common base time ( same unit duration) are proportional to the effective rainfall Ø The hydrograph of direct run-off from a drainage basin due to a given pattern of effective rainfall will not change with time
 Para")
Method of Estimation of Design discharge (Para 4. 3 of substructure code ) Para 4. 3. 4 (Based on Synthetic Unit hydrograph & RDSO RBF-16 Report) Where such observations, as mentioned in Cl. 4. 3. 3 above, are not possible, a synthetic unit hydrograph may be developed for medium size catchment ( i. e. Area 25 sq. Km or more but less than 2500 sq. Km) by utilising established relationships as mentioned in Flood Estimation Report for respective hydro-meteorological sub zone, listed under Appendix V(i). For small size catchment (less than 25 sq. Km), design discharge may be estimated using the techniques described in RDSO report no. RBF-16, titled as “Flood Estimation Methods for Catchments less than 25 km 2 area. ”
 Contd Para")
Method of Estimation of Design discharge (Para 4. 3 S. S. C) Contd Para 4. 3. 5 (Based on other methods) Where feasible, gauging of the stream may be done to establish the stage – discharge relationships and the discharge at known HFL determined. Otherwise, the discharge may be estimated by slope area method after obtaining flood slope by field observations.

Flood estimation for small catchments : area < 25 sq km – RDSO report RBF-16

Modified rational formula RBF-16 suggests to use modified rational formula which incorporate s recurrence interval concept over the normal rational formula C= runoff coefficient A : catchment area in sq KM I 50 : 50 year rainfall intensity mm/hr = R 50(tc)/tc

Runoff coefficient, depends upon nature of soil, soil cover and location of catchment : R = 50 year 24 hrs point rainfall (cm) from figure given in the report for the country F : Areal reduction factor X : 0. 249 to 0. 498 depends on soil type and location
 (Ref Fig-1)")
50 year 24 hour point rainfall (Value of R) (Ref Fig-1)

Values of X S. No. Description of the Catchment Value of X 1. Sandy Soil/Sandy loam/Arid areas 2. Alluvium/silt loam/coastal areas 0. 332 3. Red soil/clayey loam/cultivated plains/tall crops/wooded areas 0. 415 4. Black cotton clayey soil/lightly covered/plain & barren Hilly soil/plateau and barren 0. 456 5. 0. 249 0. 498
 Catchment area Duration of Rainfall (Which is to")
Values of F (Areal reduction factor) Catchment area Duration of Rainfall (Which is to be taken as tc) (km 2) < 30 min 30 to 60 min 60 to 100 min < 2. 5 0. 72 0. 81 0. 88 > 2. 5 < 5. 0 0. 71 0. 80 0. 87 > 5. 0 < 13. 0 0. 79 0. 86 > 13. 0 < 25. 0 0. 68 0. 78 0. 85
")
Method of working out Q 50 Step-1: Calculate time of concentration ( in hrs) tc is time of concentration ( in hrs), It is the time taken by water to travel from most distant point on the periphery of catchment to the point of interest L is Length of longest stream ( in kms) from source to bridge site H = Height of farthest point above the point of interest along the river ( in meter) i. e. height of farthest point from bed level
 for given catchment area ( in sqkm)")
Step-2: working out areal reduction factor (F) for given catchment area ( in sqkm) & value of tc Step-3: working out Runoff coeff(C) For given description of catchment and value of F & R Step-4 : Calculation of 50 year rainfall intensity (I 50) in mm/hr lasting for tc hr duration = R 50(tc) by referring to fig-4 of report For tc hrs duration read from the report, the Ratio of 50 year tc hrs rainfall / 50 year 24 hrs rainfall R 50(tc) = R 50 (24 hr) rainfall x above ratio I = R 50(tc) / tc in hrs
")
50 year tc hour Rainfall (page 10 -fig 4)

Important Note: RBF-16 report contains 50 yr 1 hr rainfall data for certain subzones, in that case these data are to be used for working out R 50(tc) rainfall. These are given here under. Category-1: (R 50 -1 hr data available) Obtain 50 year 1 hr rainfall value using the appropriate rainfall map, if the catchment lies in any one of the subzones given below. Subzones 1(g), 2(b), 3(c), 3(d), 3(f), 3(h) {These maps are available as Fig 3. 1 to fig 3. 7 of RDSO report RBF-16, total 7 sub zones}

Category-2: (R 50 -24 hr data available & specific ratio of R 50 -1 hr/ R 50 -24 is available ) If the catchment lies in any one of the subzones given below for which 50 year 1 hour maps are not available. Obtain 50 year 24 hour rainfall using the appropriate rainfall maps and estimate the 50 year 1 hour rainfall value using the ratio of 1 hour to 24 hour rainfall given on the same maps. Subzones 1(b), 1(d), 1(e), 1(f), 3(a), 3(e), 3(i), 4(a, b &c), 5(a &b) {These maps are available as Fig 3. 8 to fig 3. 16 of RDSO report RBF-16, total 12 sub zones}

Category-3: (R 50 -24 hr data from All India map & ratio of R 50 -1 hr/ R 50 -24 as 0. 37 ) If the catchment lies in any one of the following zone/sub zones for which 50 year 1 hour or 50 year 24 hour rainfall maps are not available, obtain 50 year 24 hour rainfall value using all India map and estimate 50 year 1 hour value as equal to 0. 37 of 24 hour rainfall value Subzones 2(a), 1(c), 2(c), 3(g), 7 {The map is available as Fig 1 of RDSO report RBF-16, total 6 sub zones}
 using R 50(1 hr) rainfall Read the ratio")
Method of computing of R 50(tc) using R 50(1 hr) rainfall Read the ratio for tc hrs from figure-4 of the report (page-10 of Notes) Read the ratio for 1 hour from figure-4 of the report (page-10 of Notes) Obtain coefficient k = tc hrs ratio / 1 hr ratio R 50 tc hrs rainfall / R 50 1 hr rainfall R 50(tc) = k x R 50(1 hr) Rainfall intensity I = R 50 (tc)/ tc
 A =")
Sample calculations • Example: Working out Q 50 for small catchments 1) A = 2. 54 sqkm (Catchment area) 2) L = 2. 50 km (Length of longest stream course from source to bridge site) 3) H = 67. 25 m (Height of farthest point from bed level) 4) Description of catchment = Red soil R 50 - 24 hrs = 16 cms Value of F = X Run off coeff = Y Ratio of 50 year tc hrs rainfall/ 50 year 24 hrs rainfall= Ref fig-4 of report
 are: v Derivation of Synthetic")
Estimation of design discharge by SUH Steps involved (broadly) are: v Derivation of Synthetic unit hydrograph & plotting SUH v Estimation of design storm duration & intensity v Estimation of design loss-rate & base flow v Estimation of Rainfall excess units v Working out flood hydrograph

tr 1 Cm RAINFALL EXCESS tp TYPICAL UNIT HYDROGRAPH W 75 3 DISCHARGE IN m /s W R 75 Qp W 50 W R 50 TB TIME IN HOURS


Hydro meteorological zones Use of flood estimation reports : The country has been divided into 7 hydro meteorological zones and 26 subzones. Flood estimation reports have been published. (a joint work of CWC, RDSO, IMD, and MOST)
 Detailed steps involved in working out")
Flood estimation method for catchments (25 -2500 sqkm) Detailed steps involved in working out flood discharge (Q 50) based on SUH concept 1) Unit Hydrograph 2) 50 year -24 hrs Rain fall ( Plate-10 of the report) 3) Ratio for given storm duration (Fig-10 of the Report) 4) Areal reduction factor ( Table A-3 of the Report) 5) Time distribution of areal rainfall (Table A-02 of the Report)
 for catchments ( 25")
Method / steps for Estimation of Design discharge (Q 50) for catchments ( 25 to 2500 sqkm) Step-1: Work out effective stream slope (s) 2 th S =ƹ Li (Di-1 + Di)/L in m/km, where Li is length of i segment, Di-1 elevation of point i-1 from datum, L is length of longest stream Sr no Distance from bridge RL of stream bed Length of Height Di-1 + Di Li(Di-1 + segment above Di) Li datum at ith location Di Step-2: Determination of Synthetic 1 hr unit hydrograph parameters
 ) the parameters are as under tp Time taken")
(For kaveri sub zone -3(i) ) the parameters are as under tp Time taken from centre of rainfall excess(1 cm) in 1 0. 553(L LC √S)0. 405 hr unit duration to the UG peak( in hrs) qp Peak discharge of UG per unit area m 3/sec per sqkm 2. 043/(tp)0. 872 w 50 Width of UG measured at 50% of peak discharge ordinate ( in hrs) 2. 197(qp)1. 067 w 75 Width of UG measured at 75% of peak discharge ordinate ( in hrs) 1. 325/(qp)1. 088 WR 50 Width of UG on rising side at 50% of peak discharge 0. 799/(qp)1. 138 ordinate ( in hrs) WR 75 Width of UG on rising side at 75% of peak discharge 0. 536/(qp)1. 109 ordinate ( in hrs) TB Base width of UG (hrs) 5. 083(tp)0. 733 Tm Time taken from start of rainfall excess to UG peak Tm = tp + tr/2 Qp Peak discharge of UG m 3/sec Qp =qp x A

Step-3: Plotting of UH based on above calculated parameters as worked out in step-2 above and then working out discharge for each hr interval Volume of runoff from 1 cm excess rainfall on catchment area A sqkm = A x 1000 /100 m 3 ii) Volume of direct run off from SUH = £Q x 60*60 m 3 Therefore £Q =A/0. 36, Sum total of UH ordinates is equal to A / 0. 36 Step-4: Estimation of design storm duration TD = 1. 1 x tp Step-5: a) Estimation of point rainfall 50 year – 24 hrs rainfall to be taken based on bridge site location and subzone from various plate say plate-10 for kaveri basin zone 3(i). {Note: The 50 year -24 hrs rainfall data for all India are available as Fig 1 of RDSO report RBF-16} Then from fig-10 of report for a given storm duration ratio is to be read, Say for 7 hrs duration the ratio is 0. 74 So 50 year point rainfall for td duration = 50 year – 24 hr rainfall x Ratio
 Areal reduction factor The areal reduction factor depends upon catchment area and design")
b) Areal reduction factor The areal reduction factor depends upon catchment area and design storm duration ( Ref table-3 p-14 of the report) 50 year TD areal rainfall = 50 year TD point rainfall x ( point to areal rainfall ratio) Step-6 : Time distribution of areal rainfall The areal rainfall estimate for 50 years Td duration areal rainfall is further distributed to give one hourly gross rainfall units by using the distribution coeff for duration equal to design storm duration ( Ref Table A-2 page-13) Example 7 hrs design storm duration hourly Distributi on coeff 1 2 3 4 5 6 7 0. 62 0. 75 0. 83 0. 89 0. 94 0. 97 1. 00

Step-7: Estimation of rainfall excess units For each hr areal rainfall is calculated say for 3 rainfall rd hr (0. 83 -0. 75) x 50 year Td duration Earlier the design loss rate considered as 0. 5 cm/hr, which is to be Subtracted from above 1 hr rainfall, to get 1 hr rainfall excess units 0. 61 0. 355 Now Loss rate =1. 12 x R /(TD) Where R is TD duration areal rainfall in cm & Td is design storm duration in hrs. and loss rate in cm/hrs. Step-8: Estimation of base flow 3 Earlier , the design base flow rate is 0. 05 m /sec per sqkm therefore total base flow = 0. 05 x A Now Base flow qb =3 0. 032 / (A) base flow rate in m /sec/sq. km 0. 1004 , where A is catchment area in sqkm and qb is

Step-9: Estimation of design flood Unit Hydrograph Time 0 Excess rainfall units at time lag of one hr Discharg Ist hr e excess rainfall( R 1) Q 0 R 1 2 nd hr excess rainfall( R 2) - 3 rd hr excess rainfall( R 3) - 4 th hr excess rainfall( R 4) - 5 th hr excess rainfall( R 5) - 1 Q 1 R 1 Q 0 R 2 - - - 2 Q 2 R 1 Q 1 R 2 Q 0 R 3 - - 3 Q 3 R 1 Q 2 R 2 Q 1 R 3 Q 0 R 4 - 4 Q 4 R 1 Q 3 R 2 Q 2 R 3 Q 1 R 4 Q 0 R 5 5 Q 5 R 1 Q 4 R 2 Q 3 R 3 Q 2 R 4 Q 1 R 5 Q 5 R 2 Q 4 R 3 Q 3 R 4 Q 2 R 5 Base Design flood flow (Qb) Q 3 R 1+ Q 2 R 2+ Q 1 R 3+ Q 0 R 4+ Q

Sample Example A= 294 sqkm L= 43 km Lc= 22. 72 kms R 50 -24 hrs rain fall =17. 5 cms 1) Ratio for 50 yr 7 hr rain fall duration = X 2) Reduction factor for areal rainfall = Y 3) Time distribution for rain fall = Z 4) Loss rate = 0. 5 cm/hr 5) Base flow = 0. 05 x A 6) Details of RL of river bed at diff locations i) Volume of runoff from 1 cm excess rainfall on catchment area A = A x 1000 /100 m 3 ii) Volume of direct run off from SUH = £Q x 60*60 m 3 Therefore £Q =A/0. 36 Sum total of UH ordinates is equal to A / 0. 36

Catchment Parameters AREA OF CATCHMENT -A 5 4 CG OF THE CATCHMENT 3 Lc L LENGTH OF LONGEST STREAM : L LENGTH OF STREAM FROM NEAREST TO CG TO THE BRIDGE SITE – Lc 2 1 EQ. OR STASTICAL STREAM SLOPE- S
 ( Para 4. 4 S. S. C) To provide")
Design discharge for foundation (Qf) ( Para 4. 4 S. S. C) To provide for an adequate margin of safety against an abnormal flood of magnitude higher than the design discharge (Q), the foundation, protection works and training works except free board shall be designed for higher flood discharge. The magnitude of this discharge shall be computed by increasing design discharge (Q) estimated according to clause 4. 2, by the percentage indicated below. Catchment area Increase Up to 500 km 2 : 30% > 500 & upto 5000 km 2 : 30% - 20% > 5000 & upto 25000 km 2 : 20% - 10% > 25000 km 2 : Less than 10%
 Ø Upper Reaches (Mountainous) Ø Sub-montane Reaches (Foot Hills)")
Various River Phases (Para 801) Ø Upper Reaches (Mountainous) Ø Sub-montane Reaches (Foot Hills) Ø Quasi-Alluvial Reaches (Trough) Ø Alluvial Reaches Ø Tidal Reaches Types of rivers v Hilly, sub-mountain, alluvial, coastal v Meandering, straight, braided v Aggrading, degrading, stable v Flashy, virgin
 (Mountainous Rivers) These streams have Narrow & deep Cross Section")
UPPER REACHES (Para 802) (Mountainous Rivers) These streams have Narrow & deep Cross Section with very Steep bed Slopes Bed Material – Rock, in Boulders, Gravel River channel Rise of flood – Sudden and Flashy hills Water with high concentration of sediment load
 (Foot Hills) Bed slopes 1 in 50")
Sub-mountain river channel Sub-montane Reaches (Para 803) (Foot Hills) Bed slopes 1 in 50 to 1 in 500 Bed Material –Boulders, Gravel and sand Floods – Sudden and Flashy : All these channels normally overflow during high floods and the river acquires very wide and shallow cross section. The rivers in this reach are prone to progressively raise their beds by sediment deposition. Such rivers are known as "Aggrading" type.

• • Quasi Alluvial reaches Bed slopes 1 in 500 to 1 in 2500 Bed Material –Small size gravel and Medium sand Channel–Generally well defined course Alluvial Reaches (Para 805) ØBed slopes 1 in 2500 to 1 in 25000 ØRiver flows on flat Bed of Material Alluvium (sediment deposited by flowing water) ØRiver Meanders in its Khadir ( a strip of low land with in which river meanders) ØRiver Bed is normally stable

Meandering River Channel

Meandering river

Braided River Channel Island Type When flow in river channel is insufficient to transport the eroded material, & gets deposited , thereby blocking the channel. Another channel then may be formed and in course of time river bed become a network of such channels with island in between. Such streams are called braided stream

Island type braided channel

Straight Channel
 Aggrading: Rivers in this reach are prone to raise their")
Types of Rivers (Contd) Aggrading: Rivers in this reach are prone to raise their beds by sediment deposition, due to reduction in velocity. Degrading: lowering of bed by erosion due to higher velocity Stable: No perceptible rise of lowering of river bed occurring over long periods Virgin: They have no outfall in the sea nor do they join any other stream. Such rivers after traversing some distance loose all their water by percolation & evaporation

Aggrading river Aggrading: Rivers in this reach are prone to raise their beds by sediment deposition, due to reduction in velocity.

Degrading river Sinking of pier Degrading: lowering of bed by erosion due to higher velocity

Stable river Stable: No perceptible rise of lowering of river bed occurring over long periods

Flashy Rivers in the hills
 Para 4. 5. 1")
Design of Water ways (S. C. C Para 4. 5) Para 4. 5. 1 In the case of a river which flows between stable high banks and which has the whole of the bank-to-bank width functioning actively in a flood of magnitude Q the waterway provided shall be practically equal to the width of water spread between the stable banks for such discharge. If, however, a river spills over its banks and the depth of spill is appreciable the waterway shall be suitably increased beyond the bank-to-bank width in order to carry the spill discharge as well.

Para 4. 5. 3 For river with alluvial beds and sustained floods the waterway shall normally be equal to width given by Lacey’s formula : Pw = 1. 811 C √Q 4. 83 (Q)0. 5 Pw = Wetted perimeter in metres which can be taken as the effective width of waterway in case of large streams Q = design discharge in cum/sec C = a coefficient normally equal to 2. 67, but which may vary from 2. 5 to 3. 5 according to local conditions depending upon bed slope and bed material.

Para 4. 5. 4 If the river is of a flashy nature i. e. the rise and fall of flood is sudden or the bed material is not alluvial and does not submit readily to the scouring effect of the flood, Lacey’s regime width formula as given in clause 4. 5. 3 will not apply Para 4. 5. 5 In case of rivers in sub-montane stage, where the bed slopes are steep and the bed material may range from heavy boulders to gravel, it is not possible to lay down rigid rules regarding constriction of water way. Any constriction in such cases shall be governed largely by : v. The configuration of active channels v. The Cost involved in diversion & training of these channels v. The cost of guide bunds which will need much heavier protection than the guide bunds of alluvial rivers. Each case shall be examined on merits from both hydraulic & economic consideration and best possible solution choosen

Para 4. 5. 6 Incaseofabridgehavingoneormorepiers, the width of waterway obtained from procedure outlined in clause 4. 5. 3 to 4. 5. 5 above shall be increased by twice the sum of the weighted mean submerged width of all the piers including footings for wells to arrive at the total width of waterway to be provided between the ends of the bridge; where such increase is not made, the same shall be applied as a deduction from the total width of waterway actually provided to arrive at the effective width. Para 4. 5. 6. 1 If the width of the pier is b 1, for a height h 1, and b 2 for height h 2 in the submerged portion of the pier having a total height h 1 + h 2, the weighted mean submerged width is given by the expression. bmean = h 1 b 1+h 2 b 2/(h 1 + h 2)

Para 4. 5. 7 Forgaugeconversionanddoublingworks, where there is no history of past incidents of over flow/washout/excessive scour etc during last 50 years the water way of existing bridge may be retained after taking measures for safety as considered necessary by Chief Engineer In charge. For locations where there is history of past incidents of overflow/washout/excessive scour, the waterway has to be re-assessed based on the freshly estimated design discharge using clause 4. 3. 1 to 4. 3. 4. For locations, where existing bridges are less than 50 years old and there is no past history of incidents of over flow/washout/excessive scour etc, the water way may be judiciously decided after calculation of the design discharge and keeping in view the water way of existing bridges on adjacent locations on the same river.

Para 4. 5. 8 For rebuilding of bridge, waterway shall be determined keeping in view the design discharge as worked out from clause 4. 3 Para 4. 5. 9 For strengthening existing bridges by jacketing etc, a reduction in waterway area as per the limits specified below may be allowed by the Chief Bridge Engineer provided that there has been no history of past incidents of overflow/washout/excessive scour etc and that measures for safety as considered necessary by the Field Engineer and approved by CBE are taken. SN SPAN OF BRIDGE REDUCTION IN WATERWAY AREA ALLOWED AS %AGE OF EXISTING WATERWAY. 1 Upto and including 3. 05 m 20% 2 3. 05 m to 9. 12 m including Varying linearly from 20% to 10% 3 Greater than 9. 12 m 10% Further reduction in the area shall be subject to CRS sanction and submission of detailed calculation of waterways etc. Where the clearances are not available, the bridge should be rebuilt
 Para 4. 6. 1 The")
Depth of Scour (Para 4. 6 S. S. C) Para 4. 6. 1 The probable max depth of scour for design of foundations and training & protection works shall be estimated considering local condition Para 4. 6. 2 Wherever feasible & especially for flashy rivers and with beds having boulders or gravels sounding for purpose of determining the depth of scour shall be taken in the vicinity of site proposed for the bridge. Such sounding are best taken during or immediately after flood In calculating design depth of scour allowance shall be made in the observed depth for increased scour due to i)The Design discharge being greater than observed discharge ii) Increase velocity due to constriction iii)Increase in scour in the proximity of pier/abutments

Where qf is the discharge intensity in cubic metre per second per metre width and ‘f’ is silt factor as defined in clause 4. 6. 3.

Para 4. 6. 6 The depth calculated (vide clause 4. 6. 3 and 4. 6. 4 above) shall be increased as indicated below, to obtain maximum depth of scour for design of foundations, protection works and training works : Nature of the river Depth of scour In a straight reach 1. 25 D At the moderate bend conditions e. g. Along apron of guide bund 1. 5 D At a severe bend 1. 75 D At a right angle bend or at nose of piers 2. 0 D In severe swirls e. g. Against mole head of a guide bund 2. 5 to 2. 75 D Para 4. 6. 5 The silt factor ‘f’ shall be determined for representative samples of bed material collected from scour zone using the formula : f = 1. 76 √m Where m is weighted mean diameter of the bed material particles in mm

The Values for ‘f’ for different types of bed material, commonly met with are given below: Type of bed material Weighted mean dia of particle (mm) Value of ‘f’ (i) Coarse silt 0. 04 0. 35 (ii) Fine sand 0. 08 0. 15 0. 50 0. 68 (iii) Medium sand 0. 3 0. 5 0. 96 1. 24 (iv) Coarse sand 0. 7 1. 0 2. 0 1. 47 1. 76 2. 49 D 1/D 2 (f 2/f 1)(1/3) (m 2/m 1)(1/2) x (1/3) (m 2/m 1)1/6 D 1/D 2 = (2/0. 04) 1/6 = 1. 92 Para 4. 6. 7 In case of clayey beds, wherever possible, maximum depth of scour shall be assessed from actual observations
 Afflux (h): The rise in")
AFFLUX (Para 4. 7 of sub structure code ) Afflux (h): The rise in water level upstream of bridge as a result of obstruction to the natural flow caused by the construction of the bridge & its approaches For streams with non-erodible beds, the afflux may be worked out by Molesworth formula given below : h = {V 2/17. 88 + 0. 01524} x {(A/a) 2 - 1} Where, h = afflux in metres V = Velocity in un-obstructed stream in m/sec 2 A = Un obstructed sectional area of the river in m 2 a= Sectional area of the river at obstruction in m. Para 4. 7. 2 In case of rivers with erodible beds, full afflux as calculated by the formula may not occur Clearance & free board Back
 Method statement for Finalisation of Span")
Finalisation of span arrangement & foundation depth. a) Method statement for Finalisation of Span arrangement Following steps are involved to finalise the span arrangement for a given design discharge Step-1: Estimation of linear water way based on various guidelines i) Based on Flood Estimation Report The Flood estimation report suggests/ recommends the linear water way width, required to be provided, to cater given design discharge (Q 50). Eg : sub zone 3(i) kaveri basin, Linear water way recommended is = 4. 98 (Q 50) 1/3 ii) Based on Lacey’s Regime width (Para 4. 5. 3 SSC) Wetted perimeter Pw = 1. 811 C √Q Where C = a coefficient normally equal to 2. 67, but which may vary from 2. 5 to 3. 5 according to local conditions depending upon bed slope and bed material, Considering C = 2. 67 the 0. 5 Pw 4. 83 (Q 50) Accordingly Wetted perimeter Pw = 4. 83 (Q 50). 1/2
 Based on width of active channel in stream/River (Para 4. 5. 1 of")
iii) Based on width of active channel in stream/River (Para 4. 5. 1 of S. S. C) a) Bank to Bank width of River regime b) Extent of spilling of water beyond bank to bank width c) Width of Active channel of water in the River regime = ---------= ----- Waterway based on width of active channel including spilling of water if any = -----Illustration -1) Suppose bank to bank width of river is 18 meters and active channel width is 9 meters then waterway to be provided can be taken as 9 meters provided it satisfies all the norms in terms of velocity of flow, free board, clearance, HFL. Illustration 2) Suppose bank to bank width is 21 meters, the river is flowing full bank to bank and there is a water spilling beyond banks by say 4 meters width. In this case the waterway to be provided shall be 25 meters
 Min. Possible linear Water")
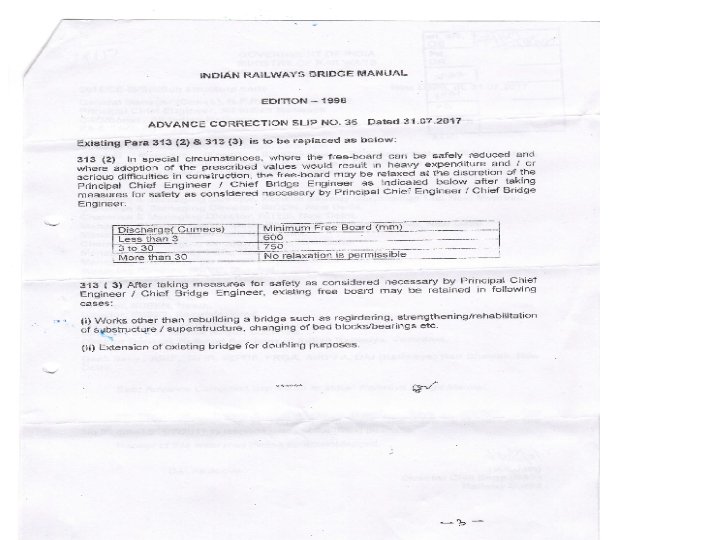
Step-2: Possible maximum & minimum linear water way width a) Min. Possible linear Water way Width = ----- (generally based on flood estimation report) b) Max. Possible linear Water way Width= ------ (based on bank to bank width + water way for spill water). Step-3: Selecting type of bridge (pipe culvert / Box culvert / Arch / Slab / Girder Bridge) The type of bridge shall be selected on the basis of various factors such as design discharge (Q 50), linear water way requirement, velocity of flow, scour depth requirement, approach bank height, soil strata conditions. Step-4: Fixing norms for Free board, vertical clearance based on type of bridge selected) i) Norms for Free Board The Minimum free Board from water level of design discharge to formation level of Railway embankment or top of guide bund shall be one meter; however CE/CBE can relax Free Board in special Circumstances as indicated below: -
 Less than 3 3 to 30 More than 30 Min free board")
Discharge (cumecs) Less than 3 3 to 30 More than 30 Min free board (mm) 600 mm 750 mm No Relaxation ii) Norms for vertical clearance: Bridges excluding arch bridges, pipe culvert and Box culverts Siphons, Pipe & Box culverts No clearances are considered necessary Arch Bridge Span of Arch Discharge (cumecs) Vertical clearance ( in mm) 0 - 30 600 mm 31 -300 600 – 1200 mm 301 - 3000 1500 mm Above 3000 1800 mm Clearance ( in mm) Less than 4 m Rise or 1200 mm 4. 0 to 7. 0 m 2/3 rise or 1500 mm 7. 1 to 20. 0 m 2/3 rise or 1800 mm Above 20. 0 m 2/3 rise

The vertical Clearance can be relaxed by CE/CBE provided: Adoption of prescribed clearance results in heavy expenditure and /or serious difficulties---The clearance can be safely reduced to: - Discharge (cum) Less than 3 Clearance (mm) 300 3 to 30 31 to 300 - 400 (Prorata) 400 - 1200 (Prorata) It shall be personally exercised by PCE/CBE, due consideration being given to past history of bridge. iii) Norms for velocity of flow The norms for velocity of flow can be taken as 3 m/sec based on sub structure code Para 5. 9. 2. 1. 2. However, velocity during annual peak flow if available can be used for guidance. iv) Norms for HFL The computed value of HFL based on depth of flow calculated for assumed water way width should be close to observed HFL. River flow conditions during annual peak flow can also be used for guidance.

Step-5: Value of n & bed slope of stream: The Value of n & slope to be considered as under: 2/3 1/2 Slope (S) : While calculating velocity of flow ( V = 1/n x R x. S ), the average slope (S) of the river bed is to be determined from a point about 2 kms upstream of the Railway crossing to a point 2 kms downstream of the same. In case there are sharp changes in the bed slopes, the local bed slope should be determined over a shorter length. (Para 305(2) Bridge manual). Channel / stream condition Value of n i) Natural channel in fairly good condition 0. 030 ii) Natural channel in fairly bad condition 0. 040 iii) Natural channel with variable section & some vegetation growing on banks 0. 050 iv) Vegetation growing on banks in very bad condition 0. 060 - 0. 10
 for assumed width of water way (B)")
Step-6: Working out depth of flow (d) for assumed width of water way (B) Total width of waterway assumed = B No of piers assumed = N Effective width of pier assumed = b Effective width of waterway shall be (B’) = B – n x 2 b Q 50 = A x (1/n x R 2/3 x. S 1/2 ) 2/3 1/2 Q 50 = ( B’ x d) x (1/n) ((B’x d)/ (B’+ 2 d)) (S ) Using above equation, work out depth of flow (d) for assumed value of width of water way (B)/ effective width of waterway B’.

Step-7: Estimating various parameters for the set of assumed value of B (width of water way) & calculated value of d (depth of flow) 1. 2. 3. 4. 2/3 1/2 Actual Velocity of flow V = 1/n x R x. S = (1/n) ((B’x d)/ (B’+ 2 d)) (S ) Calculated HFL = Bed level + d Vertical clearance = bottom of slab / girder or underside of box top/pipe – Free board = Approach bank height – (HFL + afflux) ( HFL + afflux) Note: For various widths of waterway as assumed @ suitable interval , between the minimum & maximum possible width of waterway estimated in the step-2, workout depth of flow d for 5 to 7 values of assumed width of waterway & the calculate the above 4 parameters i. e. velocity of flow , calculated HFL, vertical clearance, free board. Compare the values of calculated parameters with laid down norms as discussed in step 4 above.

Step-8: Finalisation of span & working out various parameters for chosen span Based on the exercise done under step-7, the minimum span, which satisfy all laid down norms in terms of velocity of flow, HFL, vertical clearance, free board and which can utilise as far as possible the available standard spans of RDSO is finalise. Now for this proposed span arrangement, the depth of flow is calculated on the basis of accurate value of hydraulic radius and the various parameters i. e. actual velocity of flow, HFL, vertical clearance & Free board are computed, compared & checked again with norms laid down for these parameters to finalise the span arrangement.
 Method statement for Estimation of depth of foundation for given span arrangement based")
b) Method statement for Estimation of depth of foundation for given span arrangement based on scour depth criteria Step 1 - Design discharge for foundation: The design discharge for foundation (Qf) shall be estimated based on Q 50 & size of Catchment (Design discharge for foundation (Para 4. 4 S. S. C) Catchment area Increase over Q 50 Up to > 500 & up > 5000 & up 500 km 2 to 5000 to 25000 km 2 30% - 20% - 10% > 25000 km 2 Less than 10%

Step 2 – Normal Scour depth: Now for the given of, the scour depth is estimated using following formula. a) The normal depth of Scour (D) below the foundation design discharge (Qf) level may be estimated from Lacey’s formulas as indicated below D = 0. 473 (Qf/f) 1/3 ----- Eq-1 ( Para 4. 6. 3 SSC) b) Where due to constriction of waterway, the width is less than Lacey’s regime width for Q or where it is narrow and deep as in the case of incised rivers and has sandy bed, the normal depth of scour may be estimated by the following formula q 2 1/3 D = 1. 338 ( f /f) -------Eq-2 (Para 4. 6. 4 SSC)

Step 3 - Maximum anticipated scour level from water level corresponding to Qf : The depth calculated based on Eq- 1 OR Eq-2 above ( as the case may be), shall be increased as indicated below, to obtain maximum depth of scour for design of foundations, For Abutment: 1. 25 x D For Pier: - 2 x. D

Step 4 - Maximum anticipated scour level from bed level: The scour depth calculated in step 3 above, refers to maximum anticipated scour level from the water level corresponding to Qf, therefore the depth of maximum scour level from the bed level can be ascertained if depth of flow corresponding to Qf is known. The depth of flow corresponding to design discharge for foundation (Qf) for given span arrangement shall be worked out using equation discussed under para A step-6 above. The maximum anticipated scour depth from bed level shall be accordingly worked out after deducting the depth of flow corresponding to Qf. Step 5 - Grip Length : The foundation should rest below the maximum anticipated scour length for certain length called as grip length, the value of grip length in case of open foundation is 1. 75 m in case of ordinary soil. However if the rock strata ( soft or rock ) is available at higher level which is considered as non-erodible bed then the foundation should keyed in rock for 0. 3 m ( in case of hard rock) & 1. 5 m ( in case of soft rock).
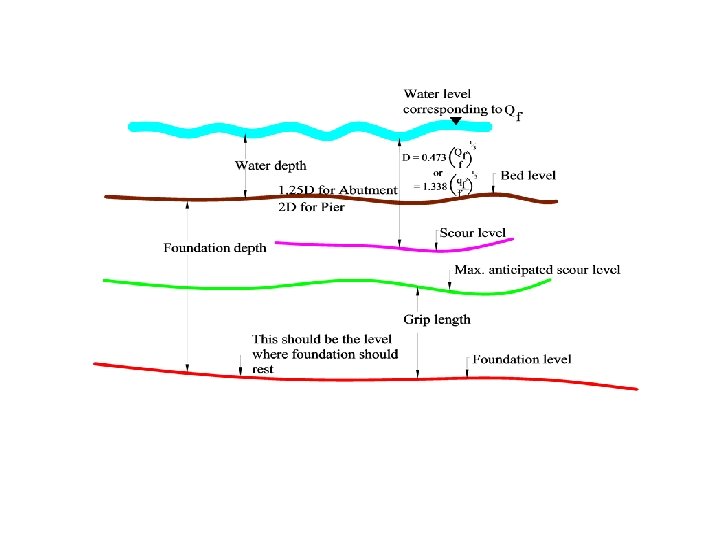

Step 6 Depth of foundation: The depth of foundation shall be accordingly = Maximum scour depth from bed level (as worked out in Step 4) + Grip length (as discussed in Step 5). Note : In case non scour able strata (rock strata) is available at shallow depths, then the foundation shall rest at that level suitably keyed into the rock strata (as discussed in Step 5 above), irrespective of scour depth calculated in the Step 2 and 3 above. Note: Rly Board Instructions on Minimum span size: (Ref: Correction slip 25 dated 17 -12 of bridge manual) Minimum clear span =1 m for new bridges and Rebuilding of existing bridges Minimum headroom =1. 2 m for new bridges, however while constructing / rebuilding new bridges on existing lines all efforts to provide it, otherwise PCE/CBE may permit relaxation

References: 1. Sub Structure Code -2013 2. RBF-16 report published by RDSO 3. Flood estimation report for kaveri basin sub zone – 3(i) Field work 1. To see calculations for Q 50 for small/ medium size catchments for new line / doubling projects in design / construction office 2. Plotting catchment for a bridge from topo sheet & Working out catchment properties Thank You
- Slides: 87