BREAST CANCER SUBTYPE IDENTIFICATION USING RNASEQ DATA Dvir

BREAST CANCER SUBTYPE IDENTIFICATION USING RNA-SEQ DATA Dvir Netanely Shamir’s Group Meeting Tel-Aviv University June 2013

Breast Cancer • A Common disease • 1, 300, 000 cases, 450, 000 deaths each year worldwide • Heterogeneous with respect to • Molecular alterations • Many different cellular scenarios can lead to cancer • Cellular composition • Tumors are composed of several types of cells • Clinical outcome • Outcome prediction is challenging

Breast Cancer Clinical Subtypes • Breast cancer tumors are clinically categorized into three basic groups, each with its own therapeutic approach: • ER+ (Luminal) • HER 2 • Basal-like (Triple-negative) • Classification of breast cancer tumors into distinct subtypes is critical for planning treatment and for developing new therapies.

Project Goals • Improve the classification of cancer samples into therapeutically-relevant utilizing the flood of new high throughput data sources. • Identify biomarkers that are specific to certain subtypes, outcomes.

Breast cancer subtype classification based on gene expression • In 2000, Botstein et al. identified 4 classes of breast cancer based on gene expression analysis. • 65 samples, 496 genes were used for clustering. • Identified 4 molecular sub-types: • ER+/luminal-like • Basal-like • Her 2 (Erb-B 2+) • Normal-like Molecular portraits of human breast tumours David Botstein et al. , Nature 406, 747 -752 (17 August 2000)

Breast cancer subtype classification based on gene expression “Gene expression patterns of breast carcinomas distinguish tumor subclasses with clinical implications”, Botstein et al. 2001 • 85 c. DNA microarrays, newer chip, same genes as in the previous study. • Identified five robust sub-types: • Luminal A • Luminal B • HER 2 -enriched • Basal-like • Normal-like • Luminal was divided into two subgroups. • Survival analyses on a subcohort of patients showed significantly different outcomes for the patients belonging to the various groups.

PAM 50 Classifier • In 2009, Parker et al. derived a set of 50 genes that robustly classify the five above subtypes of breast cancer. • Analysis based on 189 tumors, 29 normal. • The PAM 50 gene set has high agreement in classification with larger “intrinsic” gene sets previously used for subtyping, and is now commonly employed. Supervised Risk Predictor of Breast Cancer Based on Intrinsic Subtypes, Parker at al. 2009

PAM 50

Comprehensive molecular portraits of human breast tumours The Cancer Genome Atlas Network Nature Volume: 490, Pages: 61– 70 October 2012 Identification of Breast Cancer subtypes based on data coming from five different technologies (not including RNA-Seq)

Paper’s Essence • 466 Breast cancer samples from 825 patients were clustered based on data coming from 5 different technologies. • Showed correlation between yielded clusters and PAM 50 labels. • Additionally performed “consensus clustering” which is a clustering of the clusters produced independently by the various technologies.

Technologies used • m. RNA microarrays • Measures m. RNA levels for thousands of genes based on • • • probe hybridization DNA methylation arrays • Detects methylation levels Genomic DNA copy number arrays • Identifies amplifications and deletions on the DNA level Exome sequencing • Identifies genetic variance in the form of somatic mutations within the coding regions of the genome (1% of the genome). micro. RNA sequencing • Measures mi. RNA levels using deep sequencing Reverse-phase protein arrays • Measures protein abundance using antibodies

m. RNA microarrays analysis Unsupervised hierarchical clustering analysis of 525 tumours and 22 tumour-adjacent normal tissues using the top 3, 662 variably expressed genes. >High correlation to PAM 50 subtypes and to clinical data.
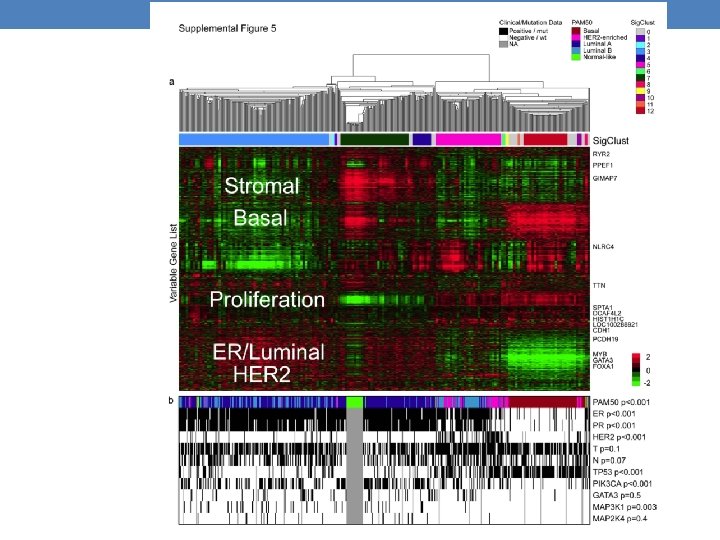

Coordinated analysis of breast cancer subtypes defined from five different genomic/proteomic platforms. a, Consensus clustering analysis of the subtypes identifies four major groups (samples, n = 348). The blue and white heat map displays sample consensus. b, Heat-map display of the subtypes defined independently by mi. RNAs, DNA methylation, copy number (CN), PAM 50 m. RNA expression, and RPPA expression. The red bar indicates membership of a cluster type. c, Associations with molecular and clinical features. P values were calculated using a chi-squared test. DC Koboldt et al. Nature (2012)

Another paper about detecting BRCA subtypes – 10 subtypes Detected 10 subtypes with distinct outcomes Two types of data: 1. Expression: Human. HT-12 v 3 Expression Bead. Chip – Illumina 2. Copy number: Aymetrix SNP 6. 0 platform Using as external labels: • PAM 50 • GENIUS http: //genomebiology. com/content/11/2/R 18 Integrative clustering using i. Cluster (2009): Joint latent variable framework for integrative clustering

RNA-SEQ BASED IDENTIFICATION OF BREAST CANCER SUBTYPES

RNA-Seq • RNA-Seq is a recently developed approach to transcriptome profiling that uses deep-sequencing technologies. • Like microarrays it can provide m. RNA abundance quantification and considered to be… • More precise • Less noisy • Higher dynamic range • Also provides the RNA sequence itself

The TCGA RNA-Seq Breast Cancer Dataset • RNA-Seq data and Clinical data for 956 samples were downloaded from TCGA web site • 107 Normals, 849 Tumors • 20531 genes • Sample annotations include PAM 50 labels. PAM 50 Label Distribution Type #Sample NA 298 Normal 107 ? 39 Basal-Like 95 Her 2 56 Luminal A 229 Luminal B 125 Normal Like 7

Data Preprocessing • Removed samples for which PAM 50 isn’t available • Starting with 20531 genes • Flooring to 4 • Log 2 • Keeping only top 10% variable genes (n=2053) • Standardizing the rows

Let the Clustering begin… • Goal: Partition the samples into groups exhibiting high correlation to PAM 50 labels. • Started with Hierarchical clustering. • Difficult to visualize (hundreds of samples) • A measure is needed to determine correlation to PAM 50 labels.

Applying hierarchical clustering on samples 1: 3: 956 PAM 50 ER Normal Her 2 Negative PR HER 2 Normal Positive Negative Luminal. B Luminal. A Negative Positive Tumor
")
Applying hierarchical clustering on different subsets of samples (All samples)
")
Applying hierarchical clustering on different subsets of samples (Tumors only, without Normals)
")
Applying hierarchical clustering on different subsets of samples (Luminal A, Luminal B, normal-like)

Insights • PAM 50 subtype detection – some labels are easier to detect than others. From easiest to hardest: • Normal • Basal-Like • Her 2 • Luminal B • Luminal A • Decision Tree approach in place? Multi step algorithm that uses different gene subsets for every step ? • A measure is needed for evaluating clustering solutions and their correspondence to external labels. • Global score or per cluster score ?

Finding measures for evaluating clustering solutions I •
")
Intersection of Clustering sol. and PAM 50 (Samples ordered by PAM 50)

Intersection of Clustering sol. and PAM 50

Finding measures for evaluating clustering solutions II •
")
Applying the two measures on various clustering solutions (Hierarchical Clustering, Euclidean distance, Complete linkage)
")
Intersection block diagram (Hierarchical Clustering, Euclidean distance, Complete linkage)

Which parameter set will yield a clustering solution which best corresponds to PAM 50 labels ? [euclidean] [complete] [seuclidean] [complete] [minkowski] [complete] [euclidean] [ward] [cosine] [complete] [spearman] [complete] [euclidean] [ward] [spearman] [complete] [cosine] [complete] [correlation] [complete] [euclidean] [complete] [seuclidean] [complete] [cityblock] [complete] [minkowski] [complete] [cosine] [complete] [correlation] [complete] 15 15 15 20 30 40 30 30 50 20 40 40 40 20 20 30 50 0. 798061 0. 79483 0. 793215 0. 789984 0. 785137 0. 783522 0. 781906 0. 778675 0. 775444 0. 772213

KMeans - Correlation

KMeans 15 - 0. 83

Click – Correlation distance metric

Click – Dot Product distance metric

Insights • Better measurement is out there ? One that will penalize high number of clusters. • Global Jaccard Index prioritizes solutions with the same number of clusters. • KMeans results are random, hard to identify best parameters.

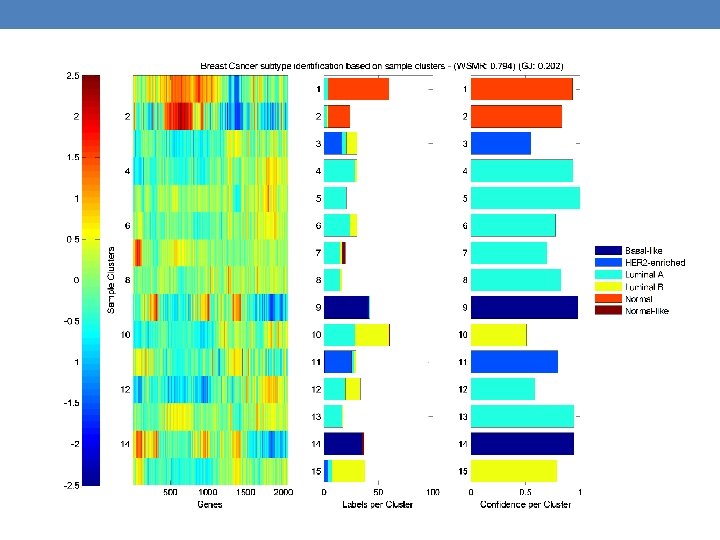
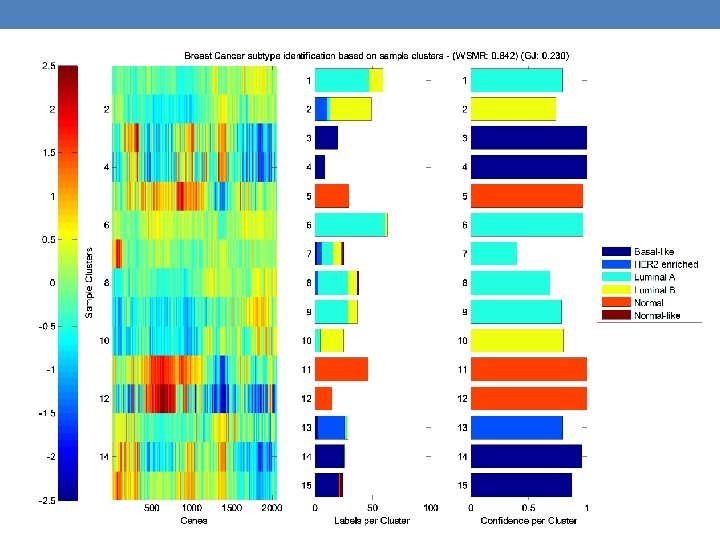
Applying our measures on TCGA’s clusters

Building a clustering based classifier • Find a clustering solution composed of clusters that are highly homogenous with respect to external label. • Assign a single label to each cluster based on calculation of maximal ratio. • Map each new sample to a cluster based on profile correlation. • Assign the new sample with the cluster’s label.

Accuracy distribution over 40 executions Kmeans 15, correlation- Mean: 0. 7512, min: 0. 669, max: 0. 830

Kmeans 15, Correlation distance – Example for high score


Accuracy distribution over 40 executions Kmeans 15, euclidean - Mean: 0. 734, min: 0. 64, max: 0. 798

Kmeans 15, Euclidiean distance – Example for low score High WSMR but low accuracy

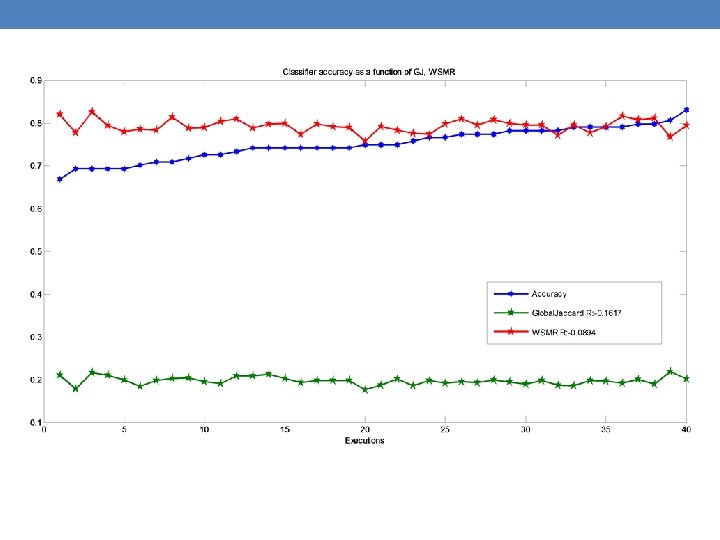

Summary • Global-Jaccard, WSMR and classifier’s accuracy are all measures indicative of how well our algorithm can cluster the samples into meaningful groups. • Additional measures are needed. • These measures shall be used to fine-tune the clustering algorithm.

Next Steps • Complete development of classifier evaluation measures • Look for better clustering evaluation measure in correlation with classifier accuracy. • Improve classifier by • Smarter gene selection, better preprocessing • Identify best clustering algorithm, distance metric, parameters • Use the two confidence values (R and Max. Ratio) to estimate overall prediction confidence • Use different set of genes for each step (Decision tree) • Focus on Luminal. A-Luminal. B separation • Use additional data sources • Try other classification methods • Look for significant survival differences of patients mapped to different clusters.
- Slides: 50