
Breakout 5 1 Science Overview Daniel Eisenstein Harvard
Breakout 5. 1: Science Overview Daniel Eisenstein (Harvard) DESI Co-Spokesperson D. Eisenstein 09/09/2014 CD-1 Review 1
Outline • Baryon Acoustic Oscillations and Redshift-Space Distortions: State of the field • DESI L 1 Requirements • Forecasts for DA, H: Methods and results • Figures of Merit • Cosmology beyond Dark Energy • Science Alternatives Analysis • Science Collaboration D. Eisenstein 09/09/2014 CD-1 Review 2
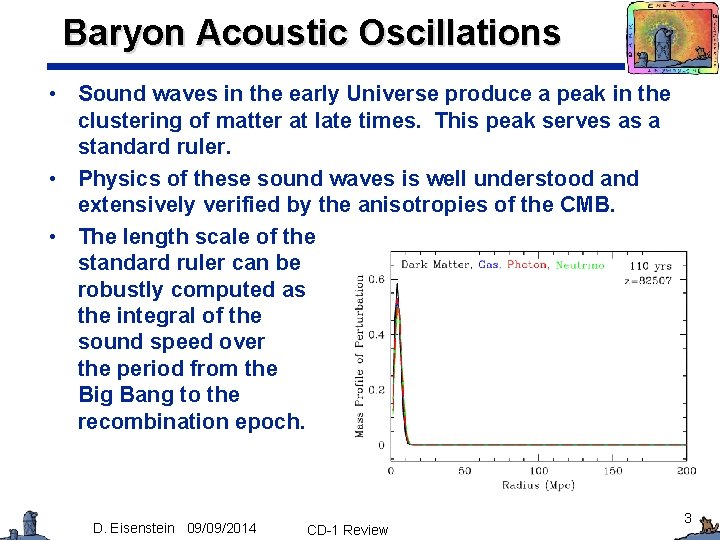
Baryon Acoustic Oscillations • Sound waves in the early Universe produce a peak in the clustering of matter at late times. This peak serves as a standard ruler. • Physics of these sound waves is well understood and extensively verified by the anisotropies of the CMB. • The length scale of the standard ruler can be robustly computed as the integral of the sound speed over the period from the Big Bang to the recombination epoch. D. Eisenstein 09/09/2014 CD-1 Review 3
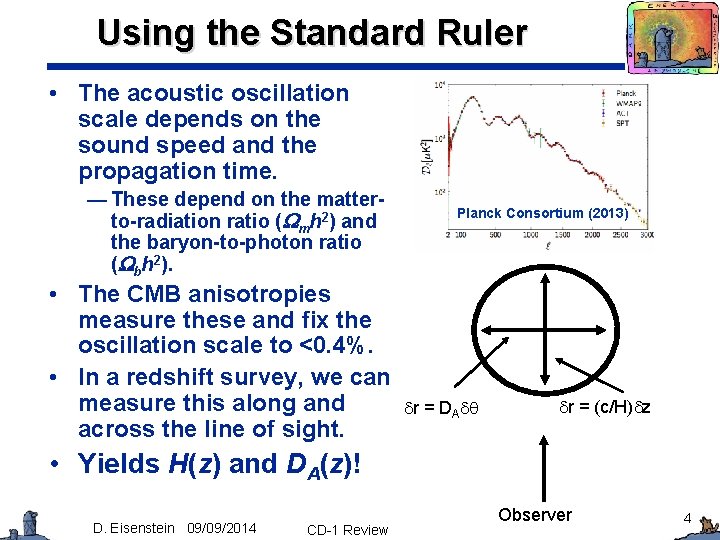
Using the Standard Ruler • The acoustic oscillation scale depends on the sound speed and the propagation time. — These depend on the matterto-radiation ratio (Wmh 2) and the baryon-to-photon ratio (Wbh 2). • The CMB anisotropies measure these and fix the oscillation scale to <0. 4%. • In a redshift survey, we can measure this along and across the line of sight. Planck Consortium (2013) dr = DAdq dr = (c/H)dz • Yields H(z) and DA(z)! D. Eisenstein 09/09/2014 CD-1 Review Observer 4
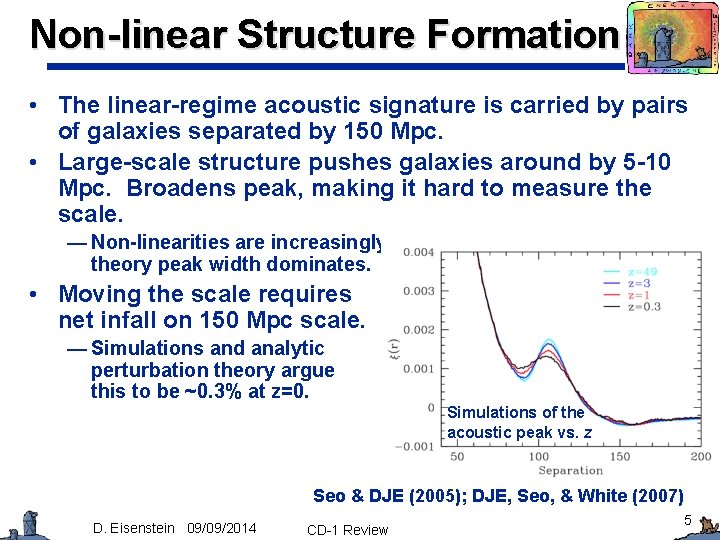
Non-linear Structure Formation • The linear-regime acoustic signature is carried by pairs of galaxies separated by 150 Mpc. • Large-scale structure pushes galaxies around by 5 -10 Mpc. Broadens peak, making it hard to measure the scale. — Non-linearities are increasingly negligible at z>1. Linear theory peak width dominates. • Moving the scale requires net infall on 150 Mpc scale. — Simulations and analytic perturbation theory argue this to be ~0. 3% at z=0. Simulations of the acoustic peak vs. z Seo & DJE (2005); DJE, Seo, & White (2007) D. Eisenstein 09/09/2014 CD-1 Review 5
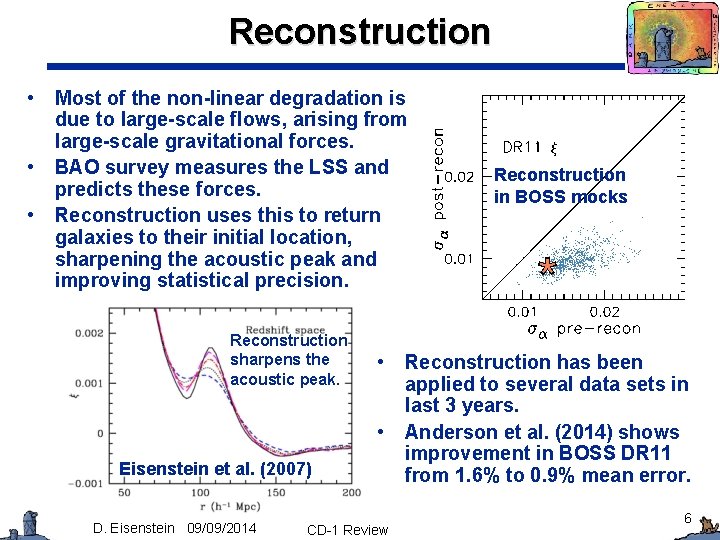
Reconstruction • • • Most of the non-linear degradation is due to large-scale flows, arising from large-scale gravitational forces. BAO survey measures the LSS and predicts these forces. Reconstruction uses this to return galaxies to their initial location, sharpening the acoustic peak and improving statistical precision. Reconstruction sharpens the acoustic peak. • • Eisenstein et al. (2007) D. Eisenstein 09/09/2014 CD-1 Review Reconstruction in BOSS mocks Reconstruction has been applied to several data sets in last 3 years. Anderson et al. (2014) shows improvement in BOSS DR 11 from 1. 6% to 0. 9% mean error. 6
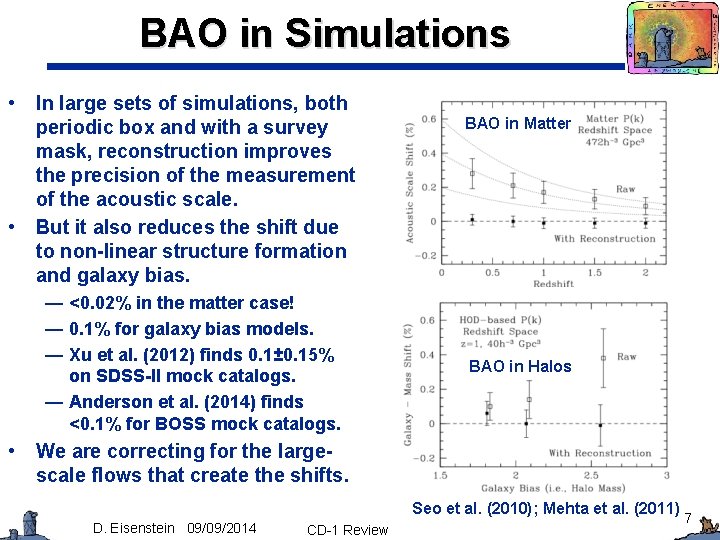
BAO in Simulations • • In large sets of simulations, both periodic box and with a survey mask, reconstruction improves the precision of the measurement of the acoustic scale. But it also reduces the shift due to non-linear structure formation and galaxy bias. — <0. 02% in the matter case! — 0. 1% for galaxy bias models. — Xu et al. (2012) finds 0. 1± 0. 15% on SDSS-II mock catalogs. — Anderson et al. (2014) finds <0. 1% for BOSS mock catalogs. • BAO in Matter BAO in Halos We are correcting for the largescale flows that create the shifts. Seo et al. (2010); Mehta et al. (2011) D. Eisenstein 09/09/2014 CD-1 Review 7
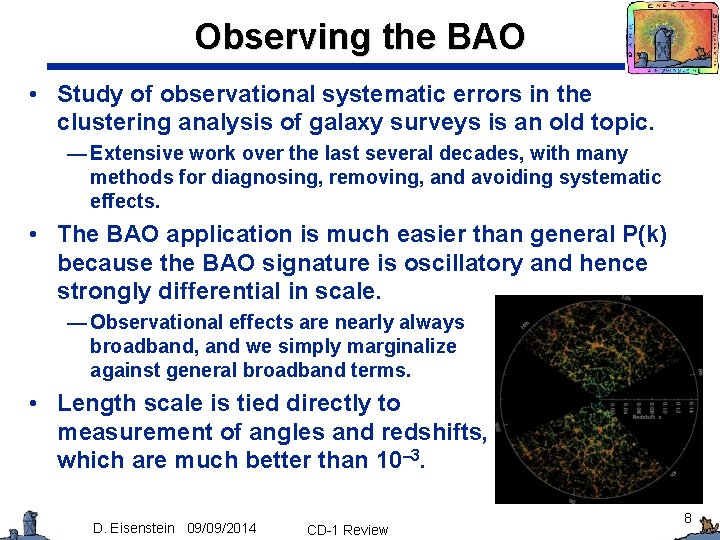
Observing the BAO • Study of observational systematic errors in the clustering analysis of galaxy surveys is an old topic. — Extensive work over the last several decades, with many methods for diagnosing, removing, and avoiding systematic effects. • The BAO application is much easier than general P(k) because the BAO signature is oscillatory and hence strongly differential in scale. — Observational effects are nearly always broadband, and we simply marginalize against general broadband terms. • Length scale is tied directly to measurement of angles and redshifts, which are much better than 10– 3. D. Eisenstein 09/09/2014 CD-1 Review 8
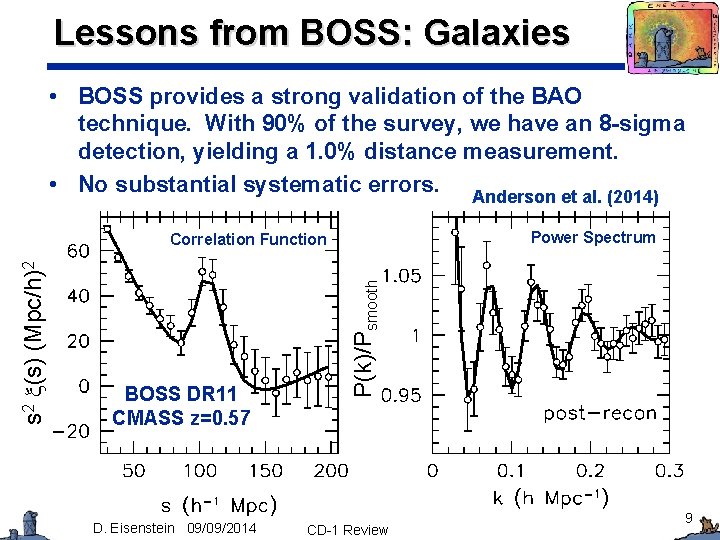
Lessons from BOSS: Galaxies • BOSS provides a strong validation of the BAO technique. With 90% of the survey, we have an 8 -sigma detection, yielding a 1. 0% distance measurement. • No substantial systematic errors. Anderson et al. (2014) Power Spectrum BOSS DR 11 CMASS z=0. 57 D. Eisenstein 09/09/2014 P(k)/Psmooth s 2 x(s) (Mpc/h)2 Correlation Function CD-1 Review 9
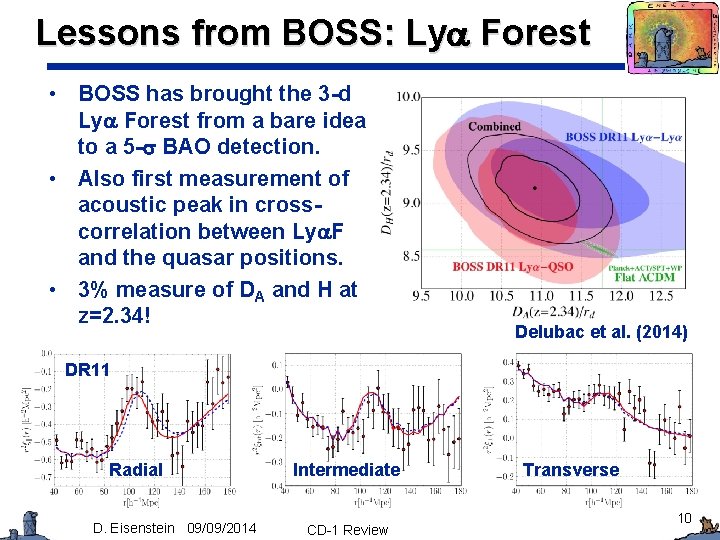
Lessons from BOSS: Lya Forest • BOSS has brought the 3 -d Lya Forest from a bare idea to a 5 -s BAO detection. • Also first measurement of acoustic peak in crosscorrelation between Lya. F and the quasar positions. • 3% measure of DA and H at z=2. 34! Delubac et al. (2014) DR 11 Radial D. Eisenstein 09/09/2014 Intermediate CD-1 Review Transverse 10
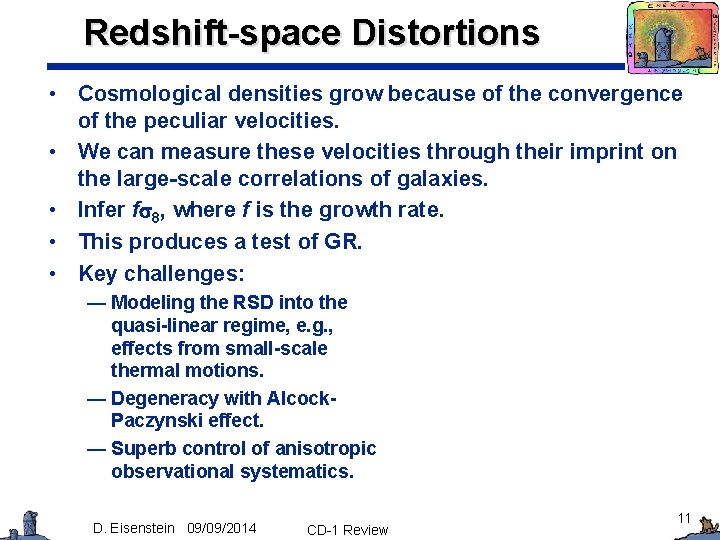
Redshift-space Distortions • Cosmological densities grow because of the convergence of the peculiar velocities. • We can measure these velocities through their imprint on the large-scale correlations of galaxies. • Infer fs 8, where f is the growth rate. • This produces a test of GR. • Key challenges: — Modeling the RSD into the quasi-linear regime, e. g. , effects from small-scale thermal motions. — Degeneracy with Alcock. Paczynski effect. — Superb control of anisotropic observational systematics. D. Eisenstein 09/09/2014 CD-1 Review 11
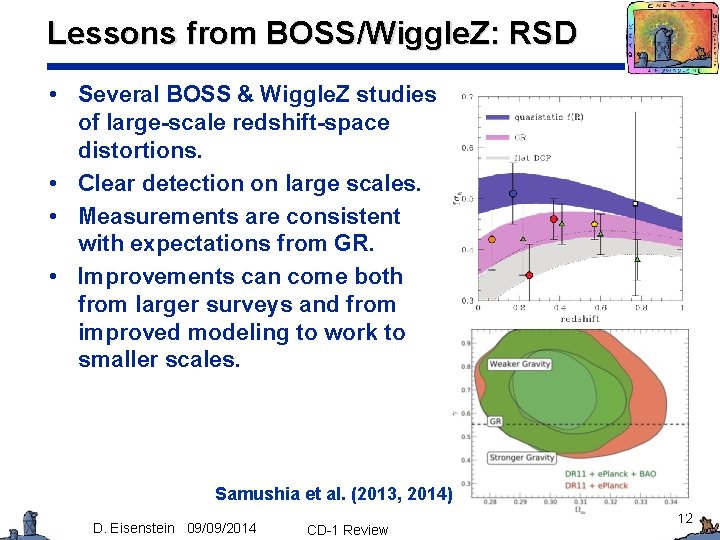
Lessons from BOSS/Wiggle. Z: RSD • Several BOSS & Wiggle. Z studies of large-scale redshift-space distortions. • Clear detection on large scales. • Measurements are consistent with expectations from GR. • Improvements can come both from larger surveys and from improved modeling to work to smaller scales. Samushia et al. (2013, 2014) D. Eisenstein 09/09/2014 CD-1 Review 12
DESI L 1 Requirements • DESI L 1 Requirements focus only on BAO. • L 1. 1: The DESI survey shall cover at least 9000 deg 2. The baseline survey with margin covers 14, 000 deg 2. — BAO needs a wide survey; as we’ll see, going narrow and deeper would be strongly disfavored. • L 1. 2: The DESI galaxy and low-z quasar survey should measure the isotropic cosmic distance scale R(z) from the BAO method to 0. 28% precision (0. 22% for baseline) aggregated over the redshift bin 0. 0 < z < 1. 1 and to 0. 39% (0. 31%) precision in the redshift bin 1. 1 < z < 1. 9. — This is the basic galaxy/quasar BAO requirement. We want to assure high precision over a wide redshift range, without allowing us to optimize simply for the easiest (lowest) redshift. — Must meet the Stage IV threshold. — Precisions are approaching the cosmic variance limit, which would be 0. 1% in 0. 6<z<1. 1 and 1. 1<z<1. 4 (full-sky, no shot noise). D. Eisenstein 09/09/2014 CD-1 Review 13
DESI L 1 Requirements • L 1. 3: DESI will measure the Hubble parameter at 1. 9 < z < 3. 7 from the BAO method to 1. 05% (0. 84% for baseline survey). — This is the basic Lya forest requirement. Want to detect a constant dark energy density at these redshifts, as this excludes w<<-1 models. This provides a 2. 5 s (3. 5 s) detection of L at z ~ 2. 5. • L 1. 4: The galaxy survey at z < 1. 5 shall be capable of separately determining DA(z) and H(z) from the BAO without instrumental and survey uncertainties degrading the performance available from the sky. In particular, the systematic errors from the instrument and observational methods must not exceed 0. 16% for DA and 0. 26% for H. — This is our statement of limits on systematic errors for the galaxy clustering analysis. Would keep us statistics-limited, degrading the aggregate rms precisions by only 10%. • RSD and other cosmology analysis are not explicitly required, but will be permitted by the L 1 BAO requirements. D. Eisenstein 09/09/2014 CD-1 Review 14
Why This Survey Size? • DESI will be a substantial step forward in precision. — 10 -fold more inverse variance on total R than BOSS. — Stage IV Experiment. • DESI is close to the ultimate “easy” ground-based optical BAO experiment. — Galaxies get substantially harder beyond z~1. 5 (atmosphere, silicon detectors). — DESI is surveying a large part of the sky with S/N>1 per mode at these redshifts; can’t do much better. • Completing the BAO distance scale at these redshifts is of high value. — Highly complementary to supernovae, which excel at low redshift. — Excellent measurements of H(z) at z~1. D. Eisenstein 09/09/2014 CD-1 Review 15
Forecasts and Fo. M • We have produced forecasts for the cosmological distance scale and then for cosmological parameters. • This allows us to compute the DETF Figure of Merit. • Forecasts involve computing the signal-to-noise as a function of redshift and wavevector, then using Fisher matrices to map the errors on the power spectra to constraints on cosmological parameters. • For BAO, also use the Seo & Eisenstein (2007) forecasts, which are based on the same concepts. • Assuming reconstruction decreases non-linearity by 50%, a common choice and similar to current algorithmic performance. D. Eisenstein 09/09/2014 CD-1 Review 16
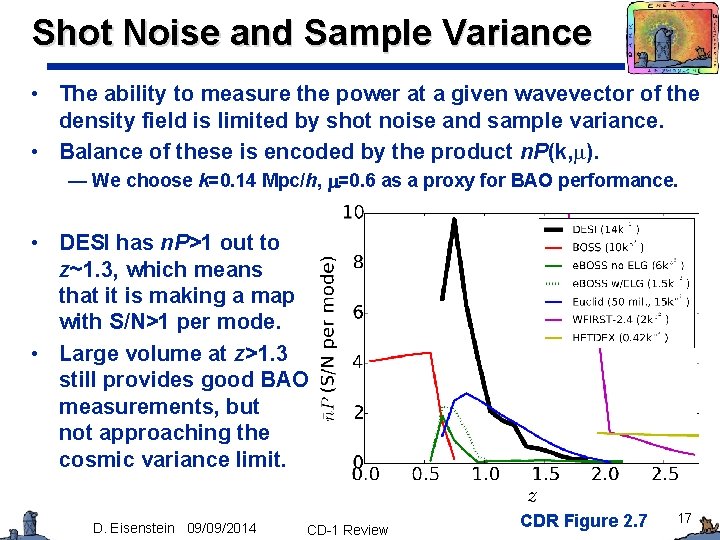
Shot Noise and Sample Variance • The ability to measure the power at a given wavevector of the density field is limited by shot noise and sample variance. • Balance of these is encoded by the product n. P(k, m). — We choose k=0. 14 Mpc/h, m=0. 6 as a proxy for BAO performance. • DESI has n. P>1 out to z~1. 3, which means that it is making a map with S/N>1 per mode. • Large volume at z>1. 3 still provides good BAO measurements, but not approaching the cosmic variance limit. D. Eisenstein 09/09/2014 CD-1 Review CDR Figure 2. 7 17
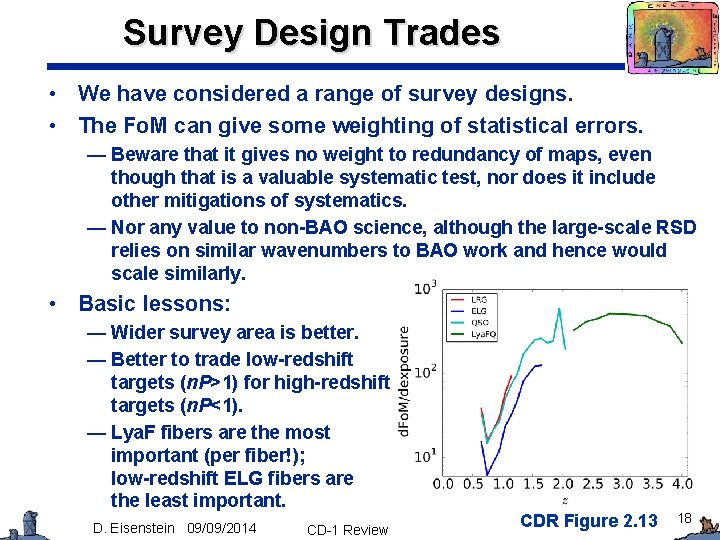
Survey Design Trades • We have considered a range of survey designs. • The Fo. M can give some weighting of statistical errors. — Beware that it gives no weight to redundancy of maps, even though that is a valuable systematic test, nor does it include other mitigations of systematics. — Nor any value to non-BAO science, although the large-scale RSD relies on similar wavenumbers to BAO work and hence would scale similarly. • Basic lessons: — Wider survey area is better. — Better to trade low-redshift targets (n. P>1) for high-redshift targets (n. P<1). — Lya. F fibers are the most important (per fiber!); low-redshift ELG fibers are the least important. D. Eisenstein 09/09/2014 CD-1 Review CDR Figure 2. 13 18
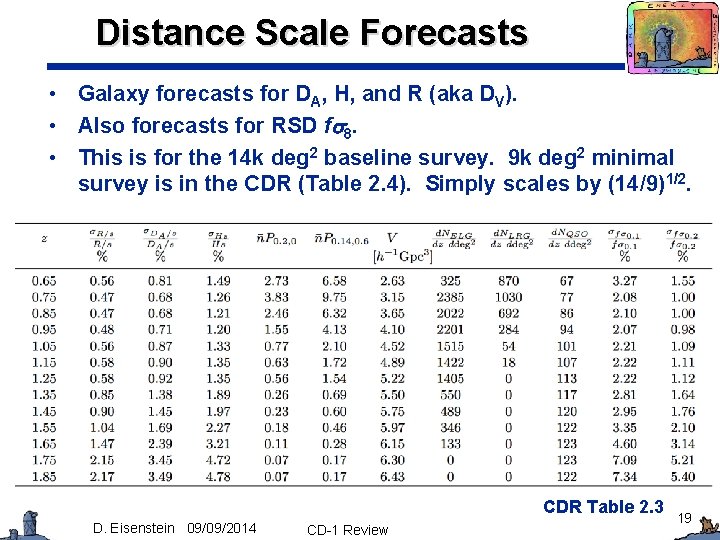
Distance Scale Forecasts • Galaxy forecasts for DA, H, and R (aka DV). • Also forecasts for RSD fs 8. • This is for the 14 k deg 2 baseline survey. 9 k deg 2 minimal survey is in the CDR (Table 2. 4). Simply scales by (14/9)1/2. CDR Table 2. 3 D. Eisenstein 09/09/2014 CD-1 Review 19
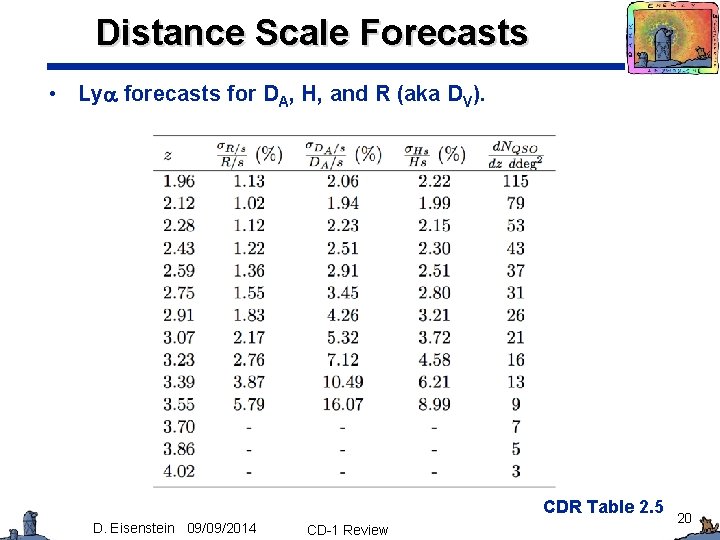
Distance Scale Forecasts • Lya forecasts for DA, H, and R (aka DV). CDR Table 2. 5 D. Eisenstein 09/09/2014 CD-1 Review 20
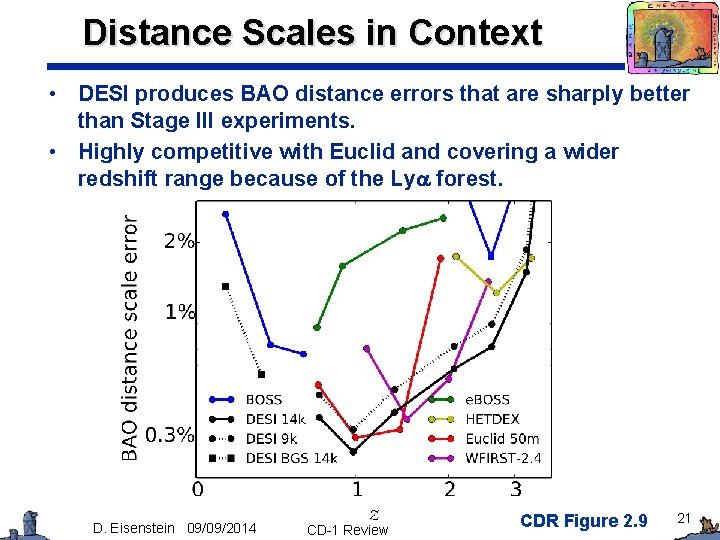
Distance Scales in Context • DESI produces BAO distance errors that are sharply better than Stage III experiments. • Highly competitive with Euclid and covering a wider redshift range because of the Lya forest. D. Eisenstein 09/09/2014 CD-1 Review CDR Figure 2. 9 21
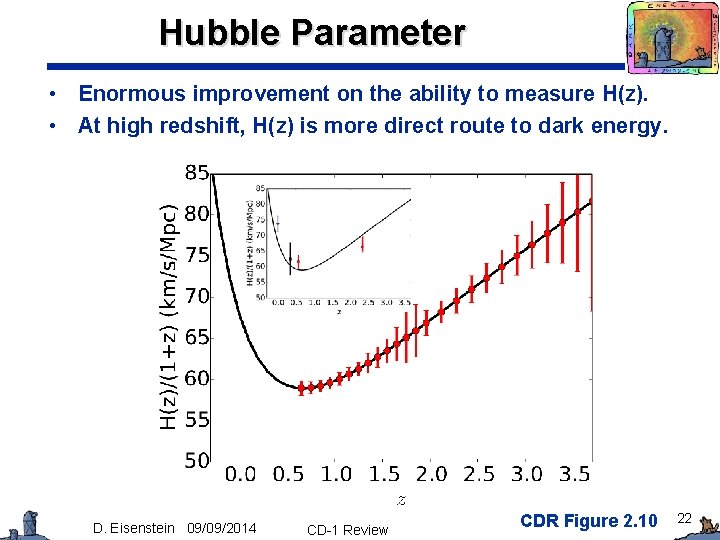
Hubble Parameter • Enormous improvement on the ability to measure H(z). • At high redshift, H(z) is more direct route to dark energy. D. Eisenstein 09/09/2014 CD-1 Review CDR Figure 2. 10 22
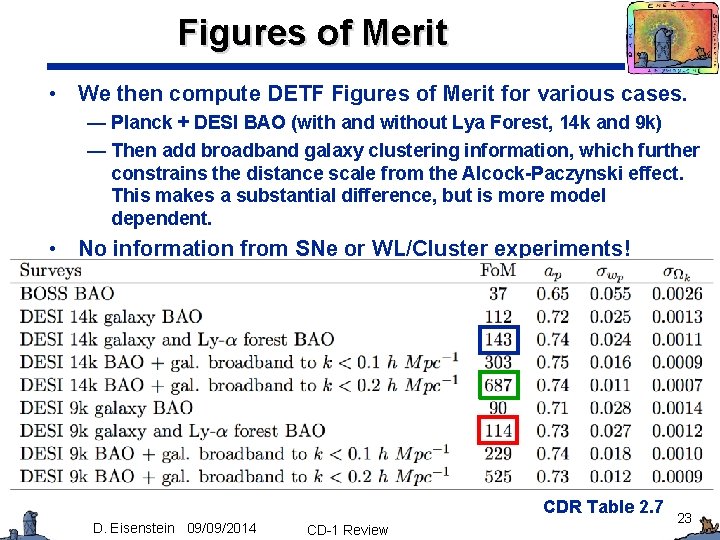
Figures of Merit • We then compute DETF Figures of Merit for various cases. — Planck + DESI BAO (with and without Lya Forest, 14 k and 9 k) — Then add broadband galaxy clustering information, which further constrains the distance scale from the Alcock-Paczynski effect. This makes a substantial difference, but is more model dependent. • No information from SNe or WL/Cluster experiments! CDR Table 2. 7 D. Eisenstein 09/09/2014 CD-1 Review 23
DESI is a Stage IV Experiment • DESI will produce a rich data set, with numerous routes to cosmological information. • However, we want to demonstrate that even the more conservative analysis choice, namely BAO only, satisfies the Stage IV threshold. • It does: Fo. M of 114 for the 9 k deg 2 minimal survey, compared to the Stage IV threshold of 110. — Stage IV is 10 x Stage II, which is taken to be Fo. M=11 from Sullivan et al. (2011). Same as LSST review standard. — Note that DESI Fo. M neglects even current SNe and WL/Cluster constraints, whereas the Stage II analysis was CMB+SN+BAO. — BAO and CMB rely on the same physics, providing one common basis for the distance scale. • When combined with other techniques internal to DESI and/or external measures of dark energy, the Fo. M would be much higher. D. Eisenstein 09/09/2014 CD-1 Review 24
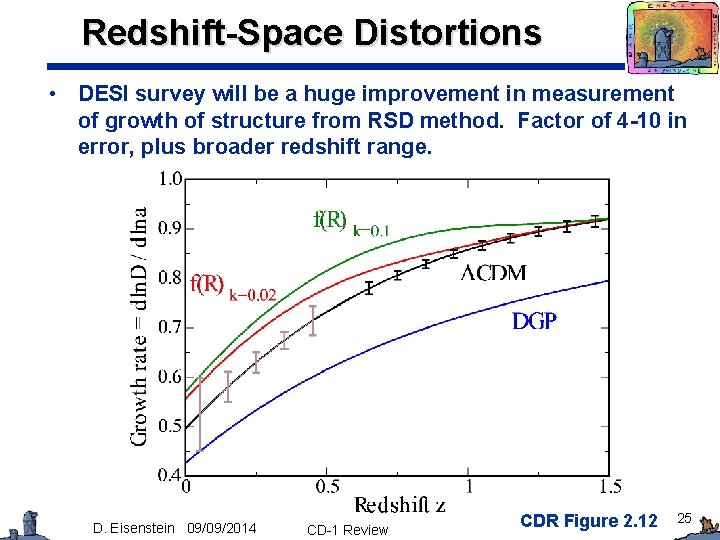
Redshift-Space Distortions • DESI survey will be a huge improvement in measurement of growth of structure from RSD method. Factor of 4 -10 in error, plus broader redshift range. D. Eisenstein 09/09/2014 CD-1 Review CDR Figure 2. 12 25
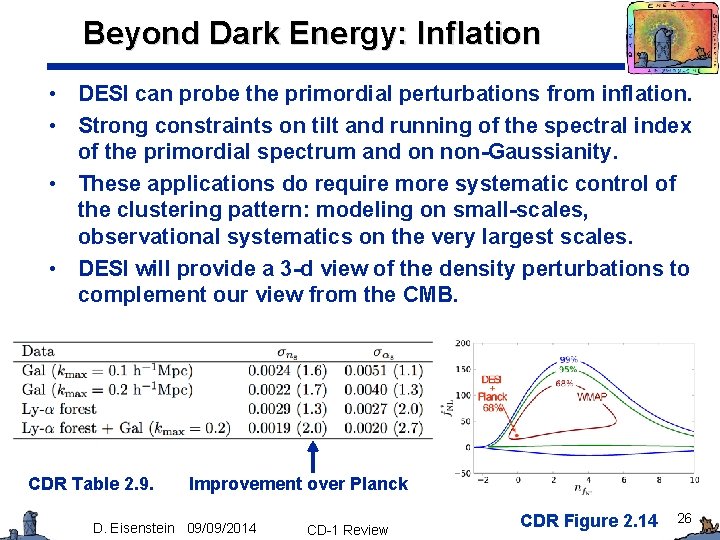
Beyond Dark Energy: Inflation • DESI can probe the primordial perturbations from inflation. • Strong constraints on tilt and running of the spectral index of the primordial spectrum and on non-Gaussianity. • These applications do require more systematic control of the clustering pattern: modeling on small-scales, observational systematics on the very largest scales. • DESI will provide a 3 -d view of the density perturbations to complement our view from the CMB. CDR Table 2. 9. Improvement over Planck D. Eisenstein 09/09/2014 CD-1 Review CDR Figure 2. 14 26
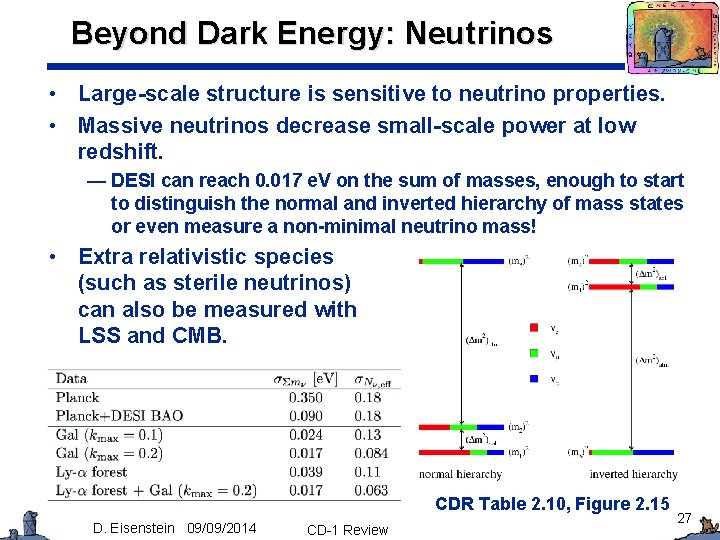
Beyond Dark Energy: Neutrinos • Large-scale structure is sensitive to neutrino properties. • Massive neutrinos decrease small-scale power at low redshift. — DESI can reach 0. 017 e. V on the sum of masses, enough to start to distinguish the normal and inverted hierarchy of mass states or even measure a non-minimal neutrino mass! • Extra relativistic species (such as sterile neutrinos) can also be measured with LSS and CMB. CDR Table 2. 10, Figure 2. 15 D. Eisenstein 09/09/2014 CD-1 Review 27
Bright Galaxy Survey • DESI Science Consortium is designing a survey of bright galaxies to pursue when moon or other observing conditions are too poor to conduct Key Project observations. • A survey of 10 M bright (r<19. 5) galaxies over 14 k-20 k square degrees would have considerable cosmological reach, complementing the Key Project. — Improve z<0. 4 BAO to better than 1%. Fo. M increases from 143 to 176 -194 (depending on BGS area). 23 -36% gain! — Measure the amplitude/growth of structure at low redshift, where dark energy dominates. • Multi-tracer RSD, Cluster/group counts, WL cross-correlations. — Many 10 k of host galaxy redshifts of SN Ia over the next decade. — High sampling density for detailed environment studies and smaller scale modified gravity tests. D. Eisenstein 09/09/2014 CD-1 Review 28
Bright Galaxy Survey • The Bright Galaxy Survey will necessarily have fibers that cannot reach a suitable galaxy. • We will fill these fibers with stars as a survey of chemical and dynamical structure of the Milky Way. — Can reach well beyond the solar neighborhood. Good coverage of the inner halo and thick disk. — Excellent complement to GAIA astrometry. — Can study formation history of the galaxy. — Stellar streams and the dark matter distribution of the Milky Way. • Expect to observe at least 10 M stars down to V=18. — Can acquire S/N=20 spectra, superb for radial velocities and metallicities. • The combination of a comprehensive bright galaxy program and an extensive stellar program should be very enticing to increase the Collaboration membership. D. Eisenstein 09/09/2014 CD-1 Review 29
Science Alternatives Study • Detailed assessment of possible host 4 m-6 m telescopes. • Study considered many telescopes but converged to Mayall, Blanco, and CFHT as suitable to host DESI (mass and corrector FOV) and possibly available. — Some remaining technical concern about CFHT; DESI might be too heavy and might not fit in the dome. • Imaging requirements seen as feasible for any site. • Overlap of spectroscopy and deep lensing data assessed to be of uncertain value. Some calculations show interesting value; others don’t. • Found that all 3 sites could host DESI if sufficient amounts of dark time were available. — Detailed performance comparison suggests that CFHT would be 44% faster than Mayall, CTIO 17% faster than Mayall. • Concluded that Mayall & Blanco are feasible; CFHT might be. Subsequently, agencies indicated Mayall. 30 D. Eisenstein 09/09/2014 CD-1 Review
DESI Science Collaboration • The DESI Science Collaboration is being formed. — International scope, expecting several dozen institutions. • Participants contribute $200 K each of cash or in-kind project work, usually via an MOU. — DOE funding typically results in in-kind credit. — For Universities, contributions capped at $950 K of non-DOE funds. — All participants expected to contribute on-going effort toward the common good of DESI collaboration. • 8 Working Groups established, more to follow as needed. • Publication policy in early draft. • Looking toward assuring science readiness, using data challenges and BOSS/e. BOSS data sets. • Science Collaboration also eager to use the imaging data sets that are being collected for target selection. D. Eisenstein 09/09/2014 CD-1 Review 31
Conclusions • The BAO is now a • DESI will be a large step mature method forward in BAO statistical measuring the cosmic precision and redshift distance scale. coverage. — Secure (8 s) detection in BOSS DR 11. — Extensive testing in simulations and analytic theory. — Systematic errors well below statistical errors for BOSS. Good path to meeting the DESI requirements. D. Eisenstein 09/09/2014 — Will essentially complete our mapping of the BAO out to z~1. 5. — Continues measurements to z~3. 5 with galaxies, quasars, and the Lyman a forest. • DESI reaches the Stage IV threshold even in the 9000 deg 2 BAO-only limit. — Additional analyses and external data sets will boost Fo. M further. CD-1 Review 32
Conclusions • Same instrument and data set is well matched for RSD measurements of dark energy and tests of inflation and neutrino mass. • Bright Galaxy Survey in bright conditions would further extend these science ambitions, improve Fo. M by 23 -36%. — We welcome advice from the committee about extending the science case to include the BGS. • DESI Science Alternatives Analysis found that the Mayall and Blanco could both host DESI successfully if sufficient dark time is available. — CFHT might also be viable, but some technical concerns remain. • DESI Science Collaboration has been launched! • DESI will be a world-leading survey for the BAO and dark energy! D. Eisenstein 09/09/2014 CD-1 Review 33
D. Eisenstein 09/09/2014 CD-1 Review 34
- Slides: 34