
Breaking of Chopstick Failure Buildup of stress strain
Breaking of Chopstick ・ ・ ・ Failure Build-up of stress (strain energy) Difficult to predict time and place Breaks at weakest point Hear precursors Sound of breaking same as seismic waves
Sources of Tsunami Sudden submarine topographic change ・Crustal deformation by earthquake. ・Submarine volcanic eruption. ・Landslide near coastline or submarine landslide.
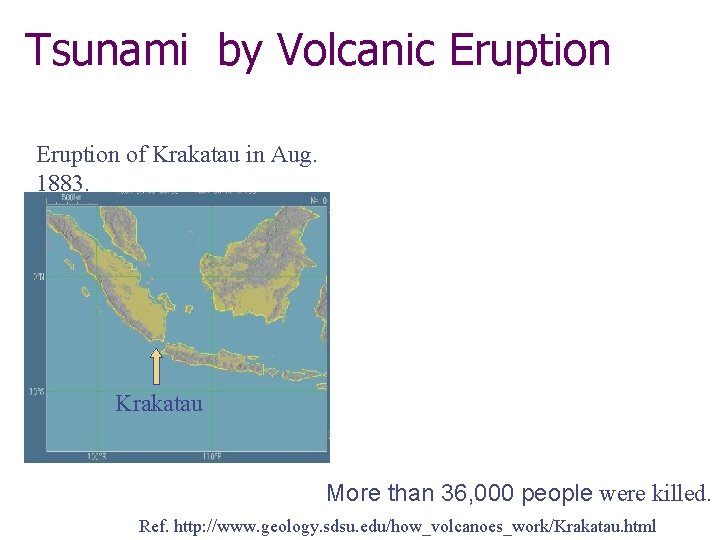
Tsunami by Volcanic Eruption of Krakatau in Aug. 1883. Krakatau More than 36, 000 people were killed. Ref. http: //www. geology. sdsu. edu/how_volcanoes_work/Krakatau. html
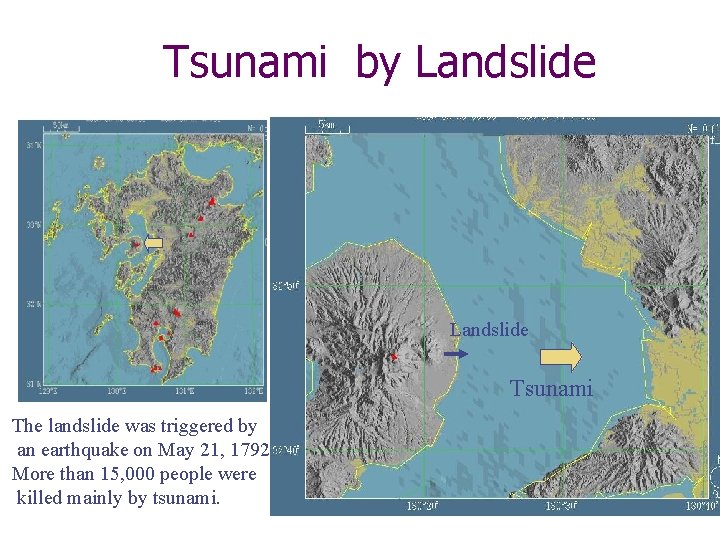
Tsunami by Landslide Tsunami The landslide was triggered by an earthquake on May 21, 1792. More than 15, 000 people were killed mainly by tsunami.
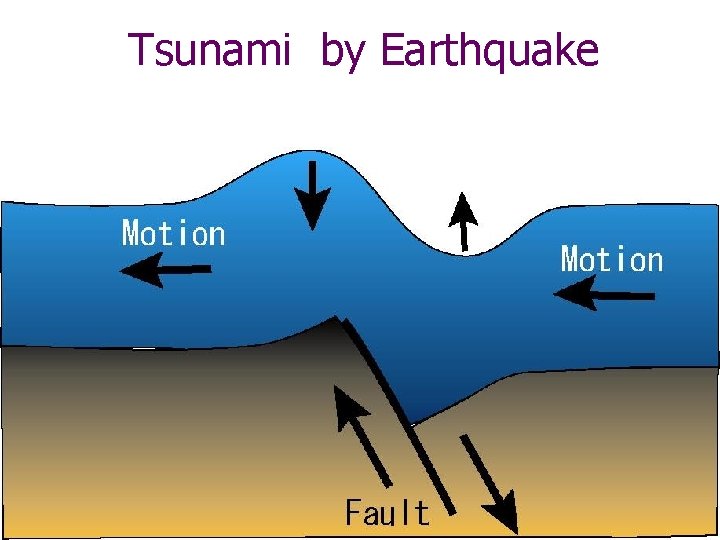
Tsunami by Earthquake
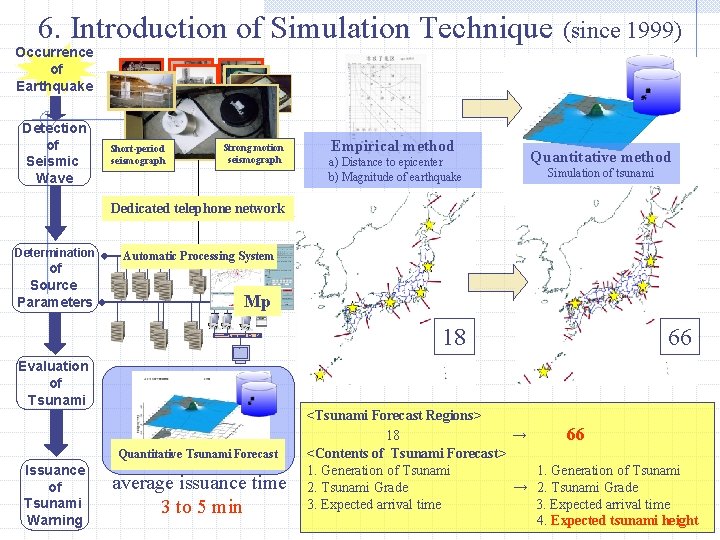
6. Introduction of Simulation Technique (since 1999) Occurrence of Earthquake Detection of Seismic Wave Short-period seismograph Strong motion seismograph Empirical method a) Distance to epicenter b) Magnitude of earthquake Quantitative method Simulation of tsunami Dedicated telephone network Determination of Source Parameters Evaluation of Tsunami Automatic Processing System Mp ・ ・ Quantitative Tsunami Forecast Issuance of Tsunami Warning average issuance time 3 to 5 min 18 66 <Tsunami Forecast Regions> 18 → 66 <Contents of Tsunami Forecast> 1. Generation of Tsunami 2. Tsunami Grade → 2. Tsunami Grade 3. Expected arrival time 4. Expected tsunami height
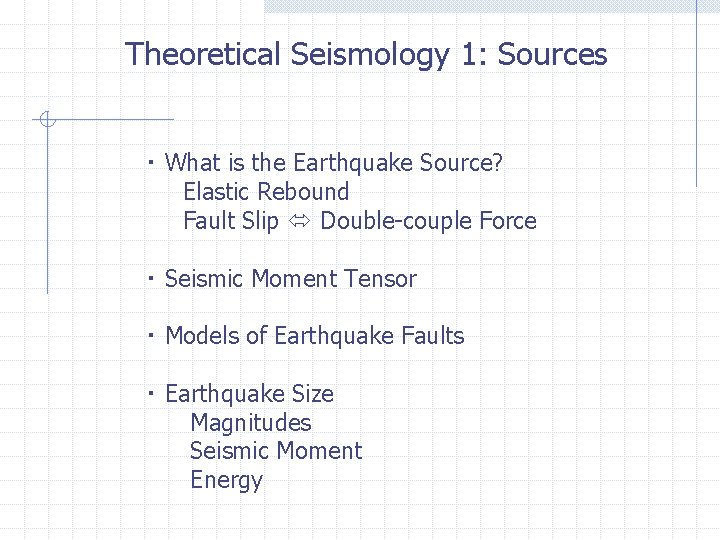
Theoretical Seismology 1: Sources ・ What is the Earthquake Source? Elastic Rebound Fault Slip Double-couple Force ・ Seismic Moment Tensor ・ Models of Earthquake Faults ・ Earthquake Size Magnitudes Seismic Moment Energy
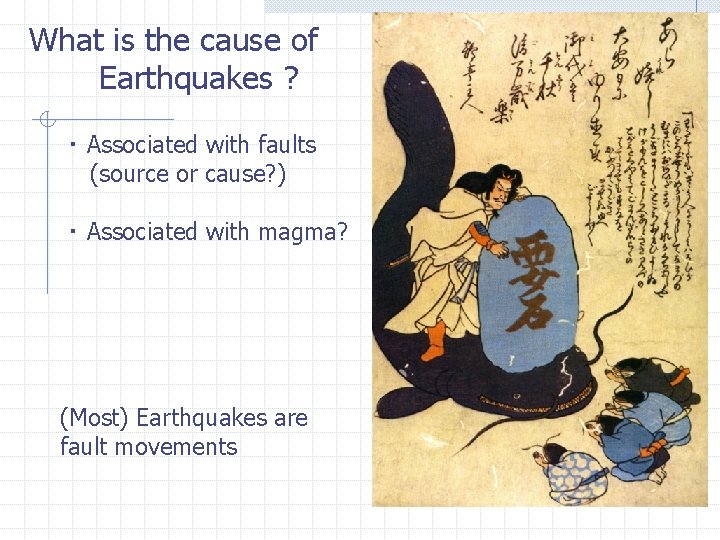
What is the cause of Earthquakes ? ・ Associated with faults (source or cause? ) ・ Associated with magma? (Most) Earthquakes are fault movements
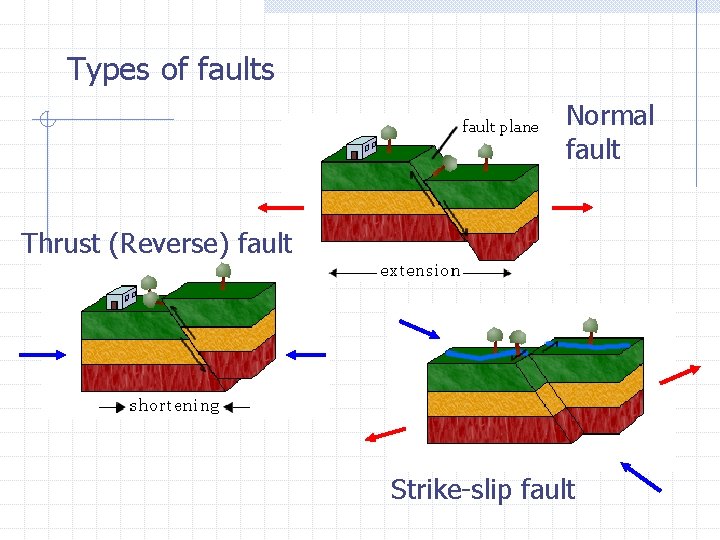
Types of faults Normal fault Thrust (Reverse) fault Strike-slip fault
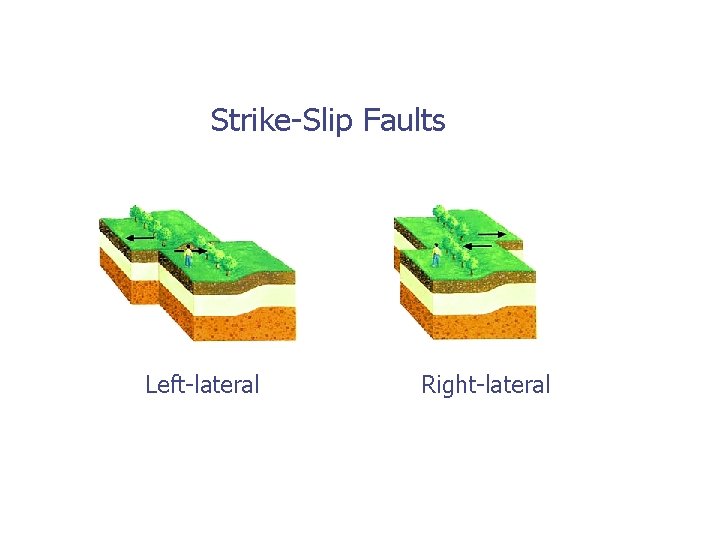
Strike-Slip Faults Left-lateral Right-lateral
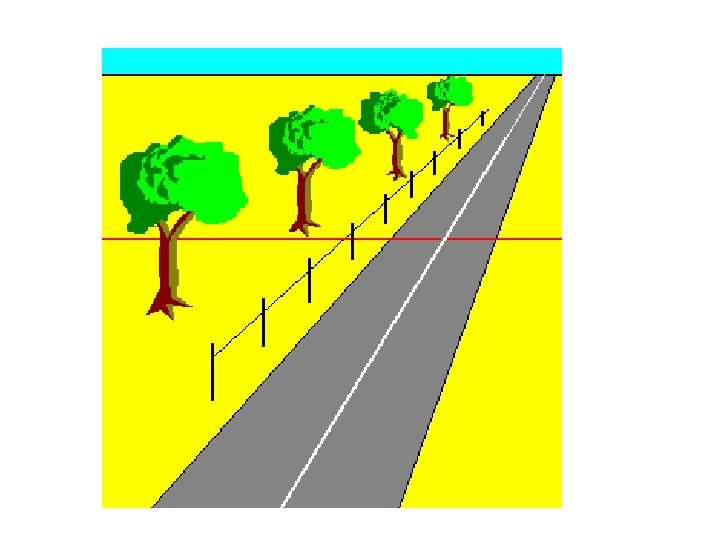
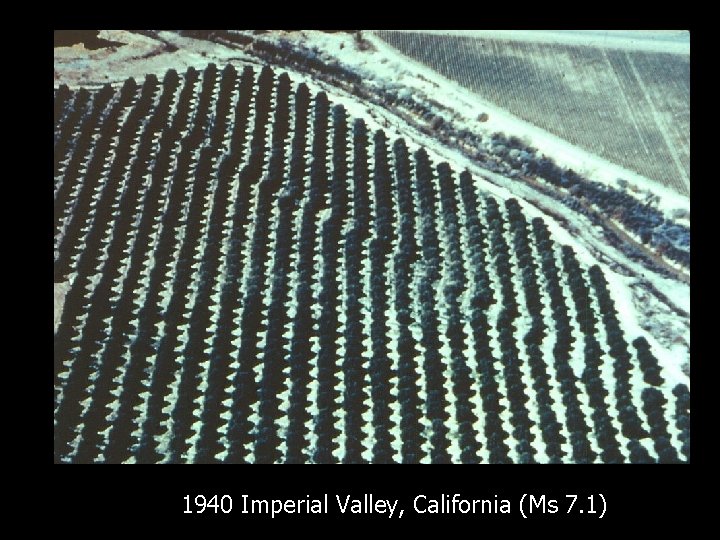
1940 Imperial Valley, California (Ms 7. 1)
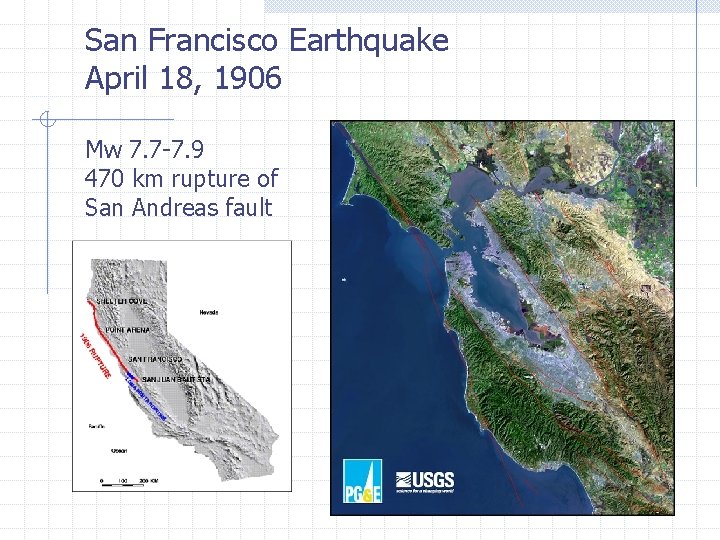
San Francisco Earthquake April 18, 1906 Mw 7. 7 -7. 9 470 km rupture of San Andreas fault
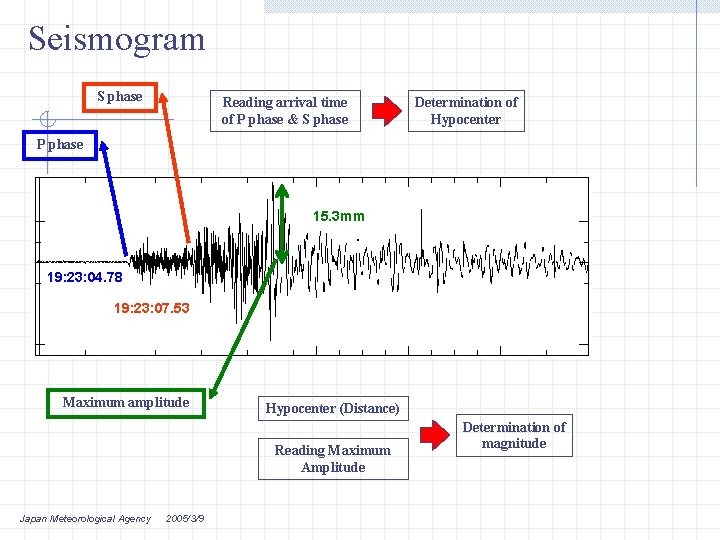
Seismogram S phase Reading arrival time of P phase & S phase Determination of Hypocenter P phase 15. 3 mm 19: 23: 04. 78 19: 23: 07. 53 Maximum amplitude Hypocenter (Distance) Reading Maximum Amplitude Japan Meteorological Agency 2005/3/9 Determination of magnitude
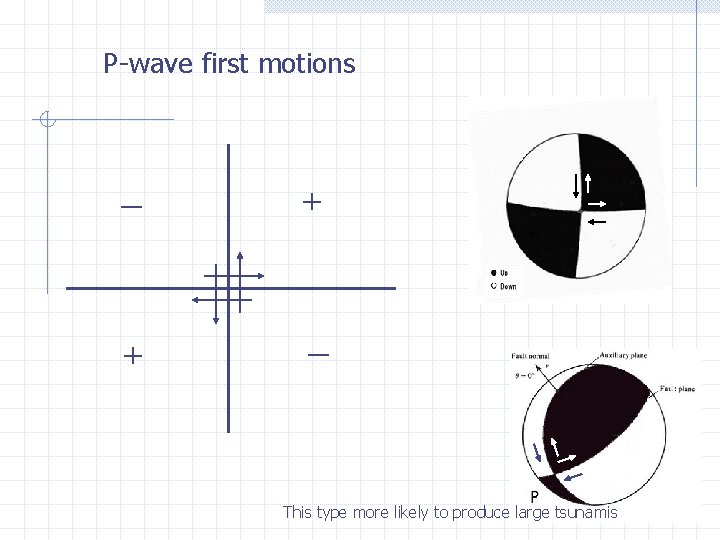
P-wave first motions ー + + ー This type more likely to produce large tsunamis
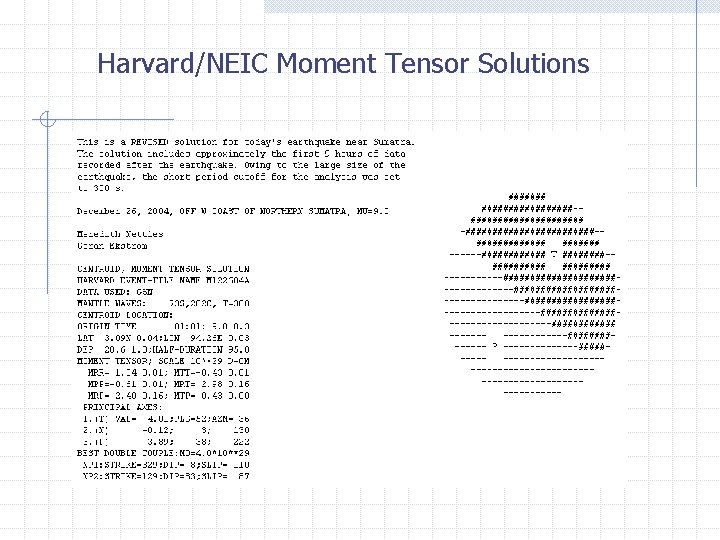
Harvard/NEIC Moment Tensor Solutions
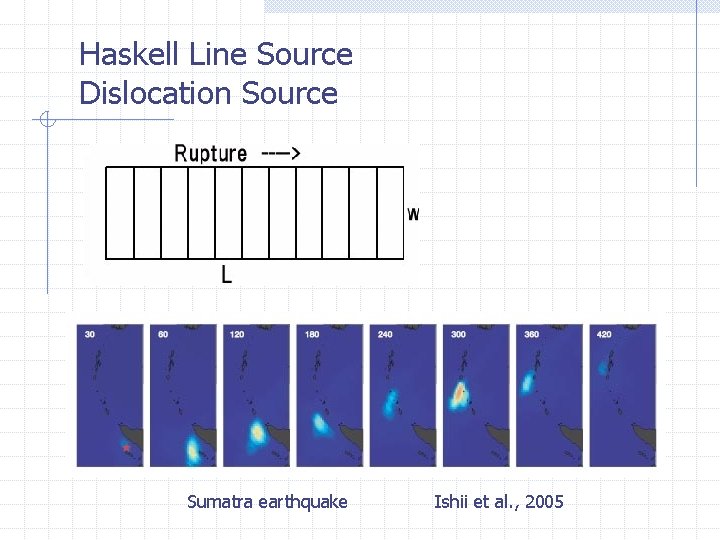
Haskell Line Source Dislocation Source Haskell, 1964 Sumatra earthquake sumatra Ishii et al. , 2005
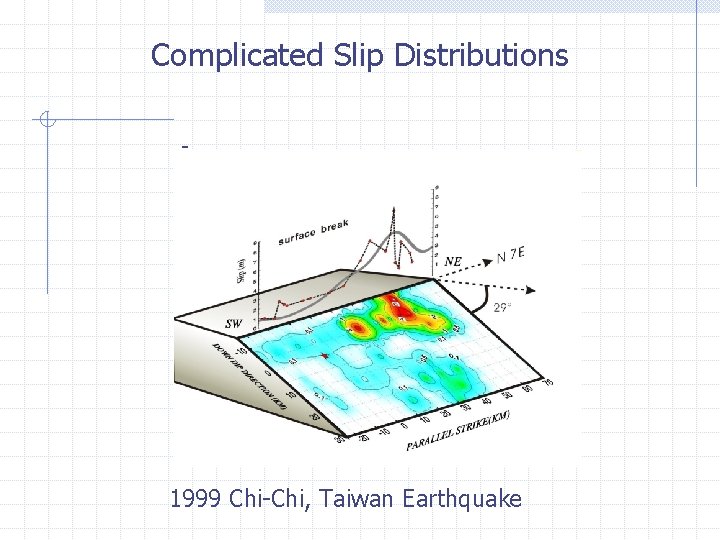
Complicated Slip Distributions - 1999 Chi-Chi, Taiwan Earthquake
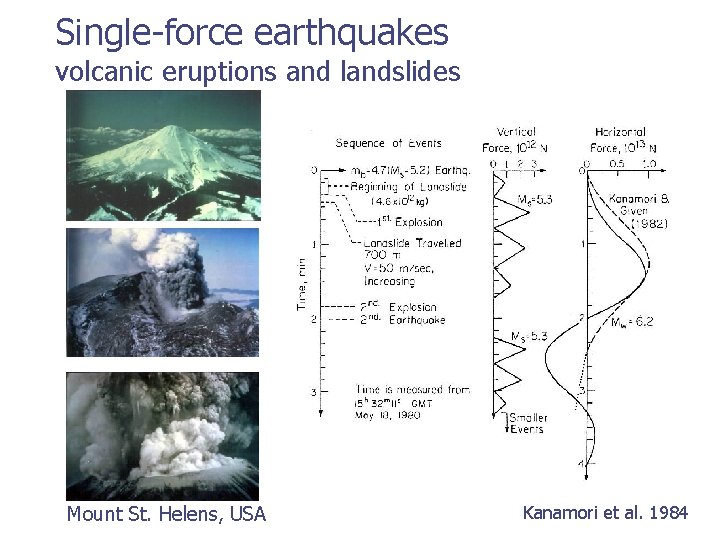
Single-force earthquakes volcanic eruptions and landslides Mount St. Helens, USA Kanamori et al. 1984
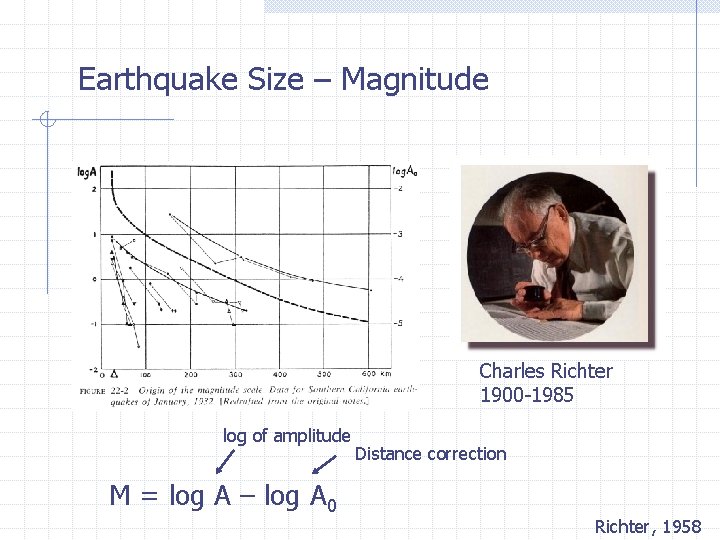
Earthquake Size – Magnitude Charles Richter 1900 -1985 log of amplitude M = log A – log A 0 Distance correction Richter, 1958
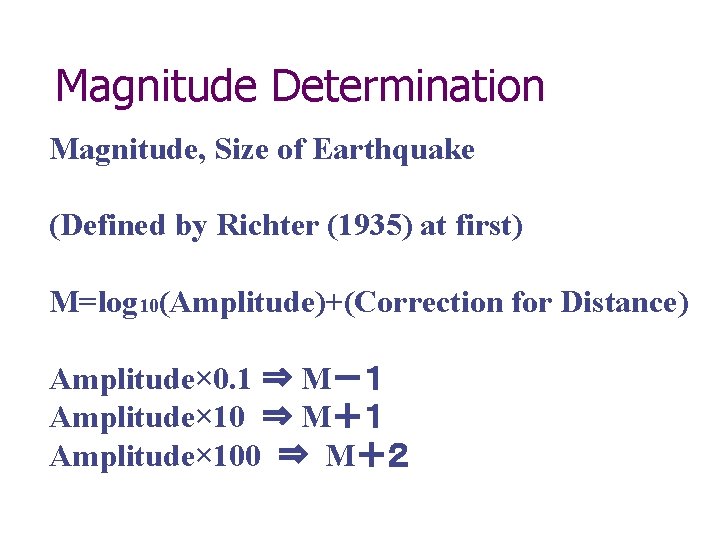
Magnitude Determination Magnitude, Size of Earthquake (Defined by Richter (1935) at first) M=log 10(Amplitude)+(Correction for Distance) Amplitude× 0. 1 ⇒ M-1 Amplitude× 10 ⇒ M+1 Amplitude× 100 ⇒ M+2
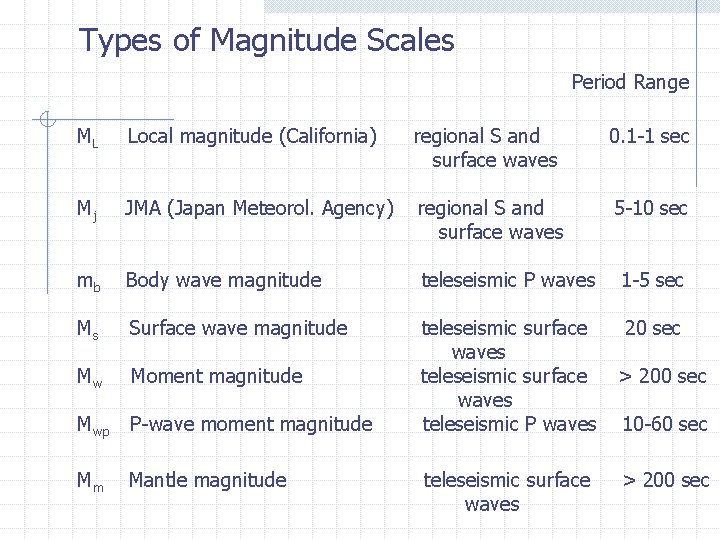
Types of Magnitude Scales Period Range ML Local magnitude (California) regional S and surface waves 0. 1 -1 sec Mj JMA (Japan Meteorol. Agency) regional S and surface waves 5 -10 sec mb Body wave magnitude teleseismic P waves 1 -5 sec Ms Surface wave magnitude 20 sec Mw Moment magnitude Mwp P-wave moment magnitude teleseismic surface waves teleseismic P waves Mm Mantle magnitude teleseismic surface waves > 200 sec 10 -60 sec > 200 sec
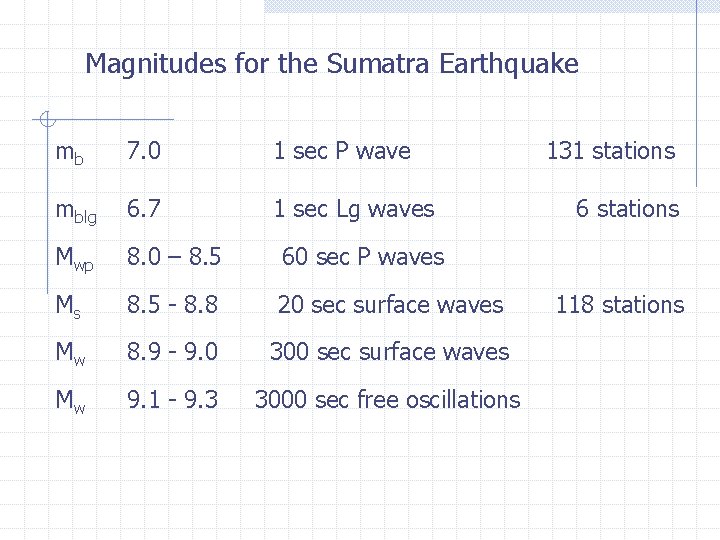
Magnitudes for the Sumatra Earthquake mb 7. 0 1 sec P wave mblg 6. 7 1 sec Lg waves Mwp 8. 0 – 8. 5 60 sec P waves Ms 8. 5 - 8. 8 20 sec surface waves Mw 8. 9 - 9. 0 300 sec surface waves Mw 9. 1 - 9. 3 3000 sec free oscillations 131 stations 6 stations 118 stations
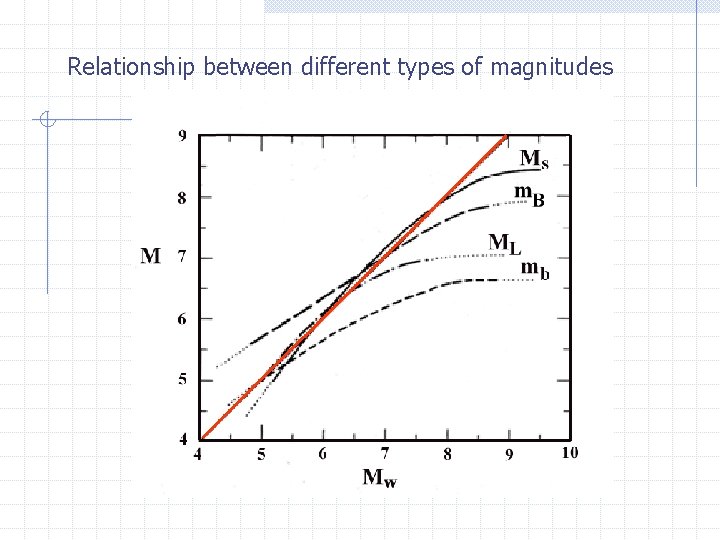
Relationship between different types of magnitudes
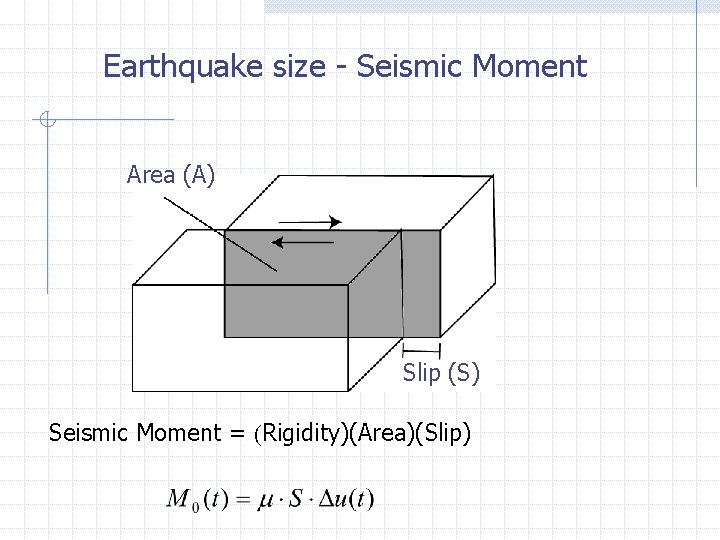
Earthquake size - Seismic Moment Area (A) Slip (S) Seismic Moment = (Rigidity)(Area)(Slip)
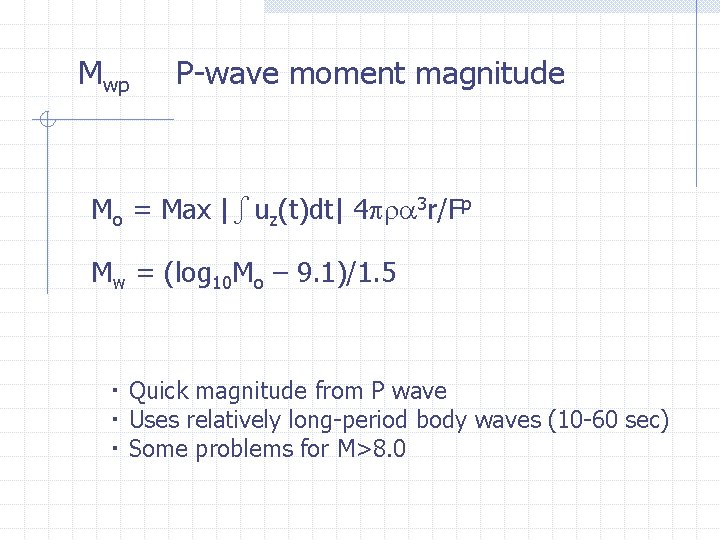
Mwp P-wave moment magnitude Mo = Max |∫uz(t)dt| 4 pra 3 r/Fp Mw = (log 10 Mo – 9. 1)/1. 5 ・ Quick magnitude from P wave ・ Uses relatively long-period body waves (10 -60 sec) ・ Some problems for M>8. 0
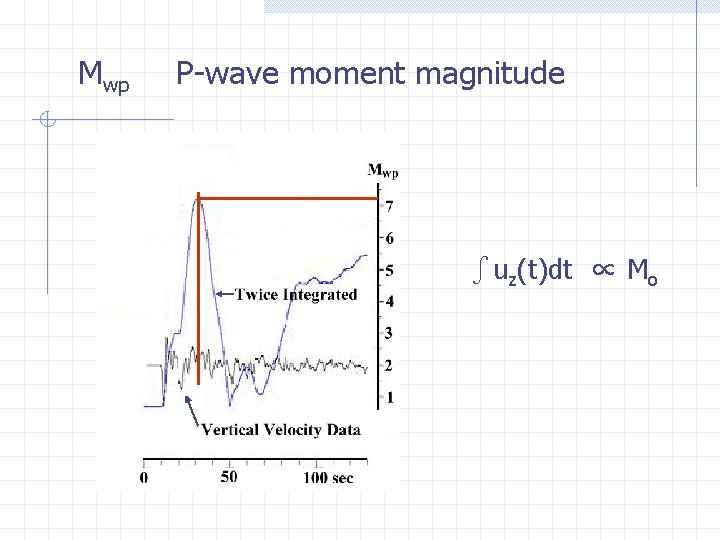
Mwp P-wave moment magnitude ∫uz(t)dt ∝ Mo
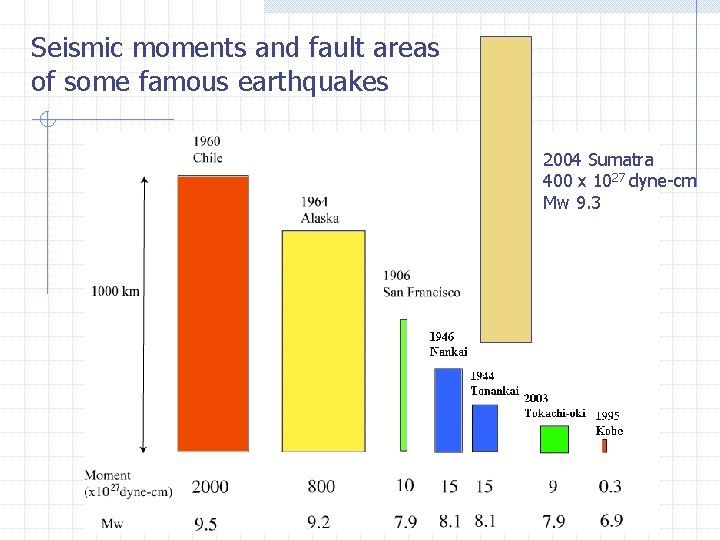
Seismic moments and fault areas of some famous earthquakes 2004 Sumatra 400 x 1027 dyne-cm Mw 9. 3
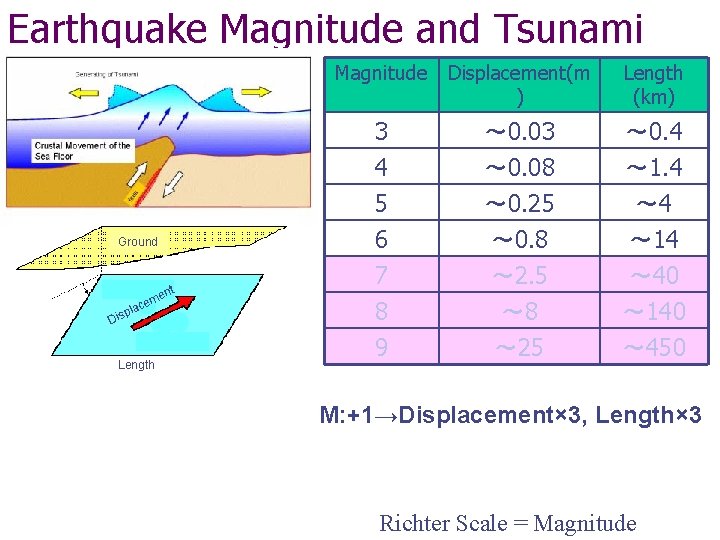
Earthquake Magnitude and Tsunami Ground nt me ace pl Dis Length Magnitude Displacement(m ) Length (km) 3 ~ 0. 03 ~ 0. 4 4 5 6 7 ~ 0. 08 ~ 0. 25 ~ 0. 8 ~ 2. 5 ~ 1. 4 ~ 14 ~ 40 8 9 ~ 8 ~ 25 ~ 140 ~ 450 M: +1→Displacement× 3, Length× 3 Richter Scale = Magnitude
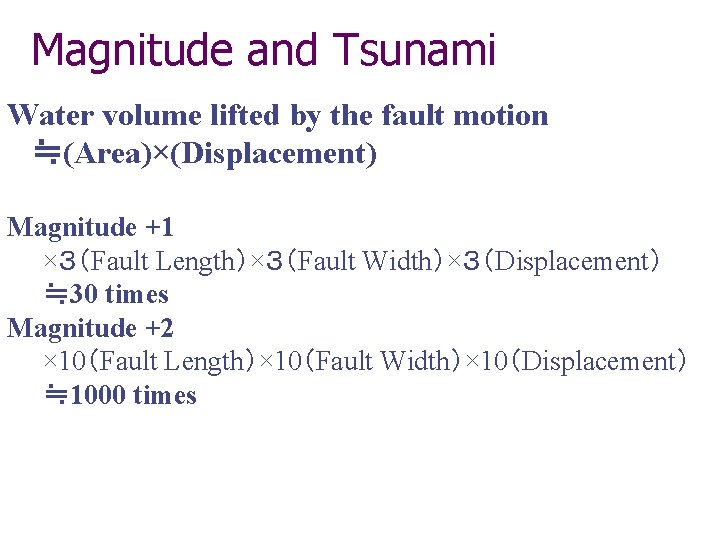
Magnitude and Tsunami Water volume lifted by the fault motion ≒(Area)×(Displacement) Magnitude +1 ×3(Fault Length)×3(Fault Width)×3(Displacement) ≒ 30 times Magnitude +2 × 10(Fault Length)× 10(Fault Width)× 10(Displacement) ≒ 1000 times
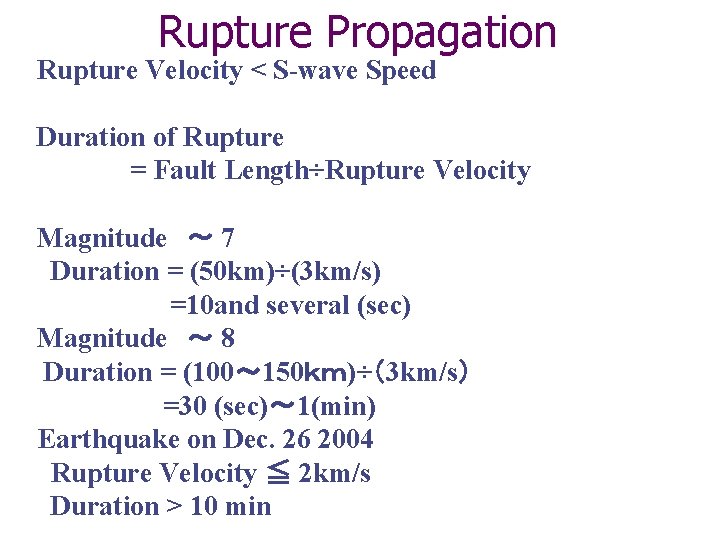
Rupture Propagation Rupture Velocity < S-wave Speed Duration of Rupture = Fault Length÷Rupture Velocity Magnitude ~ 7 Duration = (50 km)÷(3 km/s) =10 and several (sec) Magnitude ~ 8 Duration = (100~ 150km)÷(3 km/s) =30 (sec)~ 1(min) Earthquake on Dec. 26 2004 Rupture Velocity ≦ 2 km/s Duration > 10 min
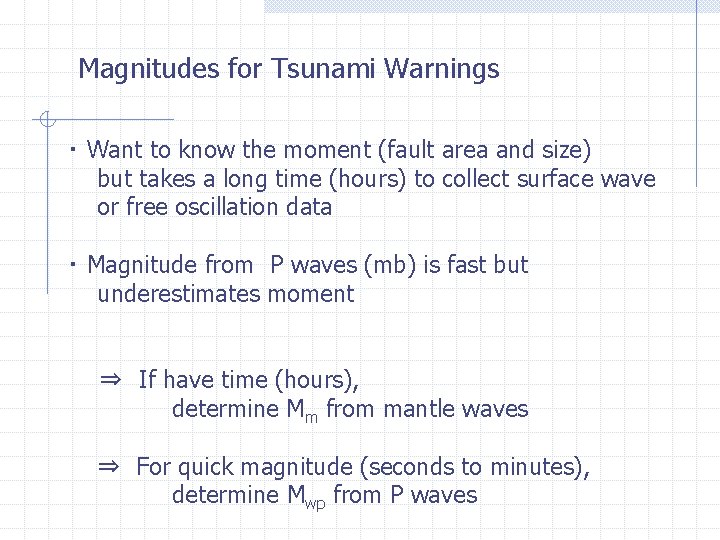
Magnitudes for Tsunami Warnings ・ Want to know the moment (fault area and size) but takes a long time (hours) to collect surface wave or free oscillation data ・ Magnitude from P waves (mb) is fast but underestimates moment ⇒ If have time (hours), determine Mm from mantle waves ⇒ For quick magnitude (seconds to minutes), determine Mwp from P waves
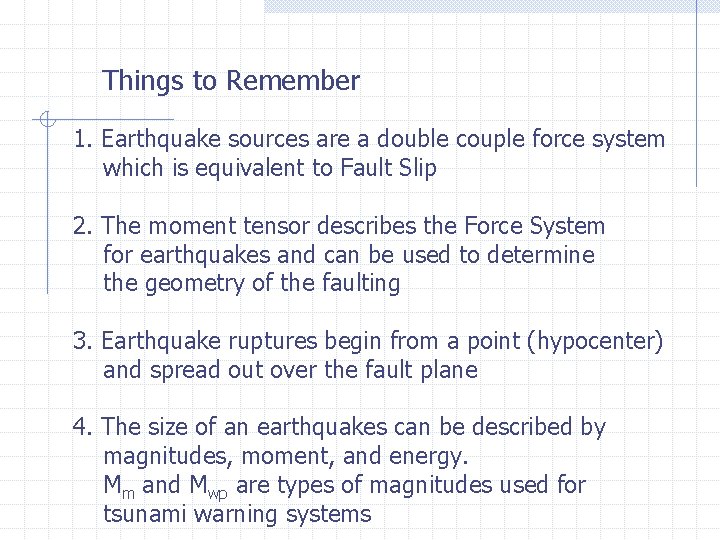
Things to Remember 1. Earthquake sources are a double couple force system which is equivalent to Fault Slip 2. The moment tensor describes the Force System for earthquakes and can be used to determine the geometry of the faulting 3. Earthquake ruptures begin from a point (hypocenter) and spread out over the fault plane 4. The size of an earthquakes can be described by magnitudes, moment, and energy. Mm and Mwp are types of magnitudes used for tsunami warning systems
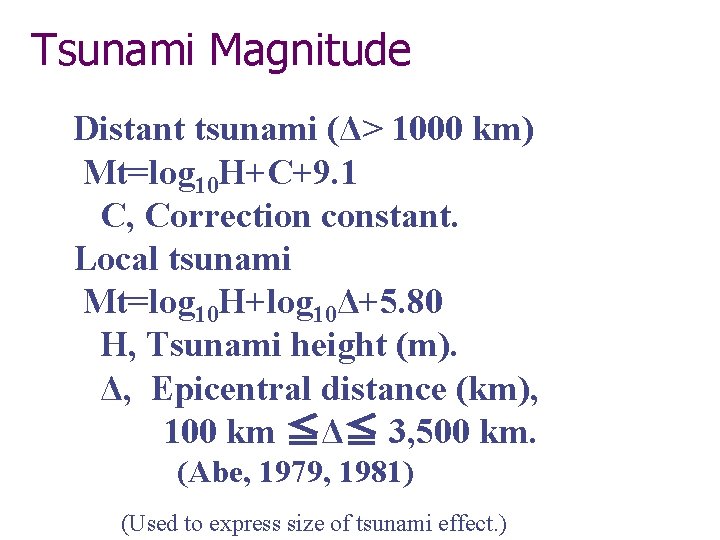
Tsunami Magnitude Distant tsunami (Δ> 1000 km) Mt=log 10 H+C+9. 1 C, Correction constant. Local tsunami Mt=log 10 H+log 10Δ+5. 80 H, Tsunami height (m). Δ, Epicentral distance (km), 100 km ≦Δ≦ 3, 500 km. (Abe, 1979, 1981) (Used to express size of tsunami effect. )

Thank you for your attention
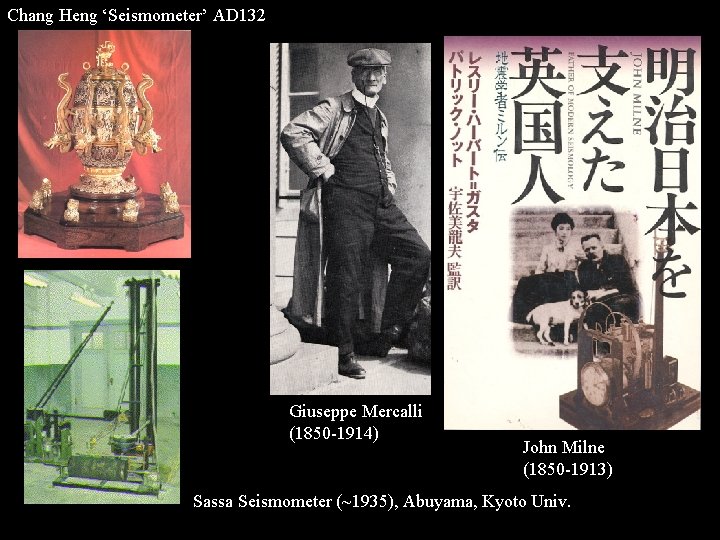
Chang Heng ‘Seismometer’ AD 132 Giuseppe Mercalli (1850 -1914) John Milne (1850 -1913) Sassa Seismometer (~1935), Abuyama, Kyoto Univ.
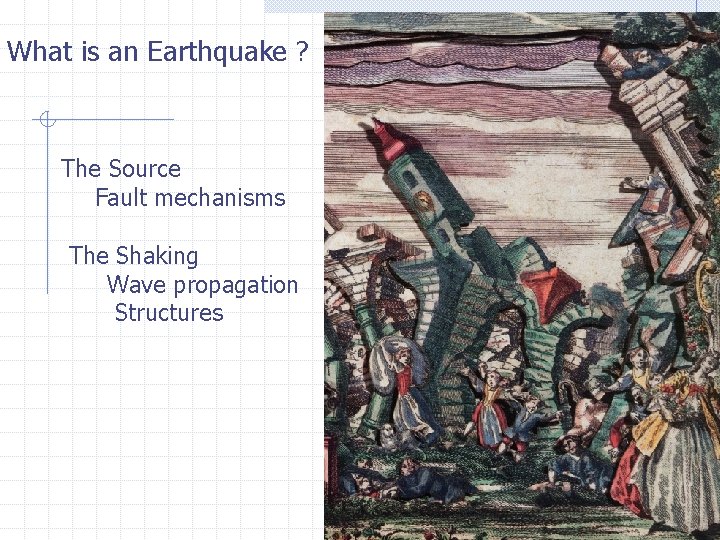
What is an Earthquake ? The Source Fault mechanisms The Shaking Wave propagation Structures
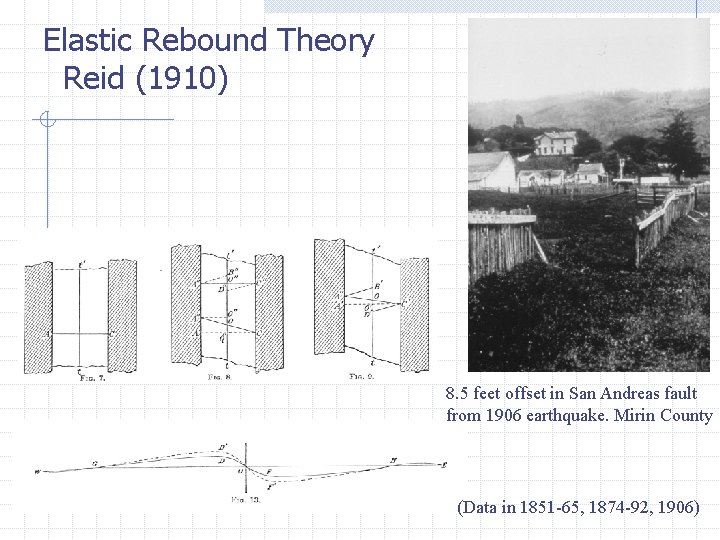
Elastic Rebound Theory Reid (1910) 8. 5 feet offset in San Andreas fault from 1906 earthquake. Mirin County (Data in 1851 -65, 1874 -92, 1906)
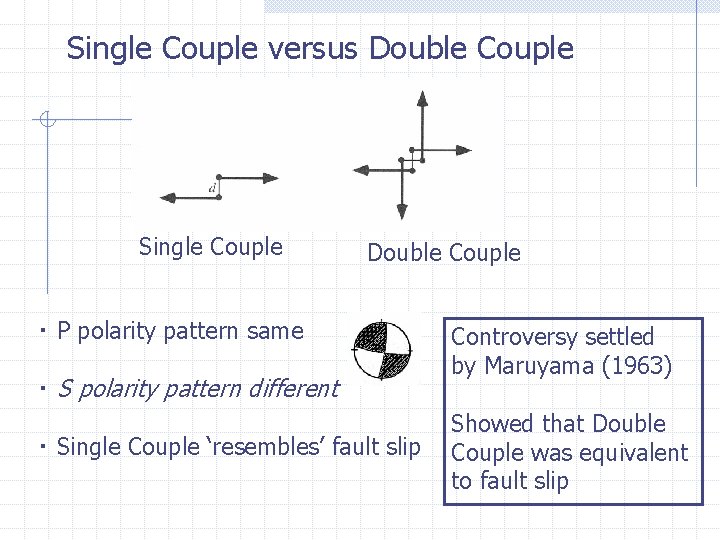
Single Couple versus Double Couple Single Couple Double Couple ・ P polarity pattern same ・ S polarity pattern different ・ Single Couple ‘resembles’ fault slip Controversy settled by Maruyama (1963) Showed that Double Couple was equivalent to fault slip
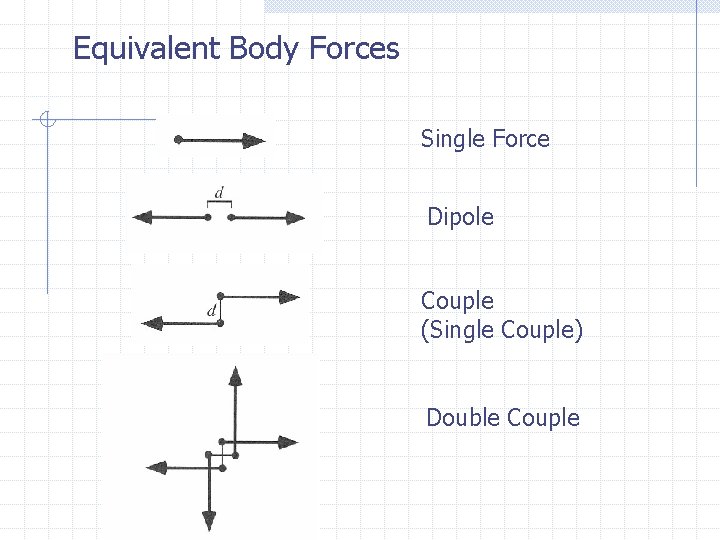
Equivalent Body Forces Single Force Dipole Couple (Single Couple) Double Couple
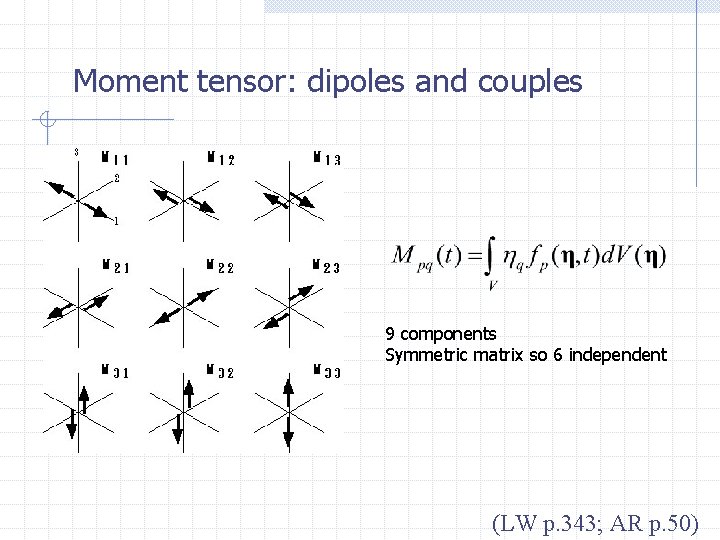
Moment tensor: dipoles and couples 9 components Symmetric matrix so 6 independent (LW p. 343; AR p. 50)
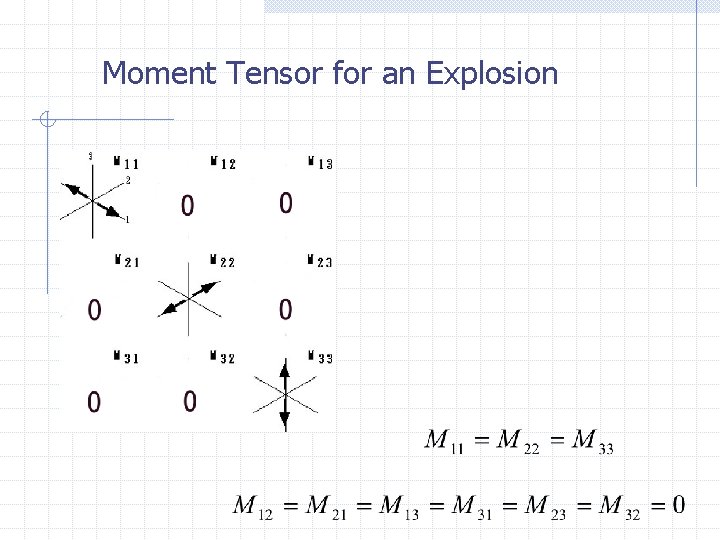
Moment Tensor for an Explosion
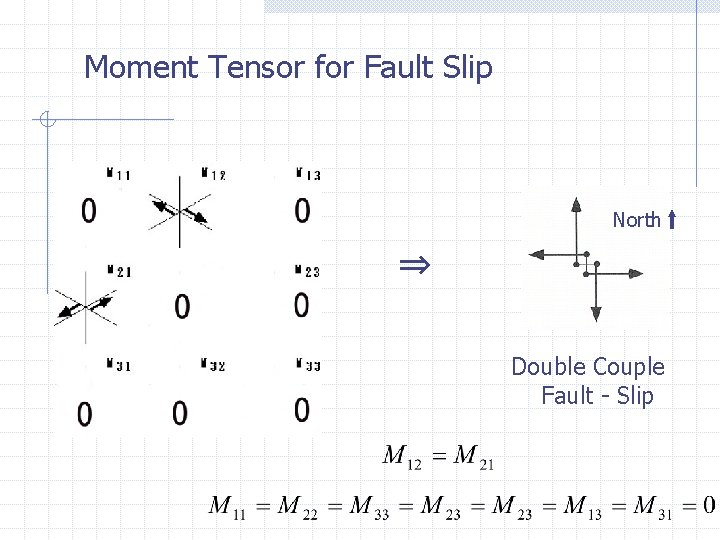
Moment Tensor for Fault Slip North ⇒ Double Couple Fault - Slip
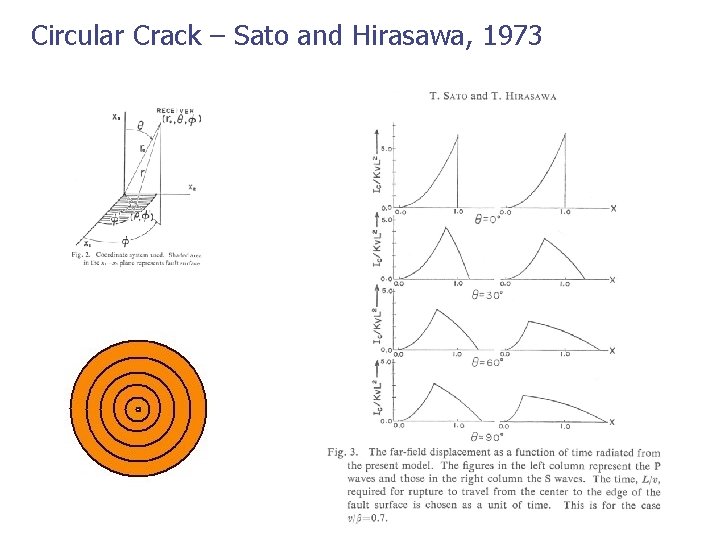
Circular Crack – Sato and Hirasawa, 1973
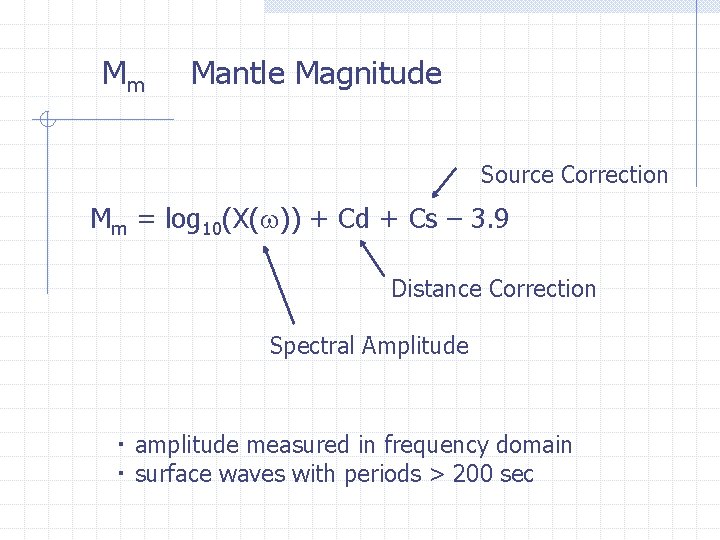
Mm Mantle Magnitude Source Correction Mm = log 10(X(w)) + Cd + Cs – 3. 9 Distance Correction Spectral Amplitude ・ amplitude measured in frequency domain ・ surface waves with periods > 200 sec
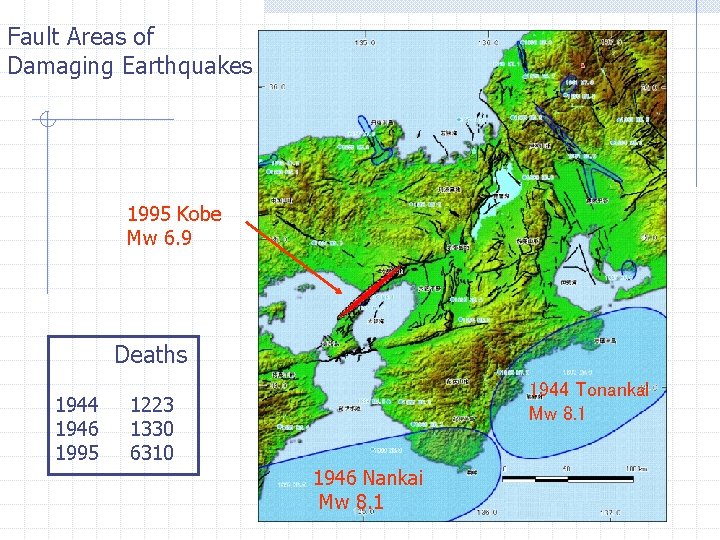
Fault Areas of Damaging Earthquakes 1995 Kobe Mw 6. 9 1944 1946 1995 Deaths 1944 Tonankai Mw 8. 1 1223 1330 6310 1946 Nankai Mw 8. 1
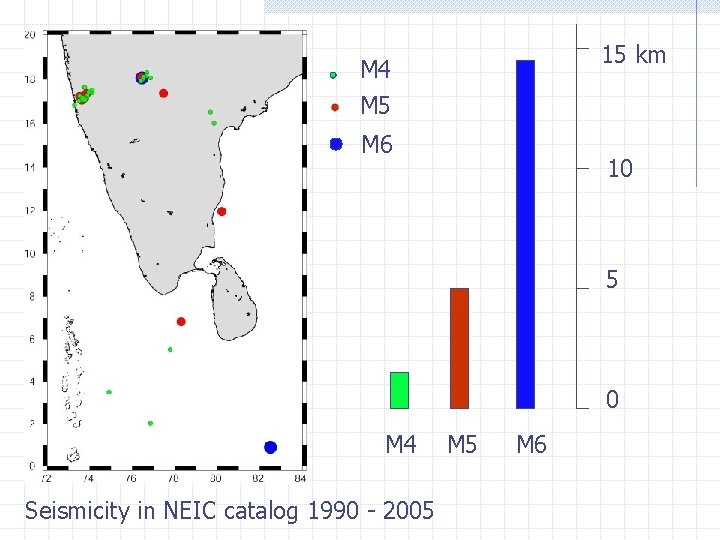
15 km M 4 M 5 M 6 10 5 0 M 4 Seismicity in NEIC catalog 1990 - 2005 M 6
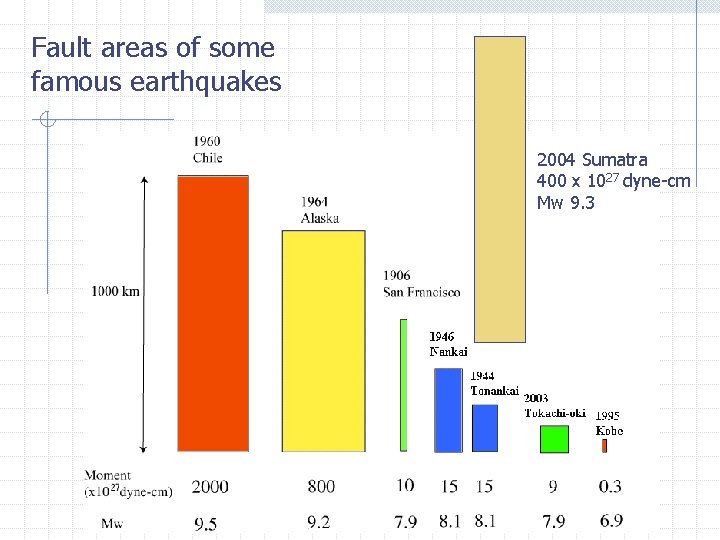
Fault areas of some famous earthquakes 2004 Sumatra 400 x 1027 dyne-cm Mw 9. 3
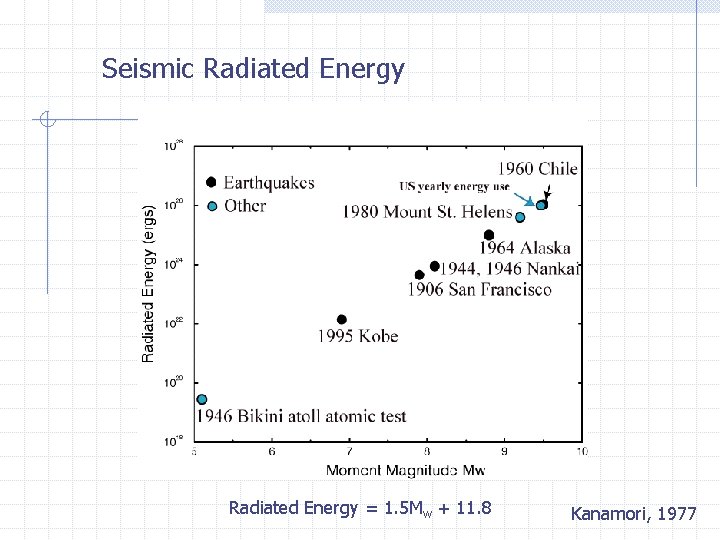
Seismic Radiated Energy = 1. 5 Mw + 11. 8 Kanamori, 1977
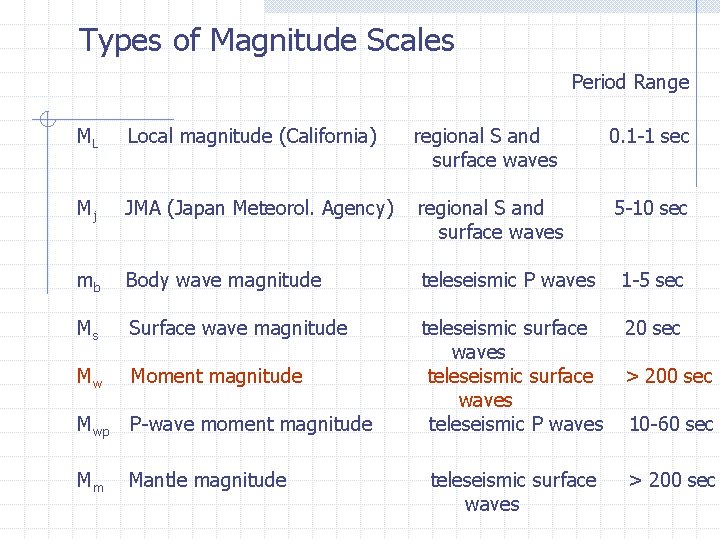
Types of Magnitude Scales Period Range ML Local magnitude (California) regional S and surface waves 0. 1 -1 sec Mj JMA (Japan Meteorol. Agency) regional S and surface waves 5 -10 sec mb Body wave magnitude teleseismic P waves 1 -5 sec Ms Surface wave magnitude 20 sec Mw Moment magnitude Mwp P-wave moment magnitude teleseismic surface waves teleseismic P waves Mm Mantle magnitude teleseismic surface waves > 200 sec 10 -60 sec > 200 sec
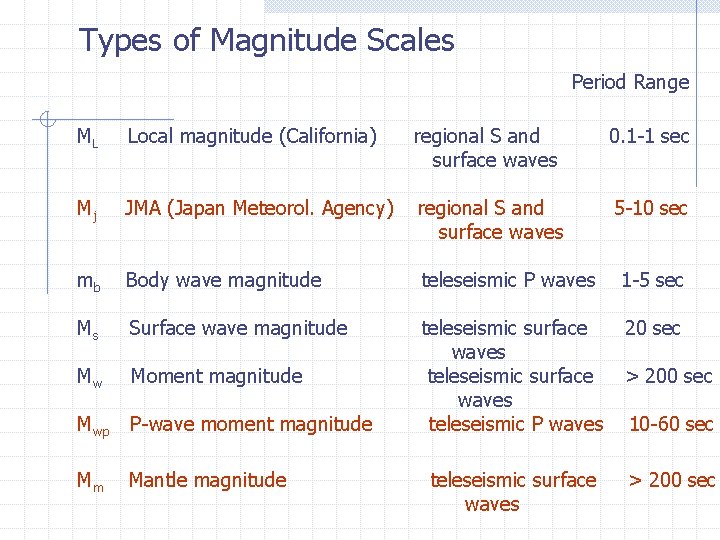
Types of Magnitude Scales Period Range ML Local magnitude (California) regional S and surface waves 0. 1 -1 sec Mj JMA (Japan Meteorol. Agency) regional S and surface waves 5 -10 sec mb Body wave magnitude teleseismic P waves 1 -5 sec Ms Surface wave magnitude 20 sec Mw Moment magnitude Mwp P-wave moment magnitude teleseismic surface waves teleseismic P waves Mm Mantle magnitude teleseismic surface waves > 200 sec 10 -60 sec > 200 sec
- Slides: 51