BreakEven Analysis What is Break even analysis Operating

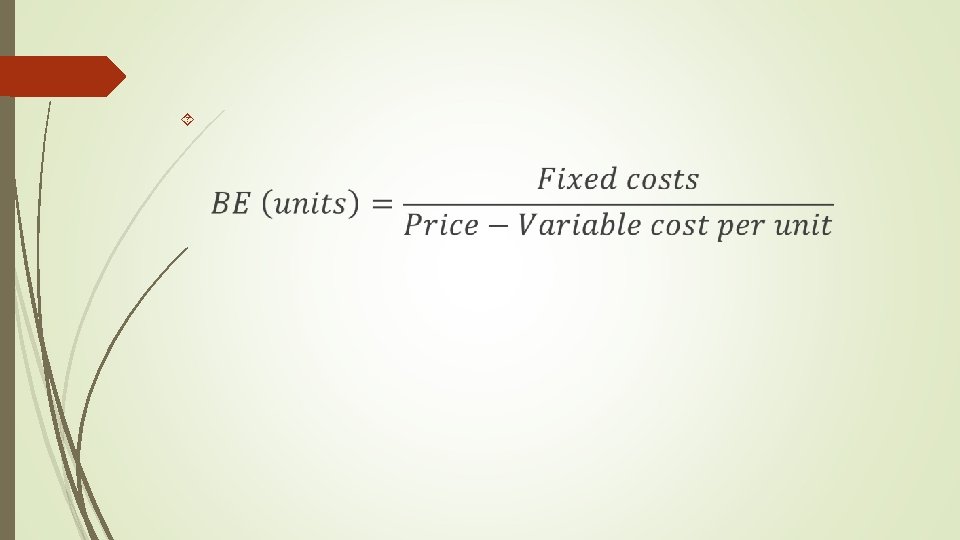
Break-Even Analysis

What is; Break – even analysis? Operating leverage? Financial leverage? Combined leverage?

How much will changes in volume affect cost and profit? At what point does the firm break – even? What is the most efficient level of fixed assets to employ in the firm?

Classification of costs Fixed Variable Semivariable Lease Raw material Utilities Depreciation Factory labor Repair and maintenance Executive salaries Sales commissions Property taxes

Fixed costs are the cost which doesn’t vary by the volume of units produced and sold. Fixed costs will remain constant. Variable cost per unit varies by the number of units produced and sold.

For purposes of analysis, variable and semivariable costs will be combined. To evaluate the implications of heavy fixed asset use, we employ the technique of break even analysis.

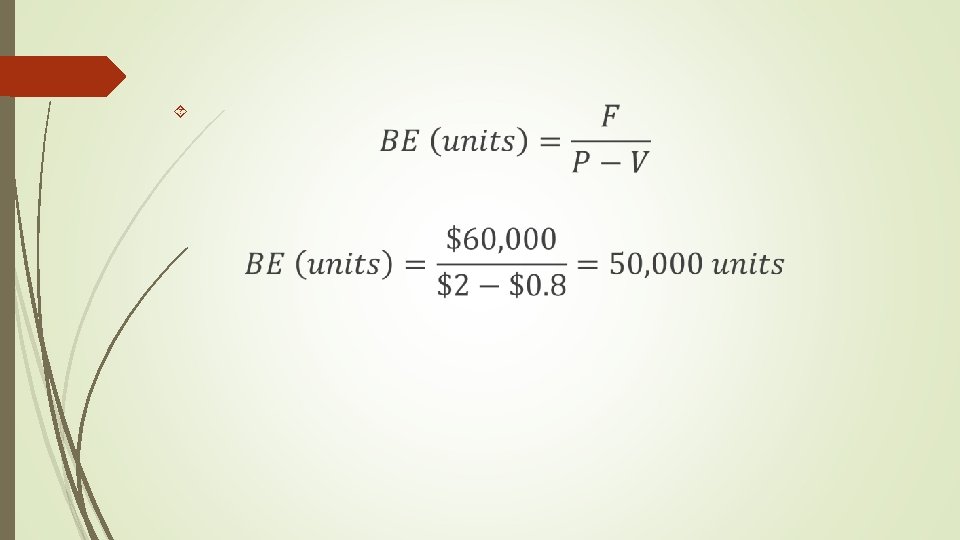
Fixed costs are $60, 000 Price is $2 Variable cost per unit is $0. 80

Break-Even Chart: Leveraged Firm

Break-Even Analysis Break-even point is 50, 000 units, where total costs and total revenue lines intersect Units = 50, 000 Total Variable Costs (TVC) (50, 000 x $0. 80)=$40, 000 Fixed Costs (FC) $60, 000 Total Costs (TC) $100, 000 Total Revenue (TR) (50, 000 x $2)=$100, 000 Operating Income (Loss) $0

Fixed costs are $60, 000 regardless of volume and that our variable costs (at $0. 80 per unit) are added to fixed costs to determine total costs at any point. The total revenue line is determined by mutplying price ($2) times volume. Of particular interest is the break – even (BE) point at 50, 000 units where the total costs and total revenue lines intersect. Below the break – even point represents the area of loss. Above the break – even point represents the area of profit.
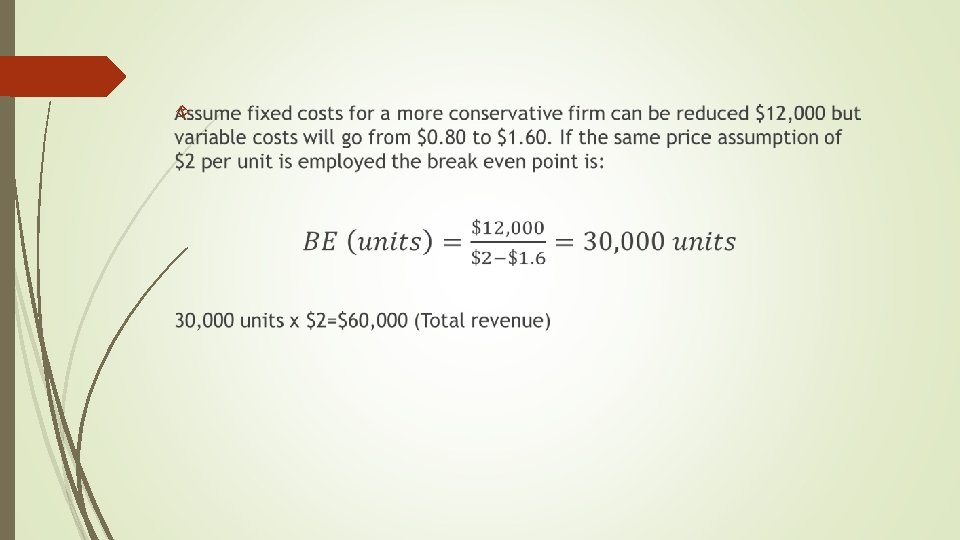

Break-Even Chart: Conservative Firm When fixed costs reduced from $60, 000 to $12, 000, the loss potential is small.

Cash Break – Even Analysis

Degree of Operating Leverage Operating leverage reflects the extent to which fixed assets and associated fixed costs are utulized in the business. Degree of operating leverage (DOL) may be defined as the percentage change in operating income that occurs as a result of a percentage change in units sold. DOL = Percent change in operating income Percent change in unit volume

Algebraic Formula for DOL

Percentage increase sales %33 Degree of operating leverage 6 Percentage icrease in operating income %200

Financial Leverage Reflects amount of debt used in capital structure of firm Determines how to finance operation Determines performance between two firms with equal operating capabilities BALANCE SHEET Assets Liabilities and Net Worth Operating Leverage Financial Leverage 5 -19

Operating leverage as primarily affecting the leftside of the balance sheet and financial leverage as affecting the right-side. Financial leverage determines how the operation is to be financed.

Impact on Earnings Examine two financial plans for firm where $200, 000 is required to carry assets 5 -21

Impact of Financing Plan on Earnings per Share

Financing Plans and Earnings per Share

Degree of Financial Leverage

Limitations to Use of Financial Leverage Beyond a point, debt financing is detrimental to firm Lenders will perceive greater financial risk Common stockholders may drive down price Debt recommended for firms In generally stable industry In positive growth stage Operating in favorable economic conditions

Combining Operating and Financial Leverage Combined leverage— when both leverages allow firm to maximize returns Operating leverage Affects asset structure of firm Determines return from operations Financial leverage Affects debt-equity mix Determines how benefits received are allocated

Combined Leverage Influence on the Income Statement Last item under operating leverage, operating income, becomes initial item for determining financial leverage “Operating income” and “Earnings before interest and taxes” are the same, representing return to owners before interest and taxes are paid 5 -27

Combining Operating and Financial Leverage

Operating and Financial Leverage

Degree of Combined Leverage

Degree of Combined Leverage

Percentage increase sales %25 Degree of combined leverage 4 Percentage increase in earning per share %100 If sales increase from 80, 000 units to 100, 000 units, EPS will increase %100.

Reference: Block, Hirt and Danielsen, Foundation of Financial Management, Sixth Edition
- Slides: 33