Box Plots Worksheet A The worksheet is provided

Box Plots – Worksheet A The worksheet is provided in a variety of sizes/formats.

Printing To print handouts from slides Select the slide from the left. Then click: File > Print > ‘Print Current Slide’ To print multiple slides Click on a section title to highlight all those slides, or press ‘Ctrl’ at the same time as selecting slides to highlight more than one. Then click: File > Print > ‘Print Selection’ To print double-sided handouts Highlight both slides before using ‘Print Selection’. Choose ‘Print on Both Sides’ and ‘Flip on Short Edge’.

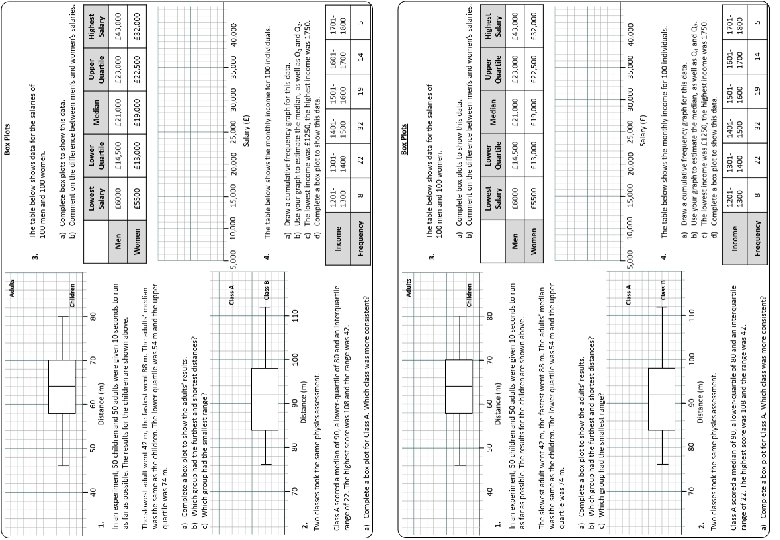
Box Plots Adults The table below shows data for the salaries of 100 men and 100 women. 3. a) Complete box plots to show this data. b) Comment on the difference between men’s and women’s salaries. Children 1. 40 50 60 Distance (m) 70 Lowest Salary Lower Quartile Median Upper Quartile Highest Salary Men £ 6000 £ 14, 500 £ 21, 000 £ 23, 000 £ 43, 000 Women £ 5500 £ 13, 000 £ 19, 000 £ 22, 500 £ 32, 000 80 In an experiment, 50 children and 50 adults were given 10 seconds to run as far as possible. The results for the children are shown above. The slowest adult went 42 m, the fastest went 88 m. The adults’ median was the same as the children. The lower quartile was 54 m and the upper quartile was 74 m. a) Complete a box plot to show the adults’ results. b) Which group had the furthest and shortest distances? c) Which group had the smallest range? Class A 5, 000 10, 000 15, 000 20, 000 25, 000 30, 000 35, 000 40, 000 Salary (£) Class B 70 80 90 Distance (m) 2. Two classes took the same physics assessment. 100 110 Class A scored a median of 90, a lower-quartile of 80 and an interquartile range of 22. The highest score was 108 and the range was 42. a) Complete a box plot for Class A. Which class was more consistent? 4. The table below shows the monthly income for 100 individuals. a) b) c) d) Draw a cumulative frequency graph for this data. Use your graph to estimate the median, as well as Q 1 and Q 2. The lowest income was £ 1250, the highest income was 1750. Complete a box plot to show this data. Income Frequency 12011300 8 13011400 22 14011500 32 15011600 19 16011700 14 17011800 5
 have a")
The table below shows data for the salaries of 3. Men b) have a higher range of salaries and a 100 men and 100 women. higher median. Although both sexes have a a) Complete box plots to show this data. similar interquartile range, the data indicates b) Comment on the difference between men’s and women’s salaries. men are paid better than women. Children 1. 40 50 60 Distance (m) 70 Answers Box Plots Adults 80 Lowest Salary Lower Quartile Median Upper Quartile Highest Salary Men £ 6000 £ 14, 500 £ 21, 000 £ 23, 000 £ 43, 000 Women £ 5500 £ 13, 000 £ 19, 000 £ 22, 500 £ 32, 000 In an experiment, 50 children and 50 adults were given 10 seconds to run as far as possible. The results for the children are shown above. The slowest adult went 42 m, the fastest went 88 m. The adults’ median was the same as the children. The lower quartile was 54 m and the upper quartile was 74 m. Men a) box plotboth to showfastest the adults’ results. b)Complete Adultsawere and slowest. b) Which group had the furthest and shortest distances? c) Which Children had smaller range of distances. c) group had theasmallest range? Women Class A 5, 000 10, 000 15, 000 20, 000 25, 000 30, 000 35, 000 40, 000 Salary (£) Class B 2. 70 80 90 Distance (m) 100 110 a) had wider and the lowest score. Two. Class classes. A took the a same physicsrange assessment. Class B had the highest score, a smaller interquartile Class A scored a median of 90, a lower-quartile of 80 and an interquartile range and higher median. range of 22. Theahighest score was 108 and the range was 42. Class B scored higher and were also more consistent. a) Complete a box plot for Class A. Which class was more consistent? 4. The table below shows the monthly income for 100 individuals. a) b) c) d) Draw a cumulative frequency graph for this data. Use your graph to estimate the median, as well as Q 1 and Q 2. The lowest income was £ 1250, the highest income was 1750. Complete a box plot to show this data. Income Frequency 12011300 8 13011400 22 14011500 32 15011600 19 16011700 14 17011800 5
 b)")
100 4. The table below shows the monthly income for 100 individuals. a) b) c) d) Frequency 12011300 8 13011400 22 14011500 32 15011600 16011700 19 14 x 60 17011800 x x 80 Draw a cumulative frequency graph for this data. Use your graph to estimate the median, as well as Q 1 and Q 2. The lowest income was £ 1250, the highest income was 1750. Complete a box plot to show this data. Income x 40 x 5 20 x 0 1200 Median Estimate = £ 1460 Q 1 Estimate = £ 1380 Q 3 Estimate = £ 1560 1200 1300 1400 1500 Income (£) 1400 1600 1800 Income (£) 1600 1700 1800 Answers

Box Plots Adults The table below shows data for the salaries of 100 men and 100 women. 3. a) Complete box plots to show this data. b) Comment on the difference between men’s and women’s salaries. Children 1. 40 50 60 Distance (m) 70 Lowest Salary Lower Quartile Median Upper Quartile Highest Salary Men £ 6000 £ 14, 500 £ 21, 000 £ 23, 000 £ 43, 000 Women £ 5500 £ 13, 000 £ 19, 000 £ 22, 500 £ 32, 000 80 In an experiment, 50 children and 50 adults were given 10 seconds to run as far as possible. The results for the children are shown above. The slowest adult went 42 m, the fastest went 88 m. The adults’ median was the same as the children. The lower quartile was 54 m and the upper quartile was 74 m. a) Complete a box plot to show the adults’ results. b) Which group had the furthest and shortest distances? c) Which group had the smallest range? Class A 5, 000 10, 000 15, 000 20, 000 25, 000 30, 000 35, 000 40, 000 Salary (£) Class B 70 80 90 Distance (m) 2. Two classes took the same physics assessment. 100 110 Class A scored a median of 90, a lower-quartile of 80 and an interquartile range of 22. The highest score was 108 and the range was 42. a) Complete a box plot for Class A. Which class was more consistent? 4. The table below shows the monthly income for 100 individuals. a) b) c) d) Draw a cumulative frequency graph for this data. Use your graph to estimate the median, as well as Q 1 and Q 2. The lowest income was £ 1250, the highest income was 1750. Complete a box plot to show this data. Income Frequency 12011300 8 13011400 22 14011500 32 15011600 19 16011700 14 17011800 5

Questions? Comments? Suggestions? …or have you found a mistake!? Any feedback would be appreciated . Please feel free to email: tom@goteachmaths. co. uk
- Slides: 8