Boundary Layer Depth and Structure 3 Boundary Layer

Boundary Layer Depth and Structure 3

Boundary Layer Depth and Structure : - Over oceans, the boundary layer depth varies relatively slowly in space and time. The sea surface temperature changes little over a diurnal cycle because of the tremendous mixing within the top of the ocean. Also, water has a large heat capacity, meaning that it can absorb large amounts of heat from the sun with relatively little temperature change. Thus, a slowly varying sea surface temperature means a slowly varying forcing into the bottom of the boundary layer. Most changes in boundary layer depth over oceans are caused by synoptic and mesoscale processes of vertical motion and advection of different air masses over the sea surface. Over both land oceans, the general nature of the boundary layer is to be thinner in high-pressure regions than in low-pressure regions (Fig 1. 6). The subsidence and low-level horizontal divergence associated with synoptic high-pressure move boundary layer air out of the high towards lower pressure regions. The shallower depths are often associated with cloud-free regions. If clouds are present, they are often fair-weather cumulus or stratocumulus clouds. In low-pressure regions the upward motions carry boundary-layer air away from the ground to large altitudes throughout the troposphere. It is difficult to define a boundary layer top for these situations. boundary layer meteorologists may actually be thinner in low-pressure regions than in highpressure ones (see Fig 1. 6).

Over land surfaces in high pressure regions the boundary layer has a well defined structure that evolves with the diurnal cycle (Fig 1. 7). The three major components of this structure are the mixed layer, the residual layer, and the stable boundary layer. When clouds are present in the mixed layer, it is further subdivided into a cloud layer ' and a sub cloud layer. The surface layer is the region at the bottom of the boundary layer where turbulent fluxes and stress vary by less than 10% of their magnitude. Thus, the bottom 10% of the boundary layer is called the surface layer, regardless of whether it is part of a mixed layer or stable boundary layer. Finally, a thin layer called a microlayer or interfacial layer has been identified in the lowest few centimeters of air, where molecular transport dominates over turbulent transport.

The following shorthand notation is often used for the various parts of the boundary layer.

Ø Mixed Layer The turbulence in the mixed layer is usually convectively driven, although a nearly well-mixed layer can form in regions of strong winds. Convective sources include heat transfer from a warm ground surface, and radiative cooling from the top of the cloud layer. The first situation creates thermals of warm air rising from the ground, while the second creates thermals of cool air sinking from cloud top. Both can occur simultaneously, particularly when a cool stratocumulus topped mixed layer is being advected over warmer ground. Even when convection is the dominant mechanism, there is usually wind shear across the top of the ML that contributes to the turbulence generation. On initially cloud-free days, however, ML growth is tied to solar heating of the ground. Starting about a half hour after sunrise, a turbulent ML begins to grow in depth. This ML is characterized by intense mixing in a statically unstable situation where thermals of warm air rise from the ground (Fig 1. 8). The ML reaches its maximum depth in late afternoon. It grows by entraining, or mixing down into it, the less turbulent air from above. As the tops of the highest thermals reach greater and greater depths during the course of the day, the highest thermals might reach their lifting condensation level, LCL, if sufficient moisture is present. High or middle overcast can reduce the insolation at ground level. This, in turn, reduces the intensity of thermals. On these days the ML may exhibit slower growth, and may even become non-turbulent or neutrally-stratified if the clouds are thick enough.

Pollutants emitted from smoke stacks exhibit a characteristic looping as those portions of the effluent emitted into warm thermals begin to rise. Smoke plumes loop up and down in the mixed layer eventually becoming uniformly distributed.

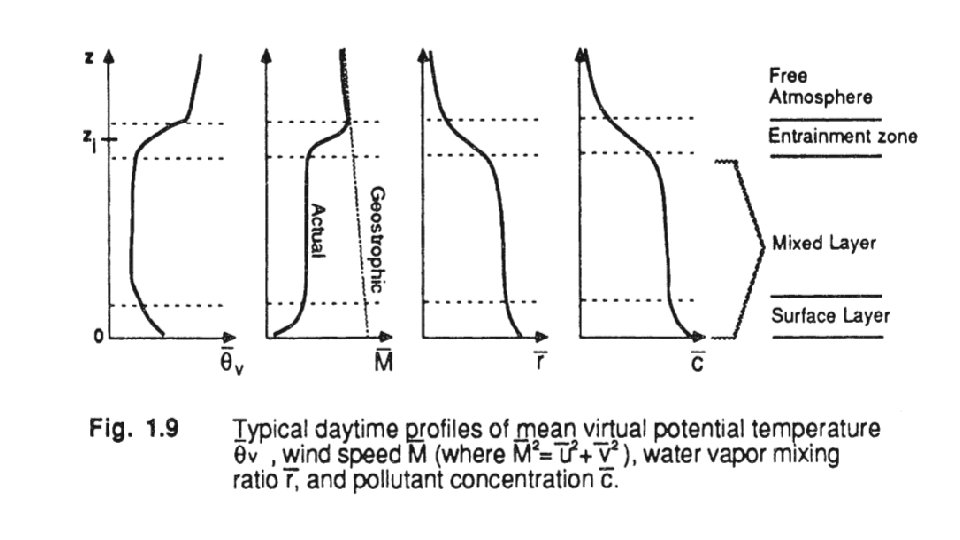
The resulting profiles of virtual potential temperature, mixing ratio, pollutant concentration, and wind speed frequently are as sketched in Figure 1. 9. Virtual potential temperature are nearly adiabatic in the middle portion of the ML. In the surface layer one often finds a super adiabatic layer adjacent to the ground. A stable layer at the top of the ML acts as a lid to the rising thermals, thus restraining the domain of turbulence. It is called the entrainment zone because entrainment into the ML occurs there. At times this capping stable layer is strong enough to be classified as a temperature inversion; that is, the absolute temperature increases with height. The most common symbol for ML depth is zi' which represents the average height of the inversion base. Ø Wind speeds are sub geostrophic throughout the ML, with wind directions crossing the isobars at a small angle towards low pressure. The middle portion of the ML frequently has nearly constant wind speed and direction. Wind speeds decrease towards zero near the ground. resulting in a wind speed profile that is nearly logarithmic with height in the surface layer. Ø Mixing ratios tend to decrease with height, even within the center portion of the ML. This reflects the evaporation of soil and plant moisture from below, and the entrainment of drier air from above. The moisture decrease across the top of the ML is very pronounced. Ø Most pollutant sources are near the earth's surface. Thus, pollutant concentrations can build up in the ML while FA concentrations remain relatively low. Pollutants are transported by eddies such as thermals.
- Slides: 8