Bostons Triple Revolution Demographic Industrial and Spatial Change

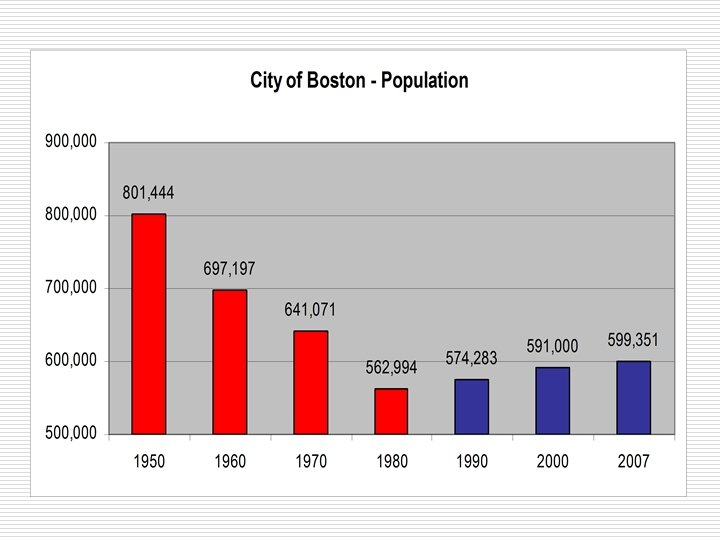
Boston’s Triple Revolution Demographic, Industrial, and Spatial Change in Greater Boston 1950 -2007 Professor Barry Bluestone Dean, School of Social Science, Urban Affairs, and Public Policy Northeastern University October 2008

How Did Boston Rank? 1970 - 1980 o o o o Most distressed and declining cities: Atlanta, BOSTON, Cleveland, Dayton, Hartford, Philadelphia, Newark, and Trenton BOSTON and Cleveland are in the most disadvantaged third of all nine components of the city distress and decline indexes. City Distress Index: BOSTON -5 (Worst) City Decline Index: BOSTON -4 (Worst) SMSA Decline Index: BOSTON -4 (Worst) Disparity Index: BOSTON -5 (Worst) Source: Bradbury, Downs, and Small, Urban Decline and the Future of American Cities (Brookings, 1982)
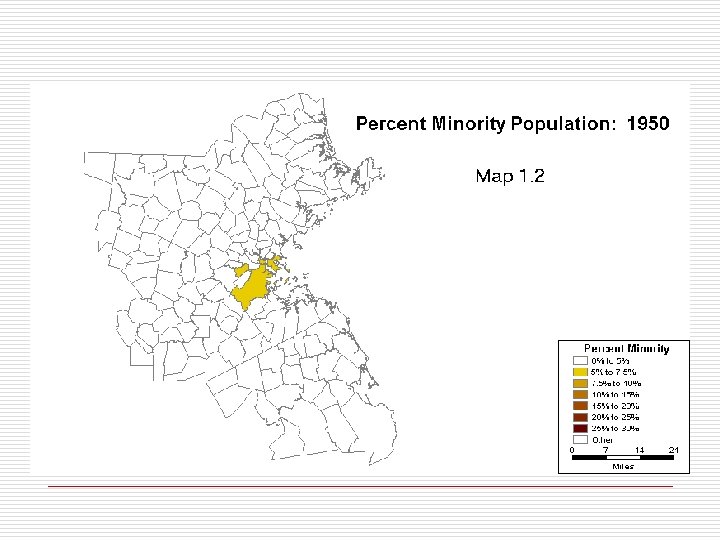
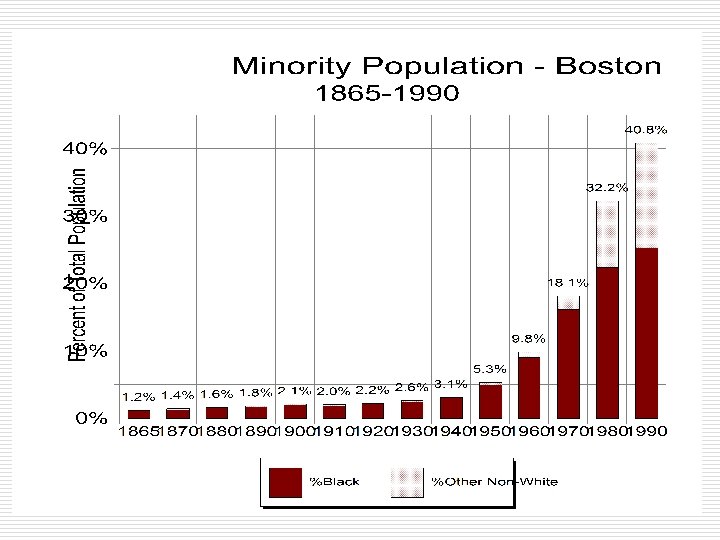
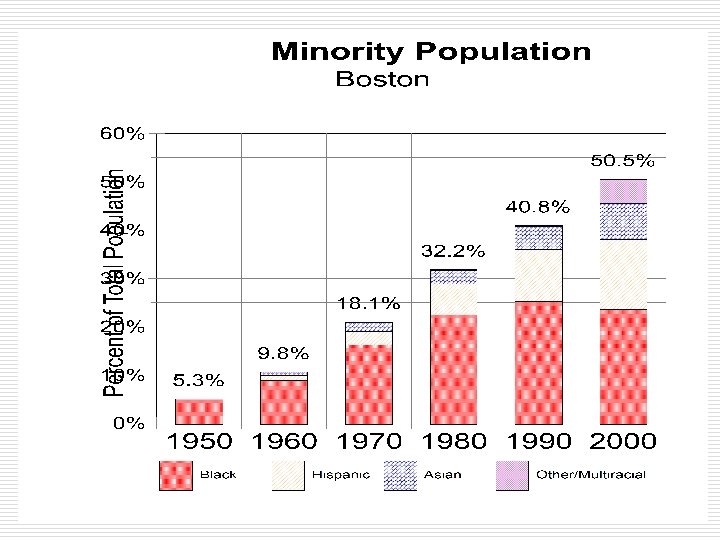

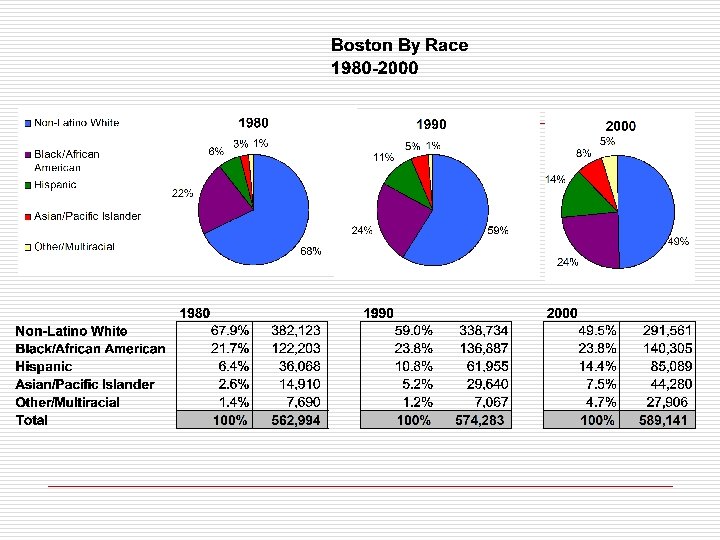
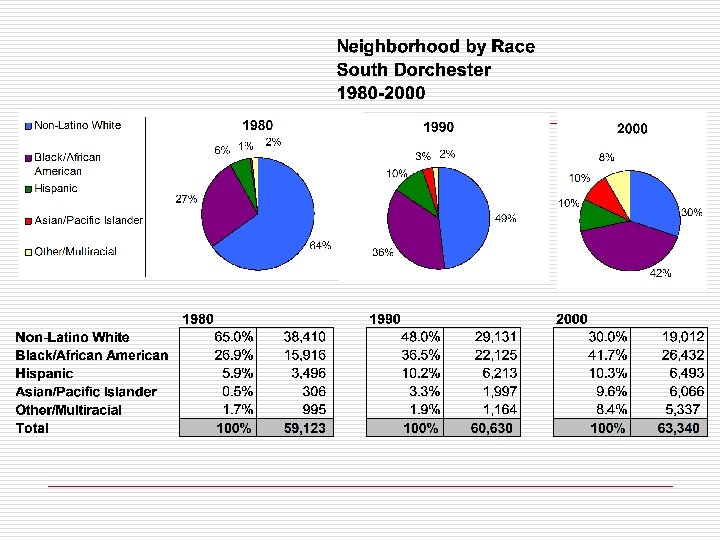
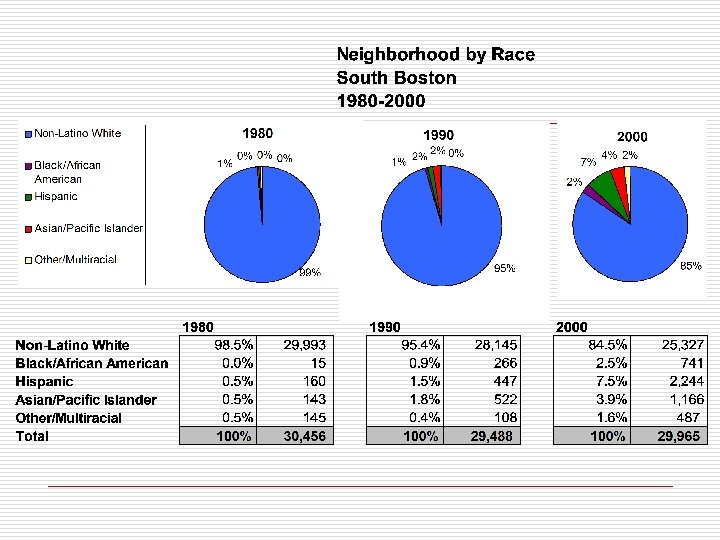
Non-White: 50. 8%

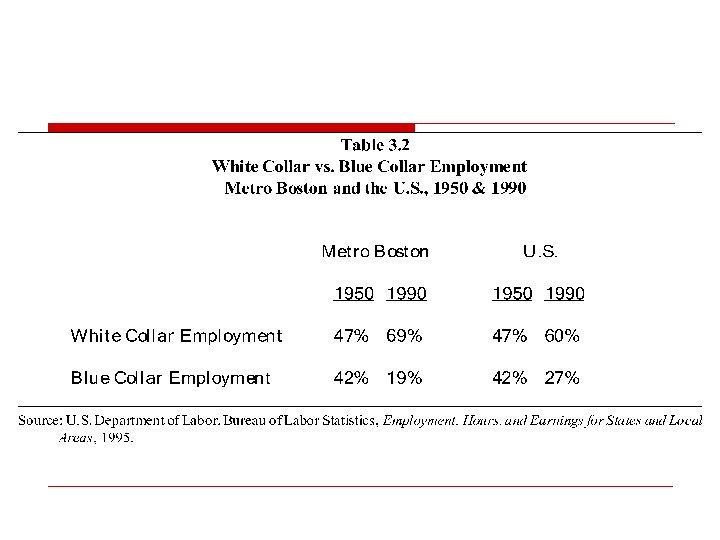
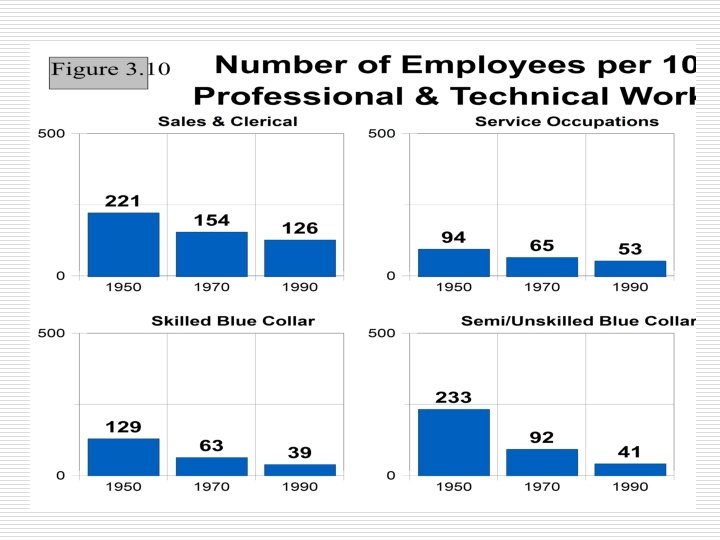
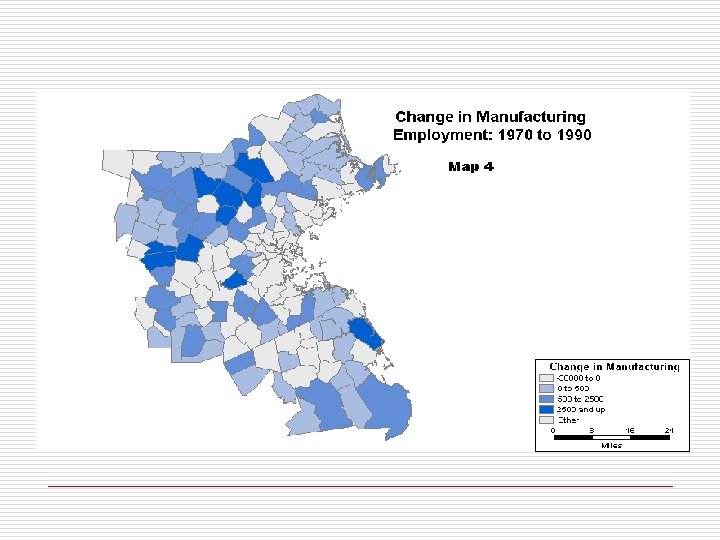
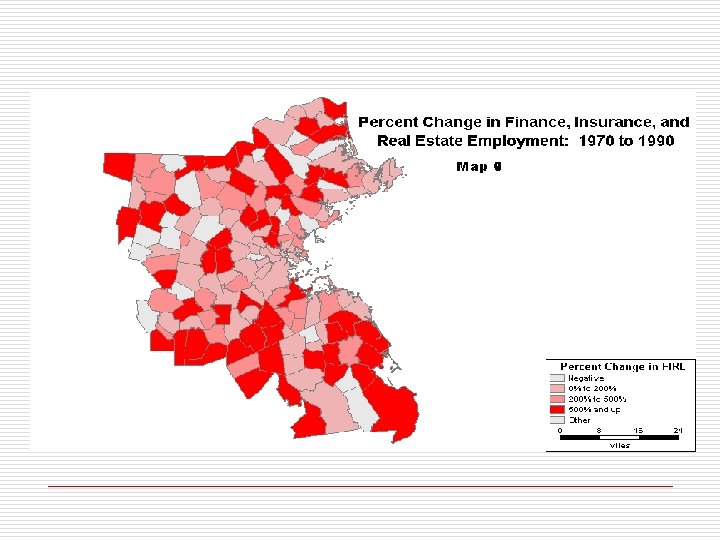
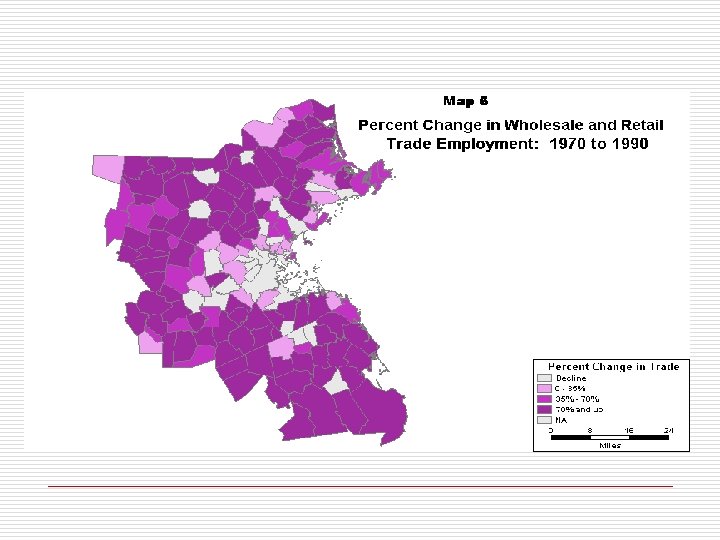
The Industrial Revolution
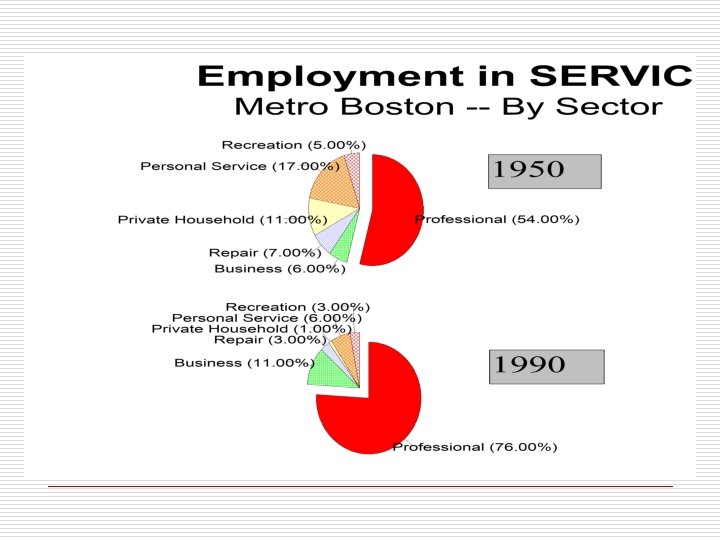

Key Industrial Sectors o o o Higher Education Health Care Financial Services High Tech/Information Services Defense Biotechnology/Nanotechnology

The Spatial Revolution

Boston: High Cost of Living
 Nassau-Suffolk, NY")
Top Decile: Metro Area Cost of Living Boston Washington (D. C. portion) Nassau-Suffolk, NY Stamford-Norwalk, CN Lawrence (Mass. portion) New York, NY Barnstable-Yarmouth, MA San Francisco, CA Worcester (Mass. portion) Springfield, MA Minneapolis-St. Paul, MN Nashua, NH Santa Cruz-Watsonville, CA Oakland, CA San Jose, CA Pittsfield, MA Rochester, MN $ 64, 656 $ $ $ $ 61, 440 60, 780 60, 720 59, 280 58, 656 58, 236 57, 624 55, 704 55, 320 54, 948 54, 852 53, 808 53, 412 52, 800 52, 632 51, 288 Monmouth-Ocean, NJ $ 50, 736 San Diego, CA $ 50, 088 Newark, NJ $ 49, 992 New Haven-Meriden, CN $ 49, 848 Honolulu, HI $ 49, 824 Philadelphia (Pa. portion) $ 49, 716 Boulder-Longmont, CO $ 49, 596 Bridgeport, CN $ 49, 272 Manchester, NH $ 49, 152 Santa Rosa, CA $ 48, 924 Albany-Schenectady-Troy, NY $ 48, 900 Hartford, CN $ 48, 684 Trenton, NJ $ 48, 576 Rochester, NY $ 48, 540 Universe: 304 U. S. Metro Areas Economic Policy Institute: Family Budget Calculator

Boston Family Budget – 4 Persons Among 304 U. S. Metropolitan Areas o Housing Costs: Child Care: Health Care: Personal Care: Fed/State Tax: o Total Cost: o o 7 th Highest MSA 6 th Highest MSA 2 nd Highest MSA 1 st Highest MSA Economic Policy Institute, Family Budget Calculator, 2005

A Tale of Two Cities Boston A Tale of Two Cities Monthly $1, 266 Basic. Housing Budget Monthly Food 2 Children $ 587 2 Parents, Monthly Monthly Child Care Transportation Health Care Other Necessity Taxes Total Annual Total $1, 298 $ 321 $ 592 $ 500 $ 824 $5, 388 $64, 656 Raleigh-Durham. Chapel Hill Monthly Monthly Housing Food Child Care Transportation Health Care Other Necessity Taxes Total Annual Total Source: Economic Policy Institute, “Family Budget Calculator, 2005” $ 779 $ 587 $ 866 $ 358 $ 369 $ 350 $3, 677 $44, 124

CURP Study of Housing, Employment and Population o o o Metro areas with highest cost of living are suffering slow employment growth or outright job loss Metro areas with the highest cost of living are suffering for net out-migration of domestic population Paradox: The shortage of housing supply can lead to a future sharp decline in housing prices … as jobs and workers leave the state

2. 91% 2. 29% 1. 49% 1. 53% 0. 68% 0. 95% 0. 86% 0. 12% -0. 62% Low Price -0. 68% High Price Universe: 245 U. S. Metro Areas Economic Policy Institute, “Family Budget Calculator, 2005”; U. S. Bureau of Labor Statistics
 Universe: 245 U. S. Metro Areas Economic Policy Institute, “Family")
Boston MSA (-4. 9%) Universe: 245 U. S. Metro Areas Economic Policy Institute, “Family Budget Calculator, 2005”; U. S. Bureau of Labor Statistics
 (2000 -2004) %∆Emp(2000 -2004) = -. 1466 +. 0000396 Housing Cost")
Employment Change (%) (2000 -2004) %∆Emp(2000 -2004) = -. 1466 +. 0000396 Housing Cost (4. 07) -2. 291 E-007 Housing Cost SQ (4. 04) N = 245 Adj. R Square =. 056 Boston MSA Monthly Housing Cost

2. 53% 1. 98% 1. 09% 0. 62% 1. 06% 0. 84% 0. 93% 0. 50% -0. 02% -0. 21% Low Cost High Cost Universe: 245 U. S. Metro Areas Economic Policy Institute, “Family Budget Calculator, 2005”; U. S. Bureau of Labor Statistics
 Universe: 304 U. S. Metro Areas Economic Policy Institute, “Family")
Boston MSA (-5. 2%) Universe: 304 U. S. Metro Areas Economic Policy Institute, “Family Budget Calculator, 2005”; U. S. Bureau of the Census
 %∆Internal Migration = -. 146 +. 000399 Housing Costs (7.")
Internal Migration (% Change) %∆Internal Migration = -. 146 +. 000399 Housing Costs (7. 03) - 2. 475 E-007 Housing Costs SQ (7. 39) Boston MSA Monthly Housing Cost N = 304 Adj. R Square =. 153
 %∆Internal Migration = -. 146 +. 000399 Housing Costs (7.")
Internal Migration (% Change) %∆Internal Migration = -. 146 +. 000399 Housing Costs (7. 03) - 2. 475 E-007 Housing Costs SQ (7. 39) Boston MSA Monthly Housing Cost N = 304 Adj. R Square =. 153 San Francisco Stamford-Norwalk San Jose Boston Oakland Nassau-Suffolk

2. 19% 1. 40% 1. 54% 1. 04% 0. 41% 0. 60% 0. 39% 0. 16% -2. 12% Universe: 304 U. S. Metro Areas Boston Economic Policy Institute, “Family Budget Calculator, 2005”; U. S. Bureau of the Census

The Future Demographics of Massachusetts Projected Percent Change in Households by Age Cohort, 2006 -2017 Of a net increase of 193, 500 households, 244, 600 are projected to be age 55 + Source: U. S. Census Demographic Projections

The Life & Death of American Cities o o o Detroit New Orleans Boston Does failure lead to failure? Does success lead to failure?
- Slides: 44