
Boston Private LongTerm Value Creation Timothy L Vaill
Boston Private: Long-Term Value Creation Timothy L. Vaill Chairman and Chief Executive Officer Walter M. Pressey President and Interim Chief Financial Officer Q 2 2007
Forward Looking Statements in this presentation that are not historical facts are forwardlooking statements within the meaning of the Private Securities Litigation Reform Act of 1995 that involve risks and uncertainties. These factors include, among others, strategic growth rates, the strength of the company's business, the quality of the company’s loan portfolio, changes in the interest rate environment, adverse conditions in the capital markets and the impact of such conditions on Boston Private’s asset management activities, competitive pressures from other financial institutions, the risk that goodwill and intangibles recorded in the Company’s financial statements will become impaired, and risks related to the identification and implementation of acquisitions, as well as the other risks and uncertainties detailed in Boston Private's Annual Report on Form 10 -K and other filings submitted to the Securities and Exchange Commission. Boston Private does not undertake any obligation to update any forward-looking statement to reflect circumstances or events that occur after the date the forward-looking statements are made. 2
Agenda 1. Overview 2. Strategy 3. Results 4. Future Conclusion 3
Overview Boston Private Today
Boston Private’s Mission: To provide wealth management solutions to successful people, their families, private companies and selected institutions through trusted relationships that help preserve, grow and transfer assets over the client’s financial lifecycle.
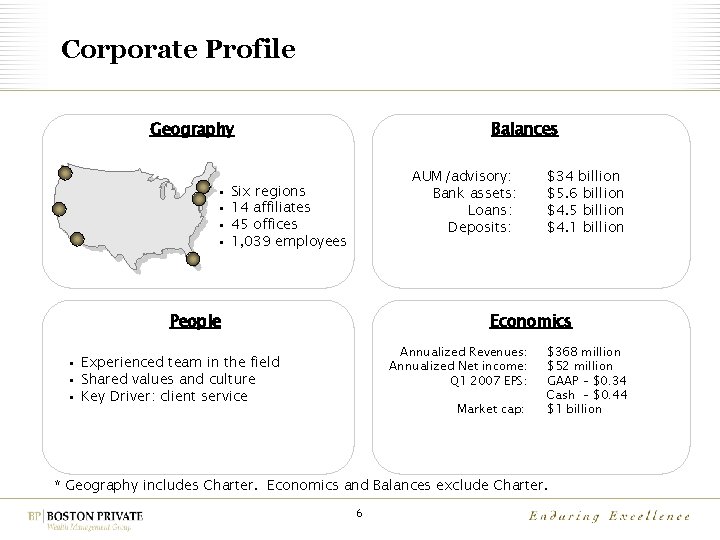
Corporate Profile Balances Geography • • AUM/advisory: Bank assets: Loans: Deposits: Six regions 14 affiliates 45 offices 1, 039 employees People $34 billion $5. 6 billion $4. 5 billion $4. 1 billion Economics Annualized Revenues: Annualized Net income: Q 1 2007 EPS: • Experienced team in the field • Shared values and culture • Key Driver: client service Market cap: $368 million $52 million GAAP – $0. 34 Cash – $0. 44 $1 billion * Geography includes Charter. Economics and Balances exclude Charter. 6
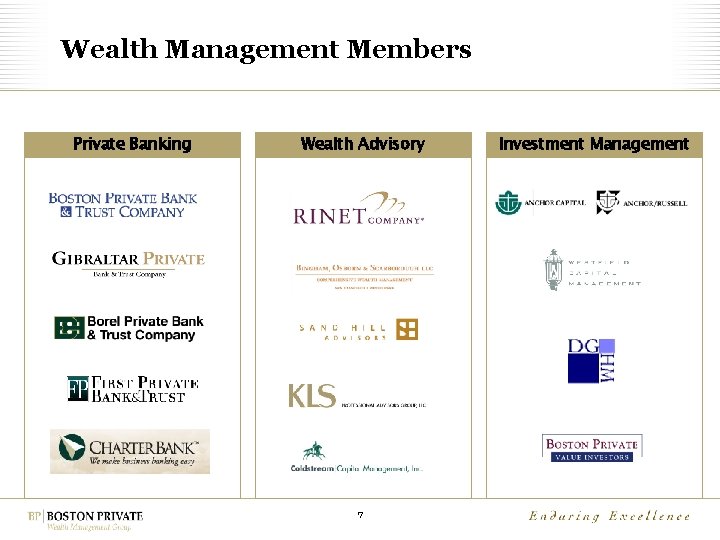
Wealth Management Members Private Banking Wealth Advisory 7 Investment Management
Recent Events • On March 5, 2007, Boston Private announced the acquisition of Charter Bank in Bellevue, Washington • Charter is a $320 million commercial bank with 4 locations in key demographic areas • Charter will work closely with Coldstream Capital Management to bring comprehensive wealth management services to the HNW and small business markets 8
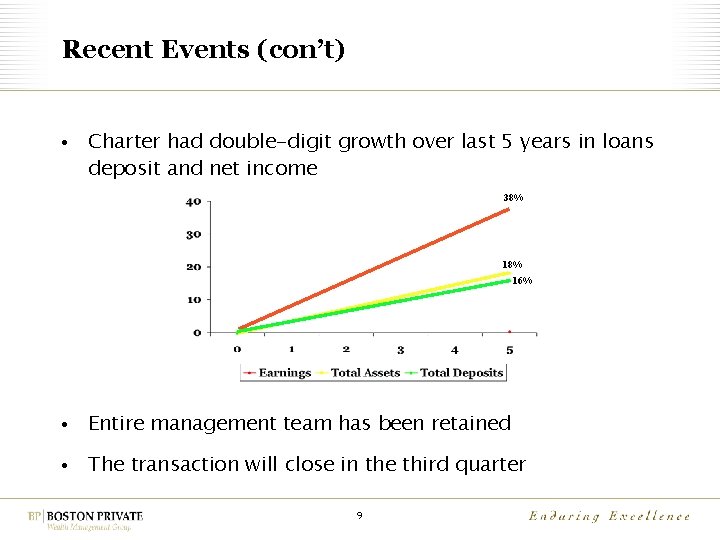
Recent Events (con’t) • Charter had double-digit growth over last 5 years in loans deposit and net income 38% 16% • Entire management team has been retained • The transaction will close in the third quarter 9
National Association of Corporate Directors Board of the Year Award • 30 -year old national organization • Inaugural NACD Board of the Year Award • Honoring excellence across the Board • Outstanding contributions to the Company • Maintaining high levels of professional standards 10
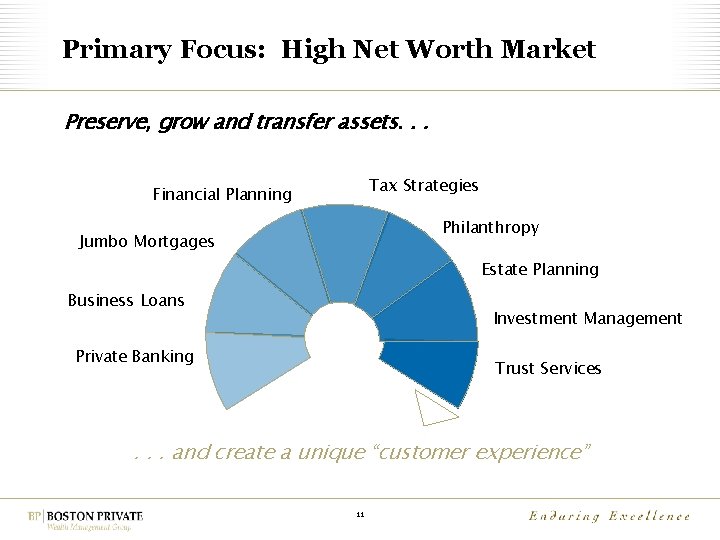
Primary Focus: High Net Worth Market Preserve, grow and transfer assets. . . Tax Strategies Financial Planning Philanthropy Jumbo Mortgages Estate Planning Business Loans Investment Management Private Banking Trust Services . . . and create a unique “customer experience” 11
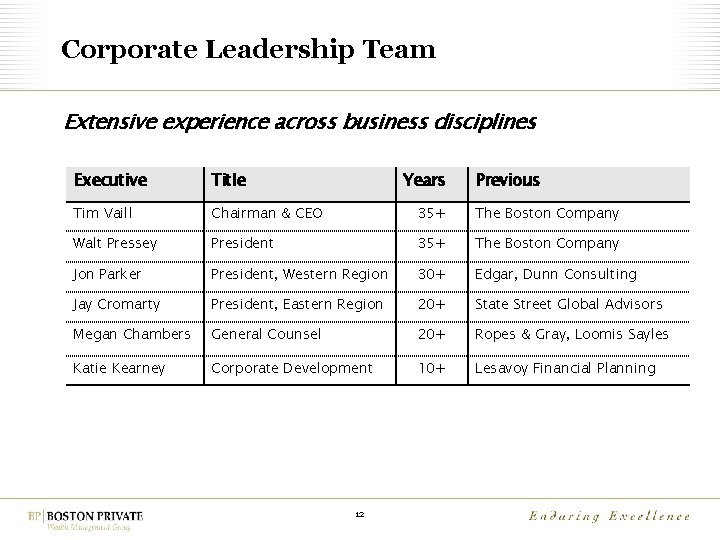
Corporate Leadership Team Extensive experience across business disciplines Executive Title Years Tim Vaill Chairman & CEO 35+ The Boston Company Walt Pressey President 35+ The Boston Company Jon Parker President, Western Region 30+ Edgar, Dunn Consulting Jay Cromarty President, Eastern Region 20+ State Street Global Advisors Megan Chambers General Counsel 20+ Ropes & Gray, Loomis Sayles Katie Kearney Corporate Development 10+ Lesavoy Financial Planning 12 Previous

Strategy Capitalizing on a Unique Business Model
Boston Private’s Strategic Vision: To build a national wealth management franchise that is broadly recognized ― particularly among the newly affluent--as the preferred place to have financial assets managed, and to generate an above average total return to our shareholders over the long-term
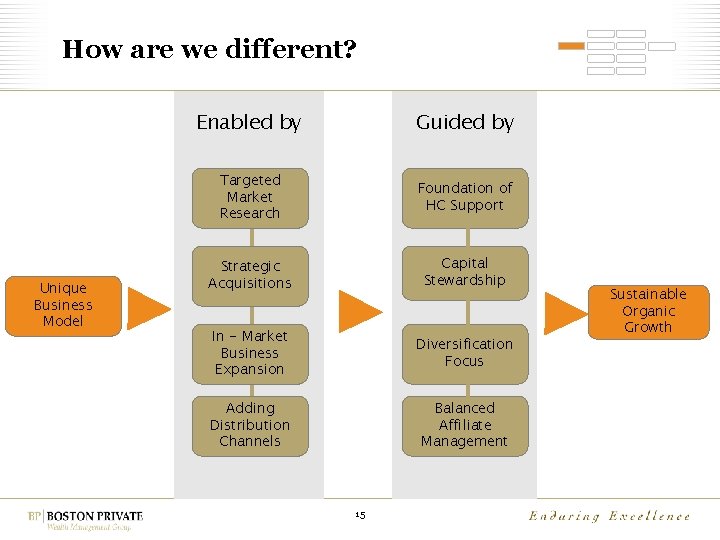
How are we different? Unique Business Model Enabled by Guided by Targeted Market Research Foundation of HC Support Strategic Acquisitions Capital Stewardship In - Market Business Expansion Diversification Focus Adding Distribution Channels Balanced Affiliate Management 15 Sustainable Organic Growth
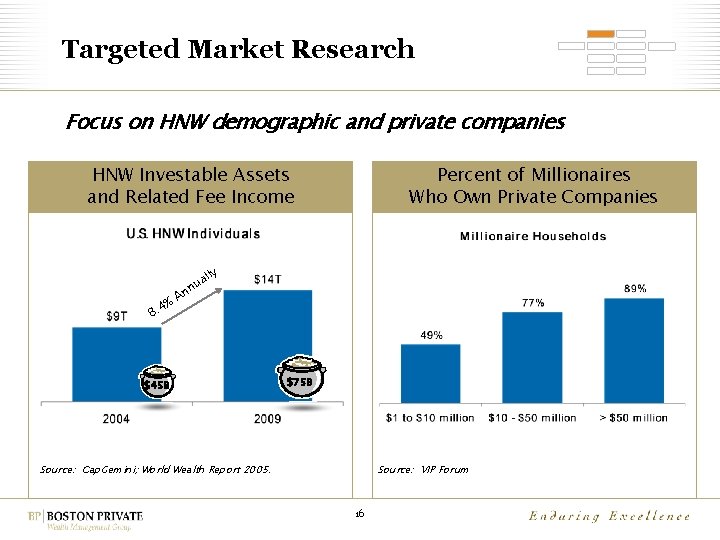
Targeted Market Research Focus on HNW demographic and private companies HNW Investable Assets and Related Fee Income Percent of Millionaires Who Own Private Companies y 8. 4% all u n An $45 B $75 B Source: Cap. Gemini; World Wealth Report 2005. Source: VIP Forum 16
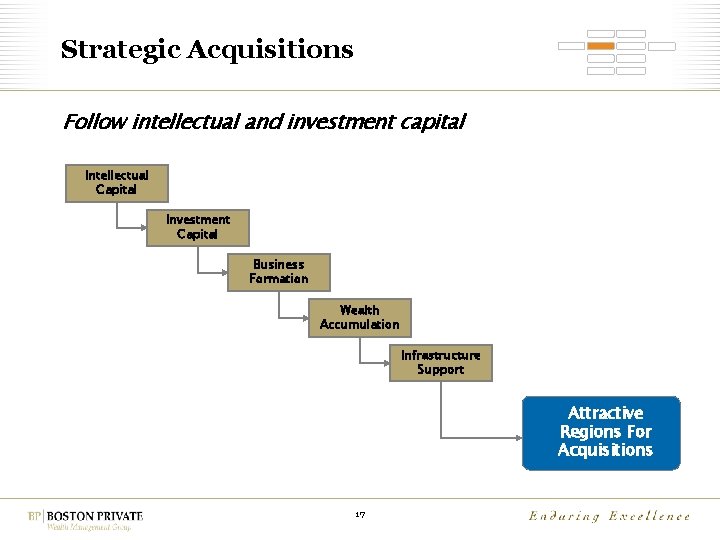
Strategic Acquisitions Follow intellectual and investment capital Intellectual Capital Investment Capital Business Formation Wealth Accumulation Infrastructure Support Attractive Regions For Acquisitions 17
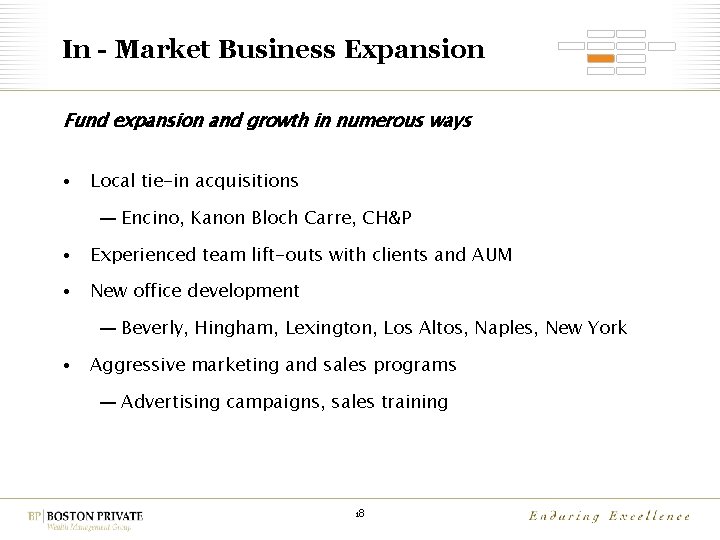
In - Market Business Expansion Fund expansion and growth in numerous ways • Local tie-in acquisitions ― Encino, Kanon Bloch Carre, CH&P • Experienced team lift-outs with clients and AUM • New office development ― Beverly, Hingham, Lexington, Los Altos, Naples, New York • Aggressive marketing and sales programs ― Advertising campaigns, sales training 18
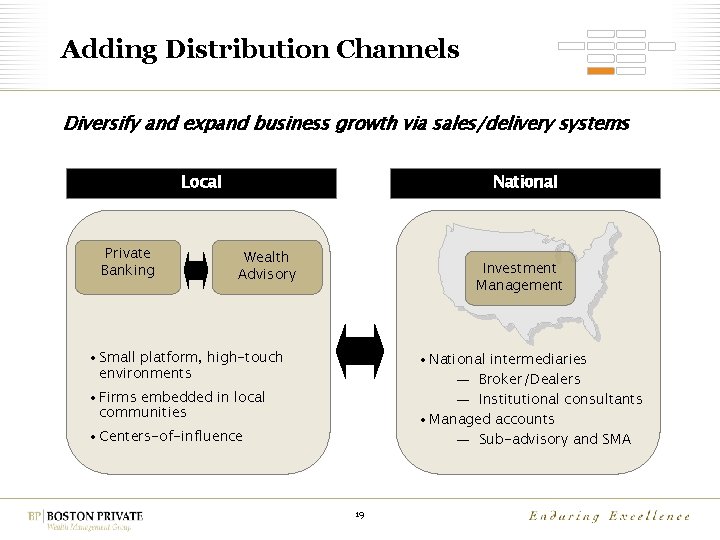
Adding Distribution Channels Diversify and expand business growth via sales/delivery systems Local Private Banking National Wealth Advisory Investment Management • Small platform, high-touch environments • National intermediaries ― Broker/Dealers ― Institutional consultants • Managed accounts ― Sub-advisory and SMA • Firms embedded in local communities • Centers-of-influence 19
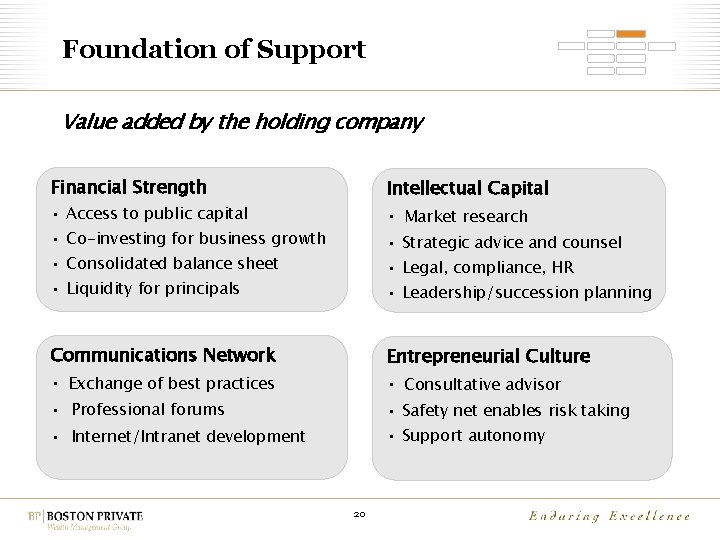
Foundation of Support Value added by the holding company Financial Strength Intellectual Capital • Access to public capital • Market research • Co-investing for business growth • Strategic advice and counsel • Consolidated balance sheet • Legal, compliance, HR • Liquidity for principals • Leadership/succession planning Communications Network Entrepreneurial Culture • Exchange of best practices • Consultative advisor • Professional forums • Safety net enables risk taking • Support autonomy • Internet/Intranet development 20
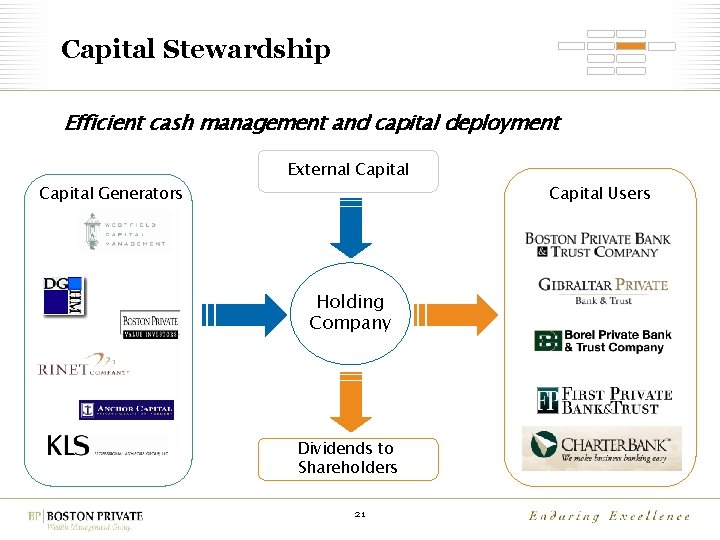
Capital Stewardship Efficient cash management and capital deployment Capital Generators External Capital Holding Company Dividends to Shareholders 21 Capital Users
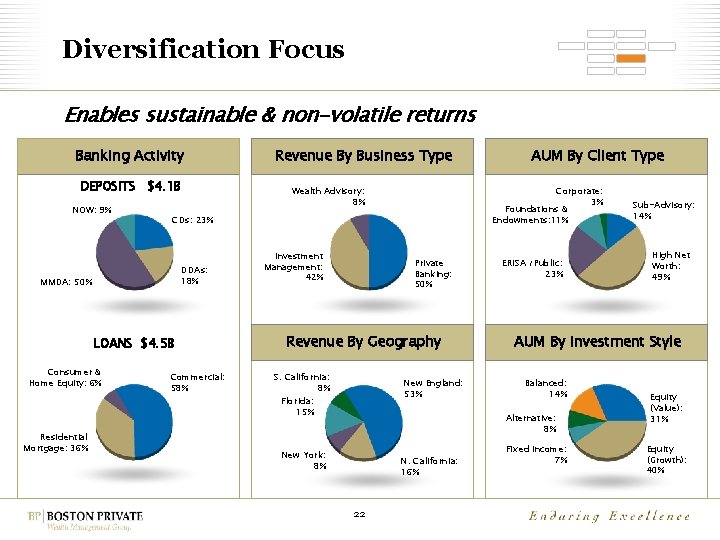
Diversification Focus Enables sustainable & non-volatile returns Banking Activity DEPOSITS $4. 1 B NOW: 9% Wealth Advisory: 8% DDAs: 18% LOANS $4. 5 B Residential Mortgage: 36% Commercial: 58% Investment Management: 42% Private Banking: 50% Revenue By Geography S. California: 8% Florida: 15% AUM By Client Type Corporate: 3% Foundations & Endowments: 11% CDs: 23% MMDA: 50% Consumer & Home Equity: 6% Revenue By Business Type New England: 53% ERISA /Public: 23% N. California: 16% 22 High Net Worth: 49% AUM By Investment Style Balanced: 14% Alternative: 8% New York: 8% Sub-Advisory: 14% Fixed Income: 7% Equity (Value): 31% Equity (Growth): 40%
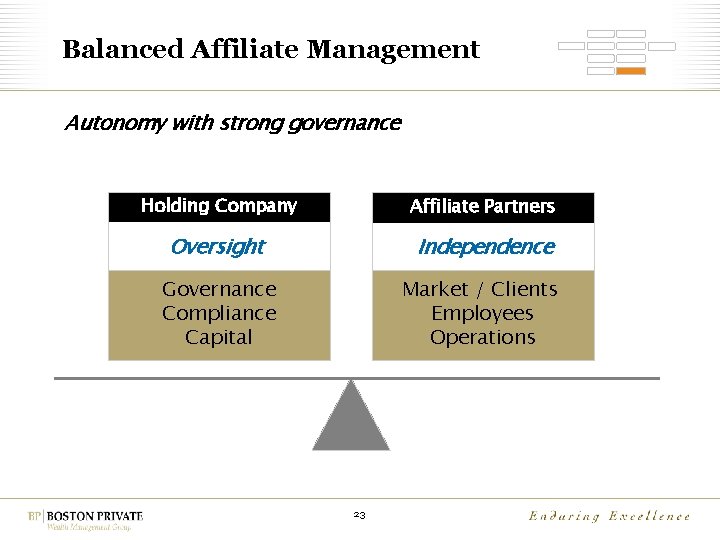
Balanced Affiliate Management Autonomy with strong governance Holding Company Affiliate Partners Oversight Independence Governance Compliance Capital Market / Clients Employees Operations 23
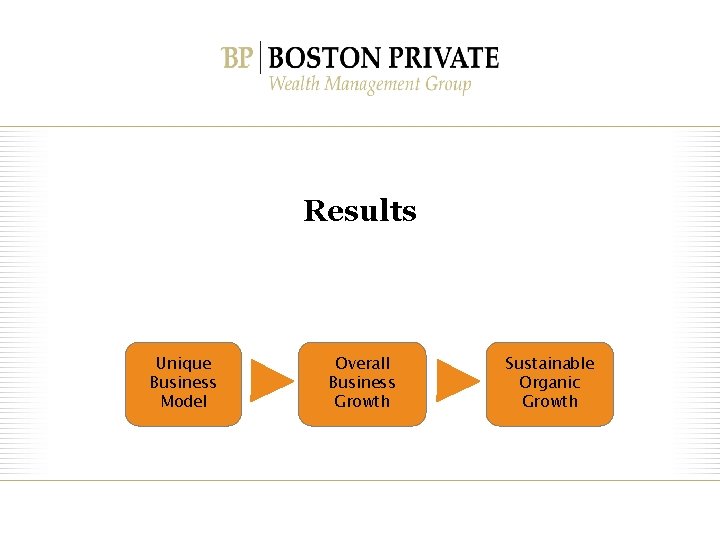
Results Unique Business Model Overall Business Growth Sustainable Organic Growth
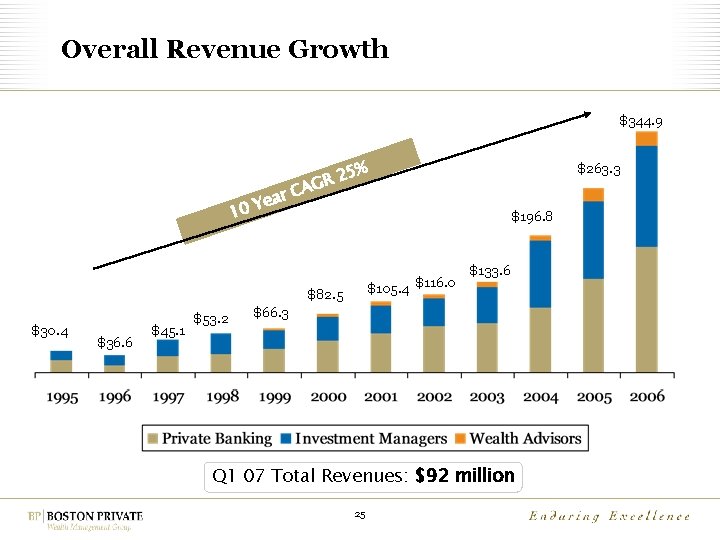
Overall Revenue Growth $344. 9 ear Y 10 25% R CAG $196. 8 $105. 4 $116. 0 $82. 5 $30. 4 $36. 6 $45. 1 $53. 2 $263. 3 $133. 6 $66. 3 Q 1 07 Total Revenues: $92 million 25

Overall AUM Growth $29. 8 $21. 3 B 10 $0. 7 B $2. 2 B $2. 6 B $3. 7 B AG C ear Y $5. 7 B $19. 3 B % 6 R 4 $11. 0 B $6. 5 B $6. 4 B Q 1 07 Total AUM: $34 billion 26

Overall Loan and Deposit Growth* 10 Year CAGR 36% 10 Year CAGR 35% $4. 3 B $4. 1 B $209 M $206 M * Includes Acquisitions Q 1 07 Total Loans and Deposits: $4. 5 and $4. 1 billion 27
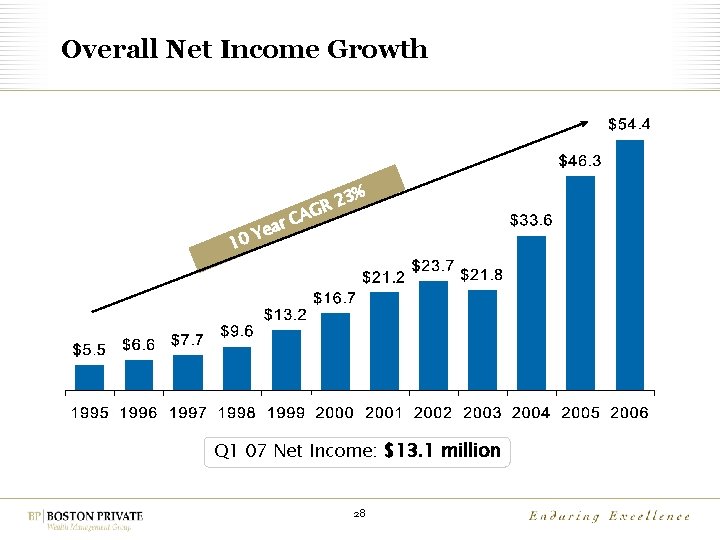
Overall Net Income Growth 10 3% 2 R AG r. C a e Y Q 1 07 Net Income: $13. 1 million 28
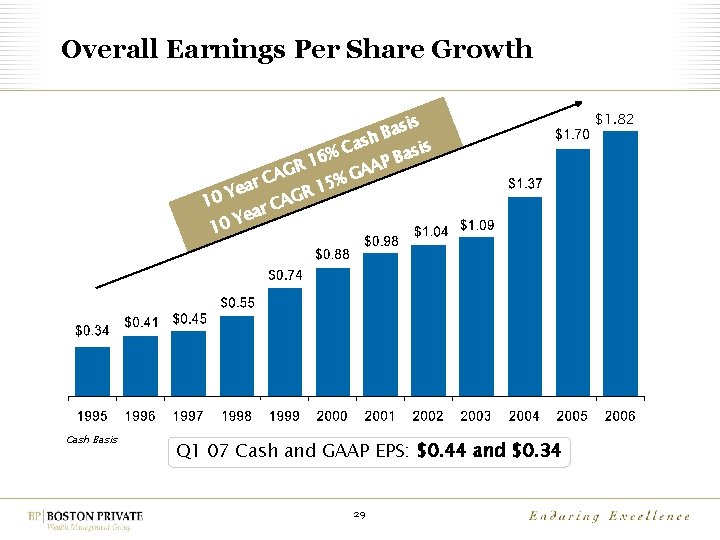
Overall Earnings Per Share Growth asis B ash C asis 6% B 1 R AAP G G A C 15% ear Y R AG 10 C r Yea 0 1 Cash Basis Q 1 07 Cash and GAAP EPS: $0. 44 and $0. 34 29 $1. 82
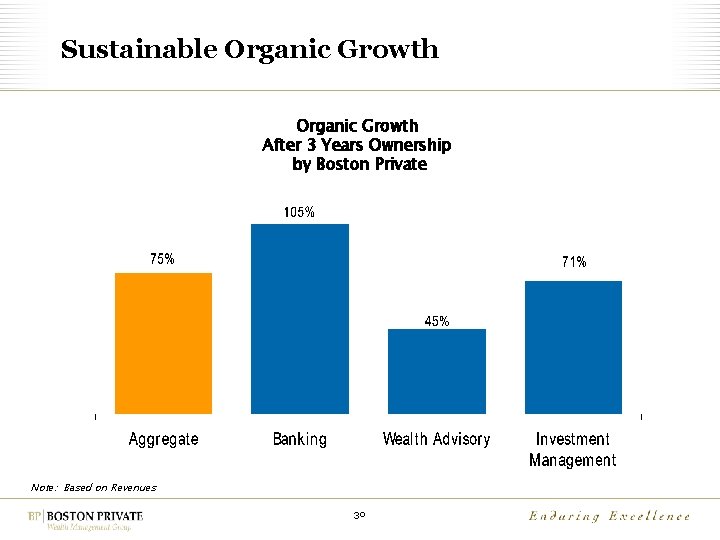
Sustainable Organic Growth After 3 Years Ownership by Boston Private Note: Based on Revenues 30
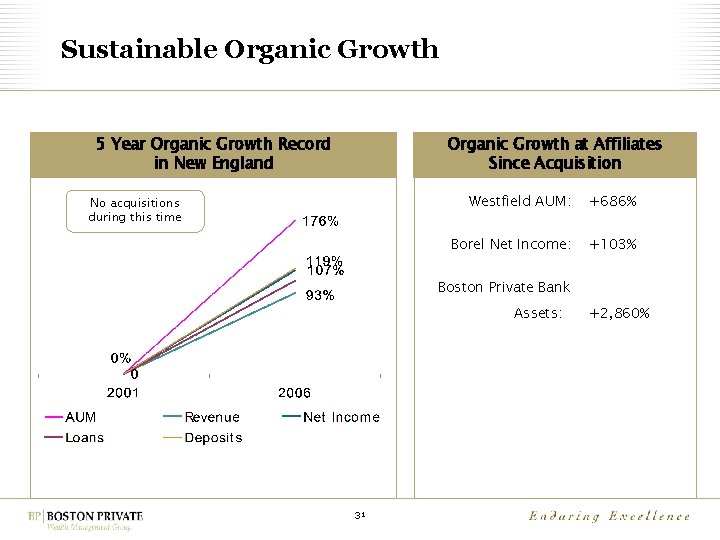
Sustainable Organic Growth 5 Year Organic Growth Record in New England Organic Growth at Affiliates Since Acquisition No acquisitions during this time Westfield AUM: +686% Borel Net Income: +103% Boston Private Bank Assets: 31 +2, 860%
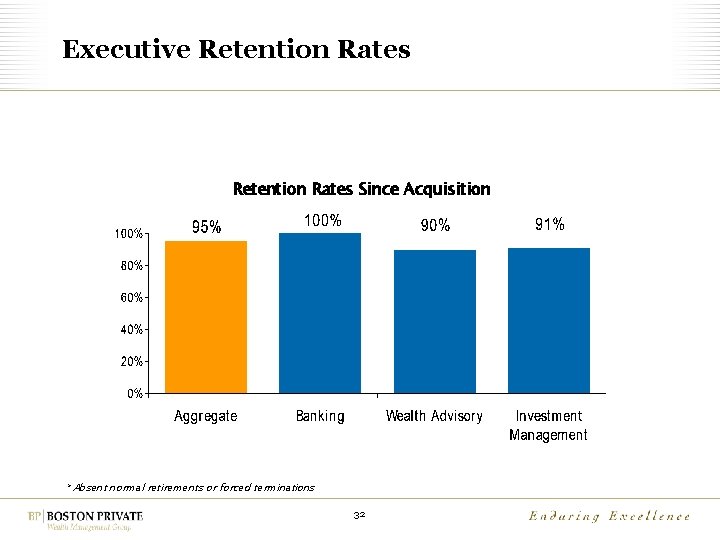
Executive Retention Rates Since Acquisition * Absent normal retirements or forced terminations 32
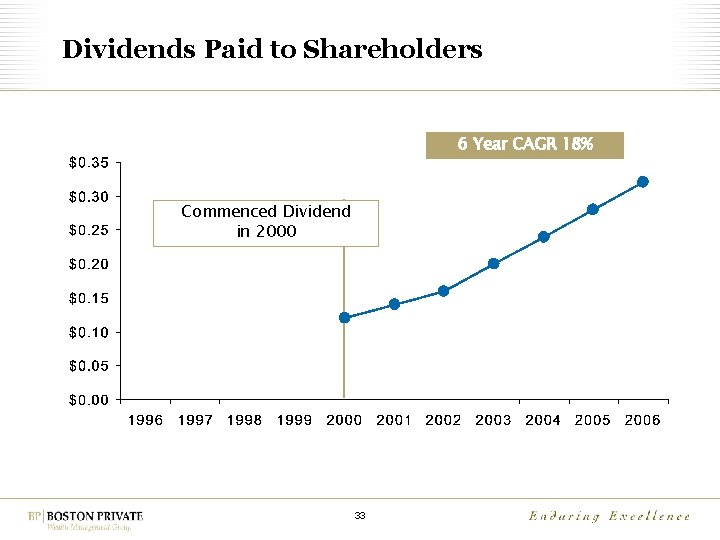
Dividends Paid to Shareholders 6 Year CAGR 18% Commenced Dividend in 2000 33
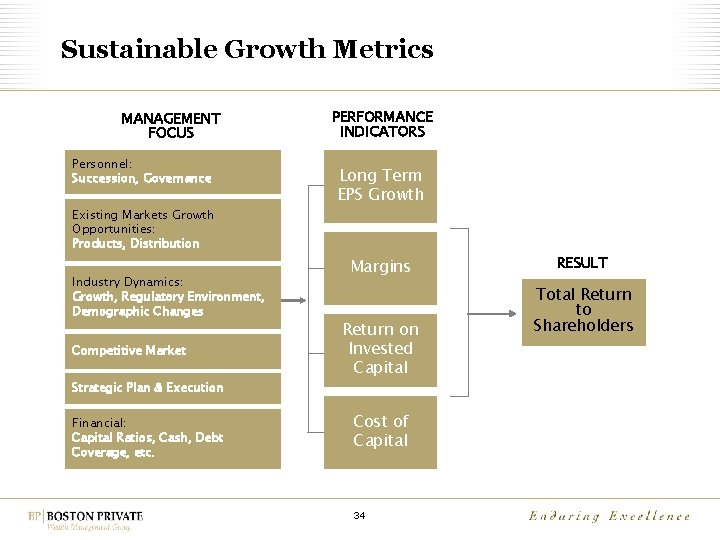
Sustainable Growth Metrics MANAGEMENT FOCUS Personnel: Succession, Governance Existing Markets Growth Opportunities: Products, Distribution Industry Dynamics: Growth, Regulatory Environment, Demographic Changes Competitive Market Strategic Plan & Execution Financial: Capital Ratios, Cash, Debt Coverage, etc. PERFORMANCE INDICATORS Long Term EPS Growth Margins Return on Invested Capital Cost of Capital 34 RESULT Total Return to Shareholders
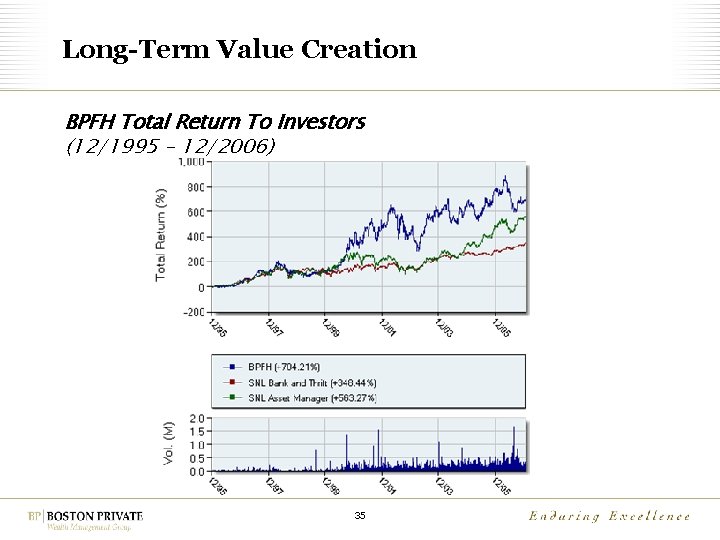
Long-Term Value Creation BPFH Total Return To Investors (12/1995 – 12/2006) 35
Future Steps to additional Value Creation
1. Enhance Existing Platform • Co-invest with affiliates in marketing / sales to generate organic growth • Execute on in-market business growth opportunities • Fill out core capabilities in existing clusters 37
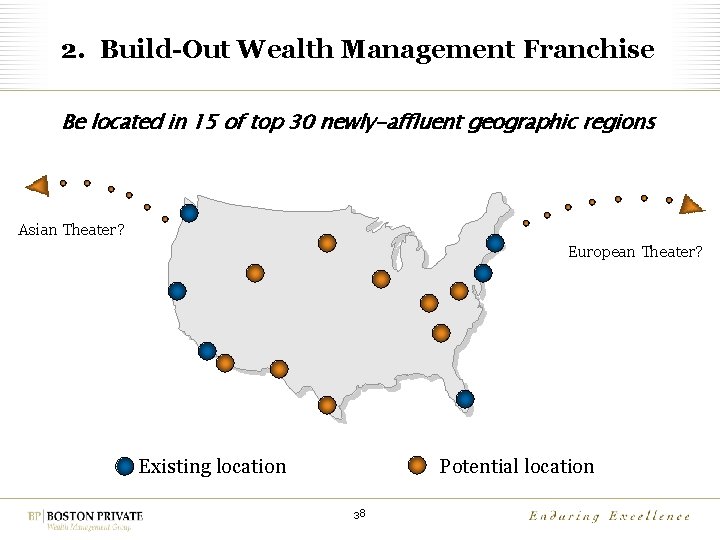
2. Build-Out Wealth Management Franchise Be located in 15 of top 30 newly-affluent geographic regions Asian Theater? European Theater? Existing location Potential location 38
3. Expand Product & Distribution Build broad-scale access to products and national distribution • Provide affiliates access to “best of breed” in all investment categories • Private banking, family office and philanthropic services nationwide • National platform – broad scale distribution of proprietary products • More products through existing distribution channels 39
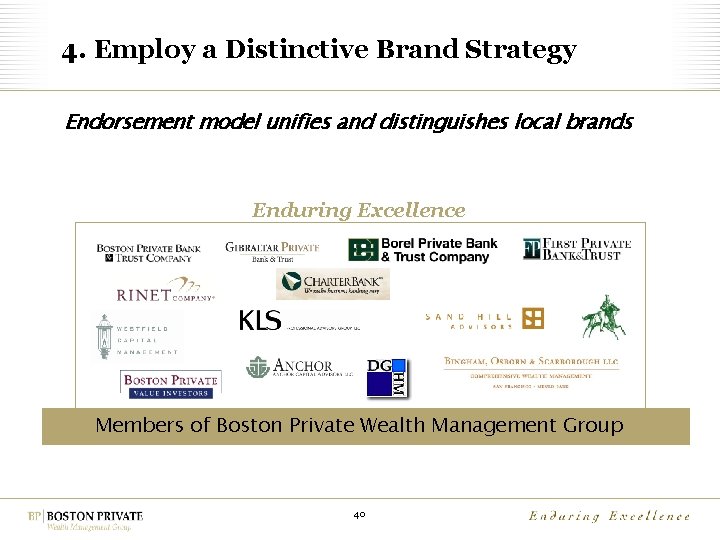
4. Employ a Distinctive Brand Strategy Endorsement model unifies and distinguishes local brands Enduring Excellence Members of Boston Private Wealth Management Group 40
5. Attract and Retain Top Talent • Foster culture of values, opportunity and respect • Communicate with clarity and consistency • Emphasize the complete person = skills + cultural fit • Provide creative compensation programs • Actively endorse entrepreneurship 41

Conclusion Boston Private is creating long-term value for shareholders • Unique and validated business model • Demonstrated acquisition success and organic growth • Financial sustainability through diversification • Uncompromising commitment to entrepreneurial environment which attracts and retains superior professionals • Attractive total returns to shareholders over tenyear period 42
Boston Private: Long-Term Value Creation Timothy L. Vaill Chairman and Chief Executive Officer Q 2 2007
Appendix • Financial Performance ― EPS ― Revenue ― Expenses • Segment Financial Summary ― Private Banking ― Wealth Advisory ― Investment Management • Capital Management 44
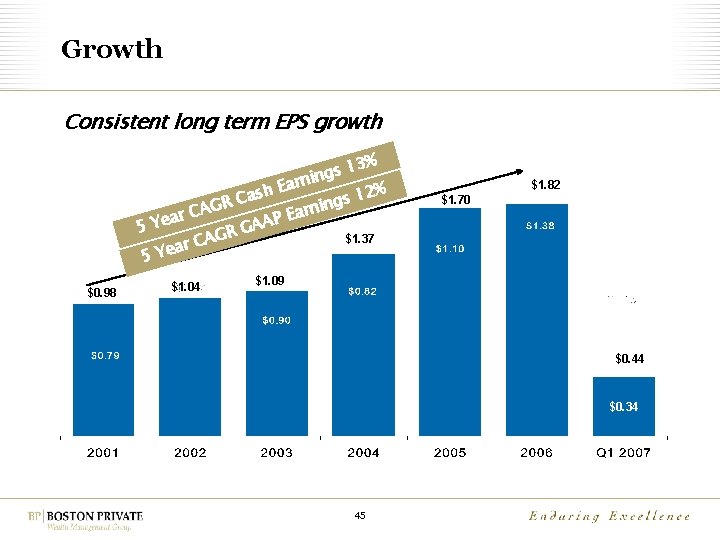
Growth Consistent long term EPS growth 13% s g rnin a E 2% sh 1 a C s g R rnin CAG a E r a AAP 5 Ye G R $1. 37 CAG r a e 5 Y $0. 98 $1. 04 $1. 82 $1. 70 $1. 09 $0. 44 $0. 34 45
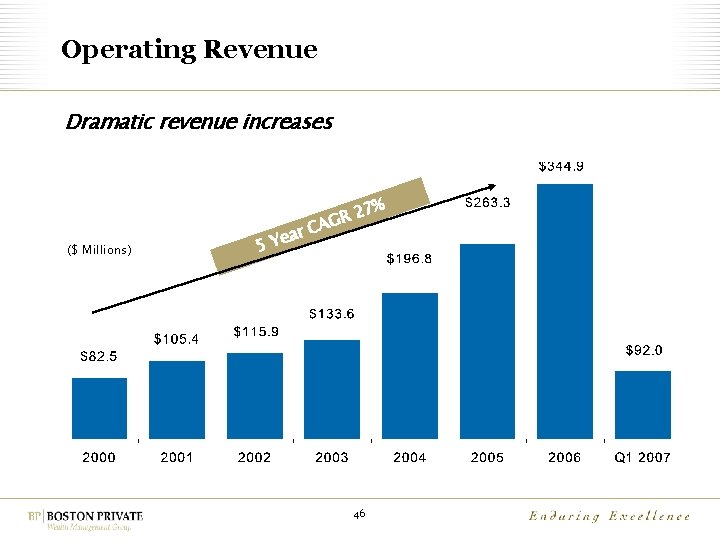
Operating Revenue Dramatic revenue increases 7% ($ Millions) R 2 G A ar C e 5 Y 46
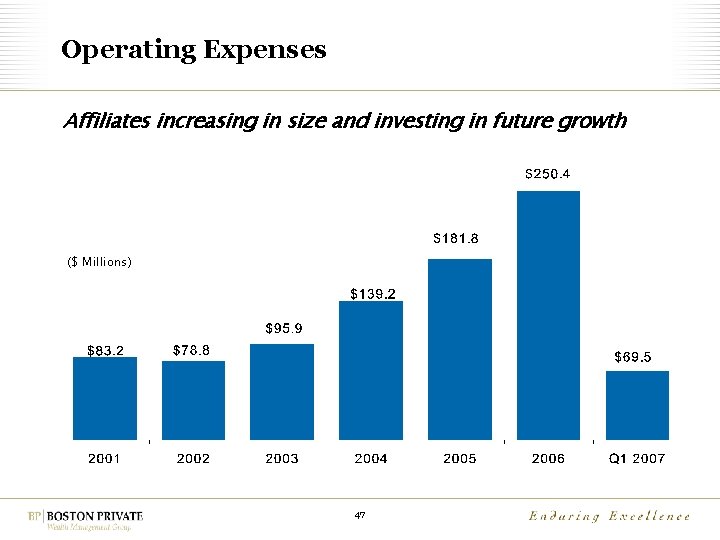
Operating Expenses Affiliates increasing in size and investing in future growth ($ Millions) 47
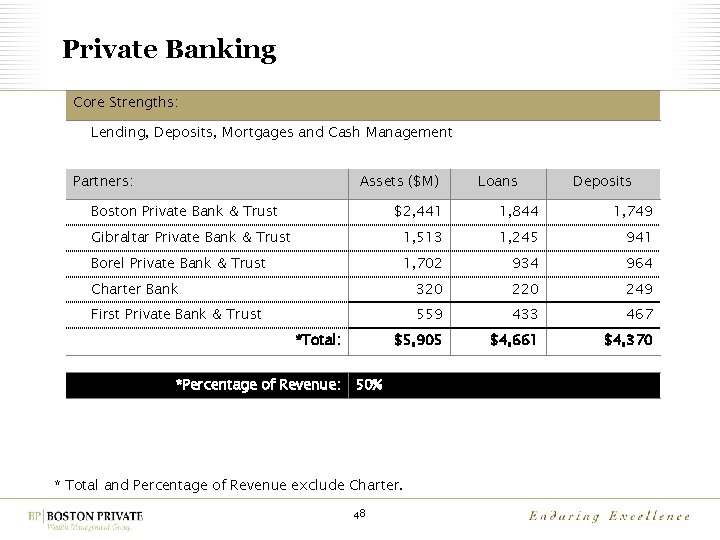
Private Banking Core Strengths: Lending, Deposits, Mortgages and Cash Management Partners: Assets ($M) Boston Private Bank & Trust Loans Deposits $2, 441 1, 844 1, 749 Gibraltar Private Bank & Trust 1, 513 1, 245 941 Borel Private Bank & Trust 1, 702 934 964 Charter Bank 320 249 First Private Bank & Trust 559 433 467 $5, 905 $4, 661 $4, 370 *Total: *Percentage of Revenue: 50% * Total and Percentage of Revenue exclude Charter. 48
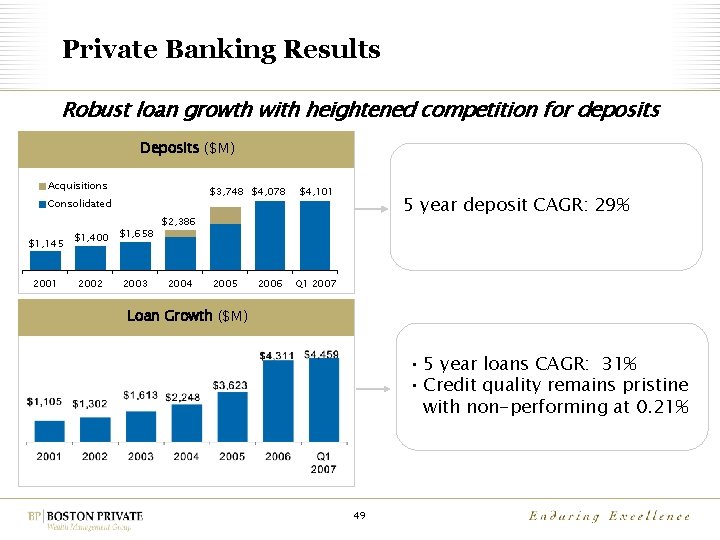
Private Banking Results Robust loan growth with heightened competition for deposits Deposits ($M) Acquisitions $3, 748 $4, 078 Consolidated $1, 145 2001 $1, 400 $1, 658 2002 2003 $4, 101 5 year deposit CAGR: 29% $2, 386 2004 2005 2006 Q 1 2007 Loan Growth ($M) • 5 year loans CAGR: 31% • Credit quality remains pristine with non-performing at 0. 21% 49
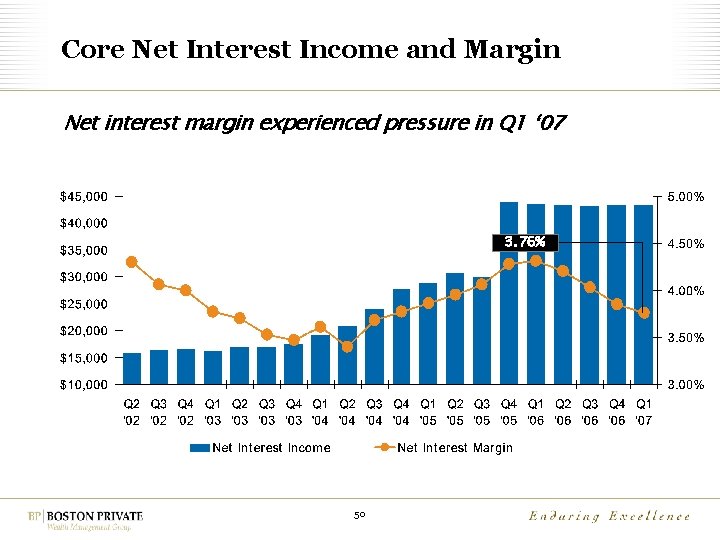
Core Net Interest Income and Margin Net interest margin experienced pressure in Q 1 ‘ 07 3. 76% 50
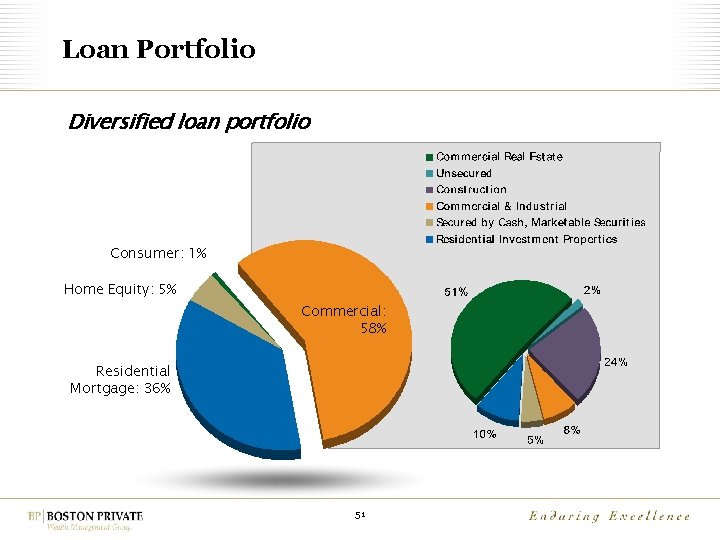
Loan Portfolio Diversified loan portfolio Consumer: 1% Home Equity: 5% Commercial: 58% Residential Mortgage: 36% 51
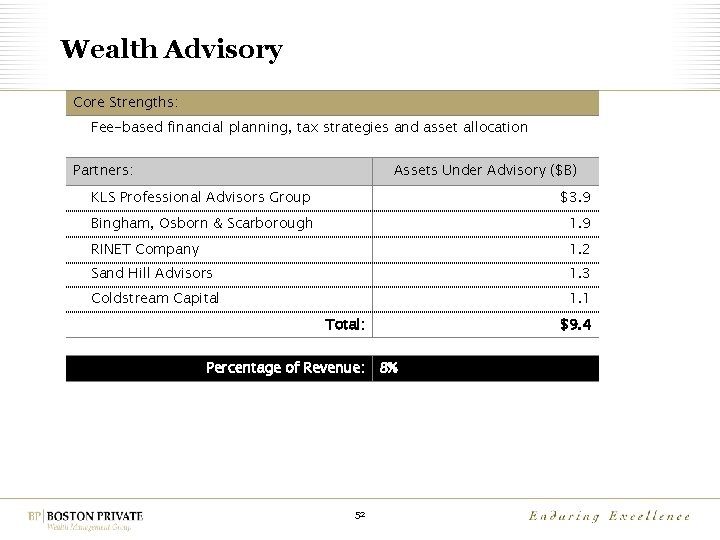
Wealth Advisory Core Strengths: Fee-based financial planning, tax strategies and asset allocation Partners: Assets Under Advisory ($B) KLS Professional Advisors Group $3. 9 Bingham, Osborn & Scarborough 1. 9 RINET Company 1. 2 Sand Hill Advisors 1. 3 Coldstream Capital 1. 1 Total: Percentage of Revenue: 52 $9. 4 8%
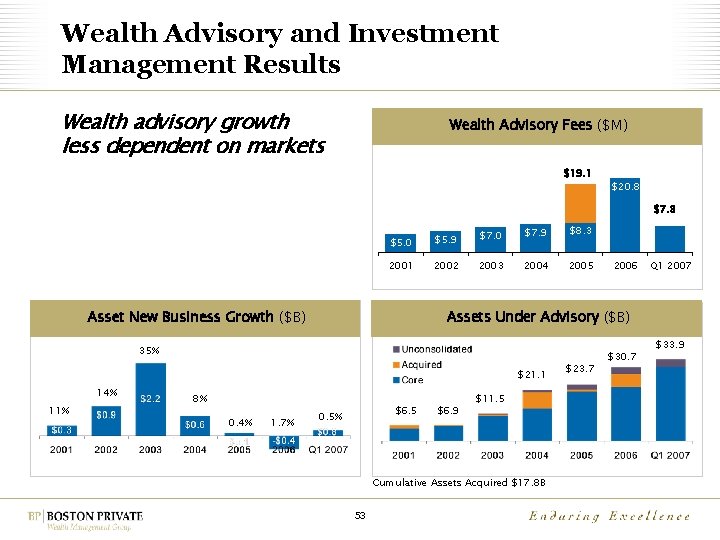
Wealth Advisory and Investment Management Results Wealth advisory growth less dependent on markets Wealth Advisory Fees ($M) $19. 1 $20. 8 $7. 3 $5. 0 $5. 9 $7. 0 $7. 9 $8. 3 2001 2002 2003 2004 2005 35% $21. 1 11% 8% 0. 4% 1. 7% Q 1 2007 Assets Under Advisory ($B) Asset New Business Growth ($B) 14% 2006 $6. 5 0. 5% $6. 9 $11. 5 Cumulative Assets Acquired $17. 8 B 53 $23. 7 $30. 7 $33. 9
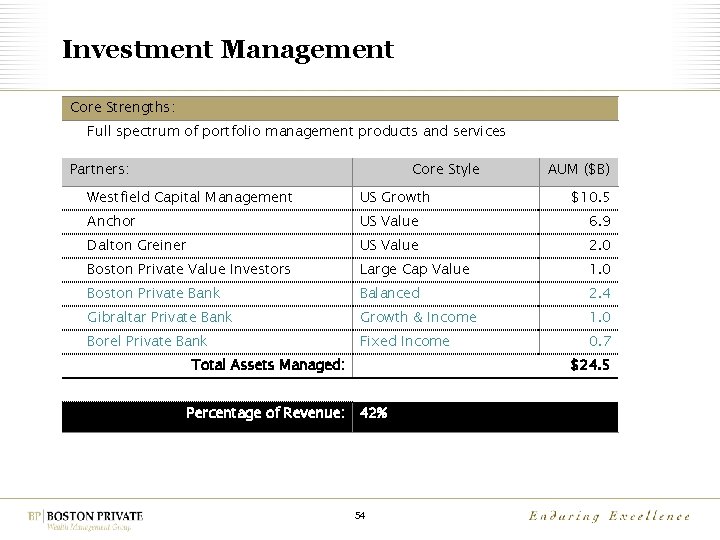
Investment Management Core Strengths: Full spectrum of portfolio management products and services Partners: Core Style AUM ($B) Westfield Capital Management US Growth Anchor US Value 6. 9 Dalton Greiner US Value 2. 0 Boston Private Value Investors Large Cap Value 1. 0 Boston Private Bank Balanced 2. 4 Gibraltar Private Bank Growth & Income 1. 0 Borel Private Bank Fixed Income 0. 7 Total Assets Managed: Percentage of Revenue: $10. 5 $24. 5 42% 54
- Slides: 54