Boosting and other Expert Fusion Strategies References http

Boosting and other Expert Fusion Strategies

References • • http: //www. boosting. org Chapter 9. 5 Duda Hart & Stock Leo Breiman Boosting Bagging Arcing Presentation adapted from: Rishi Sinha, Robin Dhamankar

Types of Multiple Experts • Single expert on full observation space • Single expert for sub regions of observation space (Trees) • Multiple experts on full observation space • Multiple experts on sub regions of observation space

Types of Multiple Experts Training • Use full observation space for each expert • Use different observation features for each expert • Use different observations for each expert • Combine the above
 • At time t: – Learner A")
Online Experts Selection • N strategies (experts) • At time t: – Learner A chooses a distribution over N experts – Let pt(i) be the probability of i-th expert – Spt(i) = 1 and for a loss vector lt Loss at time t: Spt(i) lt(i) • Assume bounded loss, lt(i) in [0, 1]

Experts Algorithm: Greedy • For each expert define its cumulative loss: • Greedy: At time t choose the expert with minimum loss, namely, arg min Lit

Greedy Analysis • Theorem: Let LGT be the loss of Greedy at time T, then • Proof in notes. • Weakness: Relies on a single expert for every observation

Better Multiple Experts Algorithms • Would like to bound • Better Bound: Hedge Algorithm Utilizes all experts for each observation

Multiple Experts Algorithm: Hedge • • Maintain weight vector at time t: wt Probabilities pt(k) = wt(k) / S wt(j) Initialization w 1(i) = 1/N Updates: § wt+1(k) = wt(k) Ub(lt(k)) § where b in [0, 1] and § br < Ub (r) < 1 -(1 -b)r
 •")
Hedge Analysis • Lemma: For any sequence of losses • Proof (Mansour’s scribe) • Corollary:

Hedge: Properties • Bounding the weights • Similarly for a subset of experts.

Hedge: Performance • Let k be with minimal loss • Therefore

Hedge: Optimizing b • For b=1/2 we have • Better selection of b:
-Occam algorithm –")
Occam Razor • Finding the shortest consistent hypothesis. • Definition: (a, b)-Occam algorithm – a >0 and b <1 – Input: a sample S of size m – Output: hypothesis h – for every (x, b) in S: h(x)=b – size(h) < sizea(ct) mb • Efficiency.
-Occam algorithm for C using H D")
Occam Razor Theorem • • A: (a, b)-Occam algorithm for C using H D distribution over inputs X ct in C the target function Sample size: • with probability 1 -d A(S)=h has error(h) < e

Occam Razor Theorem • Use the bound for finite hypothesis class. • Effective hypothesis class size 2 size(h) • size(h) < na mb • Sample size:

Weak and Strong Learning
 • There exists a distribution D over domain X")
PAC Learning model (Strong Learning) • There exists a distribution D over domain X • Examples: <x, c(x)> – use c for target function (rather than ct) • Goal: – With high probability (1 -d) – find h in H such that – error(h, c ) < e – e arbitrarily small, thus STRONG LEARNING
 < ½ - g (Slightly above chance)")
Weak Learning Model • Goal: error(h, c) < ½ - g (Slightly above chance) • The parameter is small – constant Intuitively: A much easier task • Question: – Assume C is weak learnable, – C is PAC (strong) learnable
= MAJ[ h 1(x), . . . , h.")
Majority Algorithm • Hypothesis: h. M(x)= MAJ[ h 1(x), . . . , h. T(x) ] • size(h. M) < T size(ht) • Using Occam Razor

Majority: outline • Sample m example • Start with a distribution 1/m per example. • Modify the distribution and get ht • Hypothesis is the majority • Terminate when perfect classification – of the sample

Majority: Algorithm • Use the Hedge algorithm. • The “experts” will be associate with points. • Loss would be a correct classification. – lt(i)= 1 - | ht(xi) – c(xi) | • Setting b= 1 - g • h. M(x) = MAJORITY( hi(x)) • Q: How do we set T?
 c(xi)")
Majority: Analysis • Consider the set of errors S S={i | h. M(xi) c(xi) } • For every i in S: Li / T < ½ (Proof!) • From Hedge properties:

MAJORITY: Correctness • Error Probability: • Number of Rounds: • Terminate when error less than 1/m

Bagging • Generate a random sample from training set by selecting elements with replacement. • Repeat this sampling procedure, getting a sequence of k “independent” training sets • A corresponding sequence of classifiers C 1, C 2, …, Ck is constructed for each of these training sets, by using the same classification algorithm • To classify an unknown sample X, let each classifier predict. • The Bagged Classifier C* then combines the predictions of the individual classifiers to generate the final outcome. (sometimes combination is simple voting) Taken from Lecture slides for Data Mining Concepts and Techniques by Jiawei Han and M Kamber

Boosting • Also Ensemble Method. =>The final prediction is a combination of the prediction of several predictors. • What is different? – Its iterative. – Boosting: Successive classifiers depends upon its predecessors. Previous methods : Individual classifiers were “independent” – Training Examples may have unequal weights. – Look at errors from previous classifier step to decide how to focus on next iteration over data – Set weights to focus more on ‘hard’ examples. (the ones on which we committed mistakes in the previous iterations)
 is the distribution of weights over N training observations ∑ W(xi)=1")
Boosting • W(x) is the distribution of weights over N training observations ∑ W(xi)=1 • Initially assign uniform weights W 0(x) = 1/N for all x, step k=0 • At each iteration k : – Find best weak classifier Ck(x) using weights Wk(x) – With error rate εk and based on a loss function: • weight αk the classifier Ck‘s weight in the final hypothesis • For each xi , update weights based on εk to get Wk+1(xi ) • CFINAL(x) =sign [ ∑ αi Ci (x) ]
")
Boosting (Algorithm)
 can be expressed")
Boosting As Additive Model • The final prediction in boosting f(x) can be expressed as an additive expansion of individual classifiers • The process is iterative and can be expressed as follows. • Typically we would try to minimize a loss function on the training examples

Boosting As Additive Model • Simple case: Squared-error loss • Forward stage-wise modeling amounts to just fitting the residuals from previous iteration. • Squared-error loss not robust for classification
) = exp(-y")
Boosting As Additive Model • Ada. Boost for Classification: L(y, f (x)) = exp(-y ∙ f (x)) - the exponential loss function

Boosting As Additive Model First assume that β is constant, and minimize w. r. t. G:

Boosting As Additive Model errm : It is the training error on the weighted samples The last equation tells us that in each iteration we must find a classifier that minimizes the training error on the weighted samples.

Boosting As Additive Model Now that we have found G, we minimize w. r. t. β:
 • W(x) is the distribution of weights over the N training observations")
Boosting (Recall) • W(x) is the distribution of weights over the N training observations ∑ W(xi)=1 • Initially assign uniform weights W 0(x) = 1/N for all x, step k=0 • At each iteration k : – Find best weak classifier Ck(x) using weights Wk(x) – With error rate εk and based on a loss function: • weight αk the classifier Ck‘s weight in the final hypothesis • For each xi , update weights based on εk to get Wk+1(xi ) • CFINAL(x) =sign [ ∑ αi Ci (x) ]
 is the distribution of weights over the N training points")
Ada. Boost • W(x) is the distribution of weights over the N training points ∑ W(xi)=1 • Initially assign uniform weights W 0(x) = 1/N for all x. • At each iteration k : – Find best weak classifier Ck(x) using weights Wk(x) – Compute εk the error rate as εk= [ ∑ W(xi ) ∙ I(yi ≠ Ck(xi )) ] / [ ∑ W(xi )] – weight αk the classifier Ck‘s weight in the final hypothesis Set αk = log ((1 – εk )/εk ) – For each xi , Wk+1(xi ) = Wk(xi ) ∙ exp[αk ∙ I(yi ≠ Ck(xi ))] • CFINAL(x) =sign [ ∑ αi Ci (x) ]
 Original Training set : Equal Weights to all training samples Taken from")
Ada. Boost(Example) Original Training set : Equal Weights to all training samples Taken from “A Tutorial on Boosting” by Yoav Freund and Rob Schapire
 ROUND 1")
Ada. Boost (Example) ROUND 1
 ROUND 2")
Ada. Boost (Example) ROUND 2
 ROUND 3")
Ada. Boost (Example) ROUND 3
")
Ada. Boost (Example)
 • Why exponential loss function? – Computational • Simple modular re-weighting")
Ada. Boost (Characteristics) • Why exponential loss function? – Computational • Simple modular re-weighting • Derivative easy so determining optimal parameters is relatively easy – Statistical • In a two label case it determines one half the log odds of P(Y=1|x) => We can use the sign as the classification rule • Accuracy depends upon number of iterations ( How sensitive. . we will see soon).

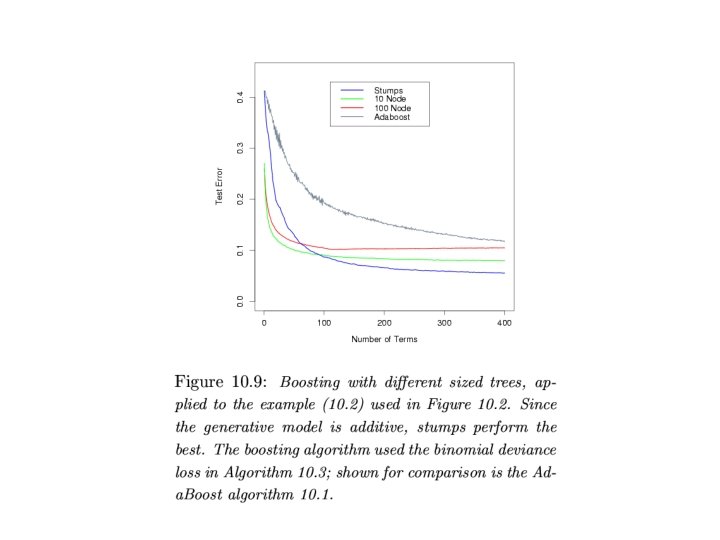
Boosting performance Decision stumps are very simple rules of thumb that test condition on a single attribute. Decision stumps formed the individual classifiers whose predictions were combined to generate the final prediction. The misclassification rate of the Boosting algorithm was plotted against the number of iterations performed.

Boosting performance Steep decrease in error

Boosting performance • Pondering over how many iterations would be sufficient…. • Observations – First few ( about 50) iterations increase the accuracy substantially. . Seen by the steep decrease in misclassification rate. – As iterations increase training error decreases ? and generalization error decreases ?

Can Boosting do well if? • Limited training data? – Probably not. . • Many missing values ? • Noise in the data ? • Individual classifiers not very accurate ? – It cud if the individual classifiers have considerable mutual disagreement.

Adaboost • “Probably one of the three most influential ideas in machine learning in the last decade, along with Kernel methods and Variational approximations. ” • Original idea came from Valiant • Motivation: We want to improve the performance of a weak learning algorithm

• Algorithm: Adaboost

Boosting Trees Outline • Basics of boosting trees. • A numerical optimization problem • Control the model complexity, generalization – Size of trees – Number of Iterations – Regularization • Interpret the final model – Single variable – Correlation of variables

Boosting Trees : Basics • Formally a tree is • The parameters found by minimizing the empirical risk. • Finding: – j given R j : typically mean of yi in Rj – Rj : Is tough but solutions exist.

Basics Continued … • Approximate criterion for optimizing • Boosted tree model is sum of such trees induced in a forward stage wise manner • In case of binary classification and exponential loss functions this reduces to Ada Boost

Numerical Optimization • Loss Function is • So the problem boils down to finding • Which in optimization procedures are solved as

Numerical Optimization Methods • Steepest Descent • Loss on Training Data converges to 0.

Generalization • Gradient Boosting – We want the algorithm to generalize. – Gradient on the other hand is defined only on the training data points. – So fit the tree T to the negative gradient values by least squares. • MART – Multiple additive regression trees

Algorithm

Tuning the Parameters • The parameters that can be tuned are – The size of constituent trees J. – The number of boosting iterations M. – Shrinkage – Penalized Regression

Right-sized trees • The optimal for one step might not be the optimal for the algorithm – Using very large tree (such as C 4. 5) as weak learner to fit the residue assumes each tree is the last one in the expansion. Usually degrade performance and increase computation • Solution : restrict the value of J to be the same for all trees.

Right sized trees. • For trees the higher order interactions effects present in large trees suffer inaccuracies. • J is the factor that helps control the higher order interactions. Thus we would like to keep J low. • In practice the value of 4 J 8 is seen to have worked the best.
 • After each iteration the training risk L(f. M). • As")
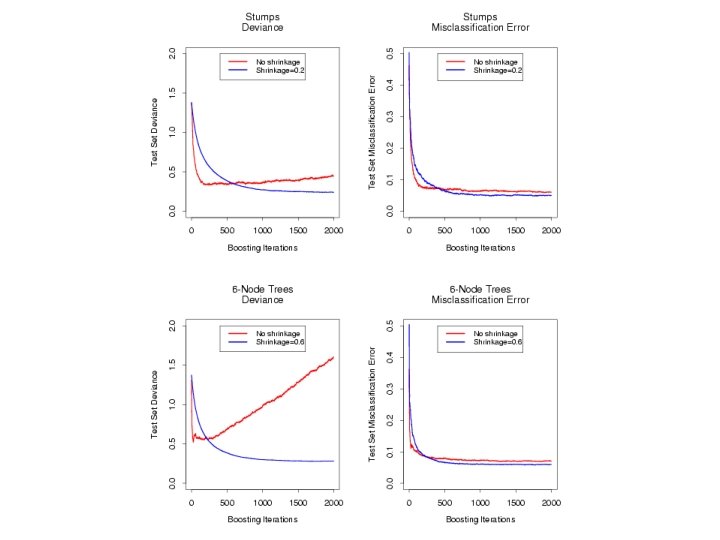
Controlling M (Regularization) • After each iteration the training risk L(f. M). • As M , L(f. M) 0 • But this would risk over fitting the training data. • To avoid this monitor prediction risk on a validation sample. • Other methods in the Next Chapter.

Shrinkage • Scale the contribution of each tree by a factor 0 < < 1 to control the learning rate. • and M control the prediction risk on training data. • Are not independent of each other.


Experts: Motivation • Given a set of experts – No prior information – No consistent behavior – Goal: Predict as the best expert • Model – online model – Input: historical results.

Expert: Goal • Match the loss of best expert. • Loss: – LA – Li • Can we hope to do better?

Example: Guessing letters • Setting: – Alphabet S of k letters • Loss: – 1 incorrect guess – 0 correct guess • Experts: – Each expert guesses a certain letter always. • Game: guess the most popular letter online.

Example 2: Rock-Paper. Scissors • Two player game. • Each player chooses: Rock, Paper, or Scissors. • Loss Matrix: Rock Paper Scissor s Rock 1/2 1 0 Paper 0 1/2 1 Scissor 0 the opponent. 1/2 • Goal: Play as best as we 1 can given s

Example 3: Placing a point • • Action: choosing a point d. Loss (give the true location y): ||d-y||. Experts: One for each point. Important: Loss is Convex • Goal: Find a “center”

Adaboost • Line 1: Given input space X and training examples x 1, …xm and label space Y = {-1, 1} • Line 2: Initialize a distribution D to 1/m where m is the number of instances in the input space. • Line 3: for( int t=0; t<T; t++) • Line 4: Train weak learning algorithm using Dt • Line 5: Get a weak hypothesis ht which maps the input space to the label space. The error of this hypothesis is εt • Line 6: αt = (1/2)ln((1 - εt)/ εt) • Line 7: Dt(instancei)=(1/ Zt)(Dt(instancei)x{e- αt }if the hypothesis correctly matched the instance to the label • x{eαt } otherwise
 = sign(sum(αt ht (x))) • Main ideas: – Adaboost")
Adaboost • Final hypothesis: H(x) = sign(sum(αt ht (x))) • Main ideas: – Adaboost forces the weak learner to focus on incorrectly classified instances – Training error decreases exponentially – Does boosting overfit? • Baum showed Generalization error = O(sqrt(Td/m)) • Schapire showed error = O(sqrt(d/mθ)) • Does Generalization error depend on T or not? The jury is still out. – No overfit mechanism

Ada. Boost: Dynamic Boosting • Better bounds on the error • No need to “know” • Each round a different b – as a function of the error
 > • A")
Ada. Boost: Input • Sample of size m: < xi, c(xi) > • A distribution D over examples – We will use D(xi)=1/m • Weak learning algorithm • A constant T (number of iterations)
 = D(xi) • For t = 1")
Ada. Boost: Algorithm • Initialization: w 1(i) = D(xi) • For t = 1 to T DO – – – pt(i) = wt(i) / Swt(j) Call Weak Learner with pt Receive ht Compute the error et of ht on pt Set bt= et/(1 -et) wt+1(i) = wt(i) (bt)e, where e=1 -|ht(xi)-c(xi)| • Output

Ada. Boost: Analysis • Theorem: – Given e 1, . . . , e. T – the error e of h. A is bounded by
 = 1 -|ht(xi)-c(xi)| • By definition: pt lt")
Ada. Boost: Proof • Let lt(i) = 1 -|ht(xi)-c(xi)| • By definition: pt lt = 1 –et • Upper bounding the sum of weights – From the Hedge Analysis. • Error occurs only if
 • • Bounding the weight of a point Bounding")
Ada. Boost Analysis (cont. ) • • Bounding the weight of a point Bounding the sum of weights Final bound as function of bt Optimizing bt: – bt= et / (1 – et)

Ada. Boost: Fixed bias • Assume et= 1/2 - g • We bound:

Learning OR with few attributes • Target function: OR of k literals • Goal: learn in time: – polynomial in k and log n – e and d constant • ELIM makes “slow” progress – disqualifies one literal per round – May remain with O(n) literals

Set Cover - Definition • • Input: S 1 , … , St and Si U Output: Si 1, … , Sik and j Sjk=U Question: Are there k sets that cover U? NP-complete

Set Cover Greedy algorithm • j=0 ; Uj=U; C= • While Uj – Let Si be arg max |Si Uj| – Add Si to C – Let Uj+1 = Uj – Si – j = j+1

Set Cover: Greedy Analysis • • At termination, C is a cover. Assume there is a cover C’ of size k. C’ is a cover for every Uj Some S in C’ covers Uj/k elements of Uj Analysis of Uj: |Uj+1| |Uj| - |Uj|/k Solving the recursion. Number of sets j < k ln |U|

Building an Occam algorithm • Given a sample S of size m – Run ELIM on S – Let LIT be the set of literals – There exists k literals in LIT that classify correctly all S • Negative examples: – any subset of LIT classifies theme correctly

Building an Occam algorithm • Positive examples: – – – Search for a small subset of LIT Which classifies S+ correctly For a literal z build Tz={x | z satisfies x} There are k sets that cover S+ Find k ln m sets that cover S+ • Output h = the OR of the k ln m literals • Size (h) < k ln m log 2 n • Sample size m =O( k log n log (k log n))

Application : Data mining • Challenges in real world data mining problems – Data has large number of observations and large number of variables on each observation. – Inputs are a mixture of various different kinds of variables – Missing values, outliers and variables with skewed distribution. – Results to be obtained fast and they should be interpretable. • So off-shelf techniques are difficult to come up with. • Boosting Decision Trees ( Ada. Boost or MART) come close to an off-shelf technique for Data Mining.

Boosting Trees Presented by Rishi Sinha

Occam Razor
 A B x 1, … , xm")
Occam algorithm and compression S (xi, bi) A B x 1, … , xm

compression • Option 1: – A sends B the values b 1 , … , bm – m bits of information • Option 2: – A sends B the hypothesis h – Occam: large enough m has size(h) < m • Option 3 (MDL): – A sends B a hypothesis h and “corrections” – complexity: size(h) + size(errors)
 • This is the first ICA paper – My source")
Independent Component Analysis (ICA) • This is the first ICA paper – My source for this explanation of ICA is “Independent Component Analysis: A Tutorial” by Aapo Hyvarinen and “Variational Methods for Bayesian Independent Component Analysis” ICA chapter by Rizwan A. Choudrey
- Slides: 89