Bone Densitometry Interpretation of DEXA Osteoporosis is the

Bone Densitometry Interpretation of DEXA

Osteoporosis is the most common metabolic bone disorder. It has been defined by the National Institutes of Health as an age-related disorder characterized by decreased bone mass and increased susceptibility to fractures in the absence of other recognizable causes of bone loss.

Osteoporosis Type 1. involutional osteoporosis affects mainly trabecular bone, occurs in women during the 15 -20 years after the menopause, and is related to a lack of estrogen. This is thought to account for wrist and vertebral crush fractures, which occur through areas of principally trabecular bone. Type 2. senile involutional osteoporosis. The fractures of old age seen at the hip, proximal humerus, pelvis and asymptomatic vertebral wedge fractures. This affects both trabecular and cortical bone and represents progressive loss of bone mass from the peak around the age of 18 -35 years. Secondary osteoporosis is due to an underlying medical condition, such as renal disease, malabsorption, or hormonal imbalance, or to medical treatment such as steroids or certain anticonvulsants

Osteoporosis Risk factors may be superimposed upon either involutional or secondary osteoporosis, including smoking, alcohol, poor diet, lack of exercise, an early menopause, strong family history and small frame.

Osteoporosis The normal rate of bone loss is 2% per year, hence 20 -40% of the female bone mass is already lost by the age of 65 years of age, beginning before the menopause and accelerating afterwards

Osteoporosis Bone mass is the major determinant of bone strength that can be measured by non-invasive techniques, and accounts for 75 -85% of this parameter

Osteoporosis Bone densitometry is clinically indicated for the detection and assessment of osteoporosis and for the evaluation and monitoring of several diseases and therapies. These include: 1. 2. 3. 4. The detection of osteoporosis and assessment of its severity. Evaluation of perimenopausal women for the initiation of estrogen therapy. Evaluation of patients with metabolic diseases that affect the skeleton. Monitoring of treatment and evaluation of disease course. In addition it may be useful as an epidemiological tool and possibly in the future for screening American Society of Bone and Mineral Research

Osteoporosis Measurement • • Plain film, Subjective, Radiogrammetry, Osteogram SPA DEXA QCT US MRI

DEXA Because photons of different energy are differentially attenuated by bone and soft-tissues, by measuring the percentage of each transmitted beam and then applying simple simultaneous equations, the absorption by bone alone and hence bone density can be calculated. This measurement is not a true density but rather an areal density, represented in gms/cm 2

DEXA y x
")
DEXA has very high accuracy (the difference in the measurement from a known standard) and precision (observed deviation of serial measurements with time), both short and long term, to within 1% at the hip and spine

DEXA DXA is at present the most precise measurement of BMD QCT is more sensitive to change

DEXA Interpretation

Find out as much relevant information as possible

Find out as much relevant information as possible

Bone Densitometry DEXA spine check list • Note the age, sex, ethnicity and weight • Does this match the reference ranges? • Is the bottom of L 4 roughly at the level of the iliac crests • Are there any ribs on L 1 • Scoliosis • Are the vertebrae correctly divided • Anything in the soft tissue

Vertebroplasty

Calcium Tablets

Wrong levels Transitional vertebrae

Bone Densitometry DEXA spine check list • Look for significant level to level variations • 15 -20% difference between adjacent levels

DEXA, what makes a good scan? • 5 -15 Lines of Iliac Crest. I recommend 1/2 of L 5. • 5 -10 Lines of T 12. • 2 cm of tissue on both sides of the spine. • Spine should be straight. • No metal in spine.

Common problems with spine scans. • • • Spine isn’t straight. Scan starts in sacrum. Scan stops too soon. Wrong scan mode. Scan doesn’t include L 5.

What is a scan mode? • This determines the speed the arm travels, and how much radiation the patient receives. • The bigger the patient, the more radiation you’ll require. • The smaller the patient, the less radiation you’ll require.

IQ Scan Modes

IQ Patient Thickness • 12 -15 cm is Medium 750 • 15 -22 cm is Fast 3000 • 22 -30 cm is Medium 3000 • Most patients fall in the Fast 3000 range.

Bone Densitometry • In preventing Fxs it is the worst scenario that matters. • Generally a slight increase in density as descend the L spine. Approx 6% increase between L 1 and L 4.

Typical Spine scan

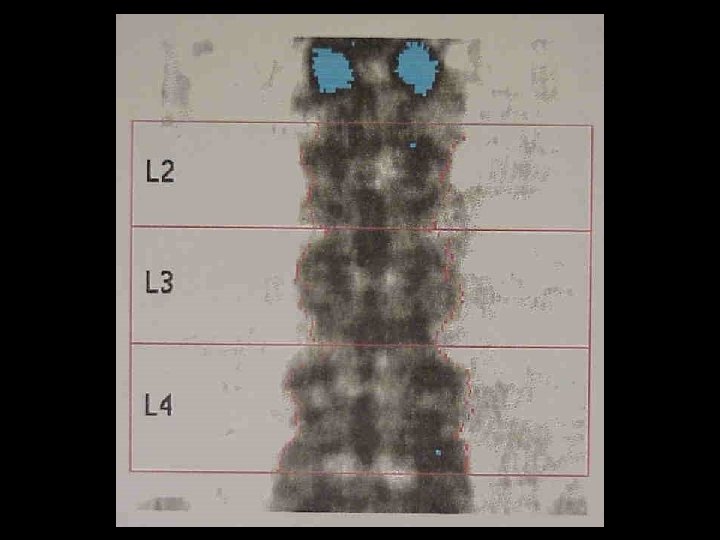
What’s wrong with this scan?

What’s wrong with this scan? L 1 is really T 12

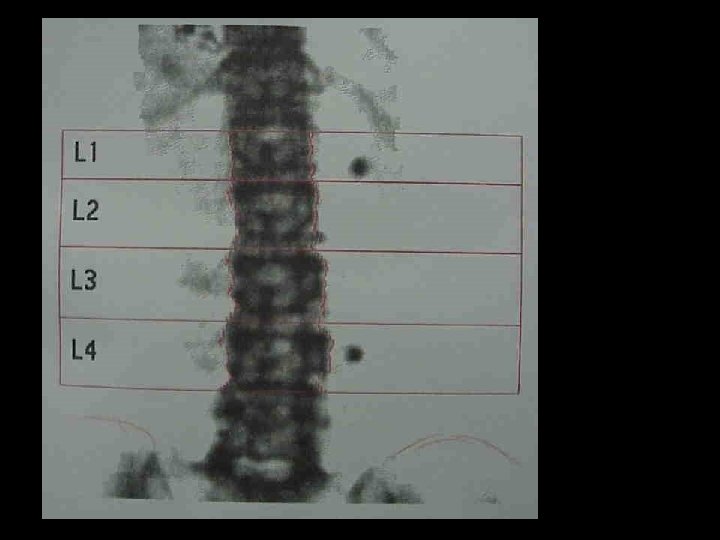
What’s wrong with this scan?

What’s wrong with this scan? Divisions don’t account for scoliosis

What’s wrong with this scan? Everything

DEXA Femur check list Hints for a good scan. • • Patient should be straight on table. Pack patient with rice bags. Shaft of femur should be straight. Rotate leg inward, this will hide the lesser Trochanter.

DEXA Femur check list Hints for a good scan. • The Wards area is roughly half the neck area • Trochanteric area 8 -14 cm 2 in women, 1016 cm 2 in men • Check left and right and state side being used in report.

non. IQ DPX scanning • Show 15 -30 scan lines prior to seeing ischium. • There should be little or no lesser Trochanter. • Straight shaft. • 25 lines or more above the Greater Trochanter.

Typical Femur Scan

What’s wrong with this scan?

What’s wrong with this scan? Too much shaft

What’s wrong with this scan?

What’s wrong with this scan? Insufficient tissue below neck

What’s wrong with this scan? Set up for wrong leg

What’s wrong with this scan?

Bone Densitometry WHO uses T scores • Normal • > -1 SD below young adult • Osteopenia • -1 -2. 5 SD • Osteoporosis • <-2. 5 SD • Established Osteoporosis • + Fxs, usually spine, hip, proximal humerus, wrist, rib

Template

Bone Densitometry • Never round up figures – -1 is osteopenia, -0. 99 is normal – -2. 5 is osteoporosis, -2. 49 is osteopenia

Bone mass in healthy children Increases with age, weight and pubertal Tanner stage and weight are best predictors of bone mass. Age, sex, race, activity and diet are not good predictors, when weight and Tanner stage are controlled. Radiology 1991; 179: 735 -738

Bone mass in healthy children Make sure we have at least the age and weight of the child, if not the Tanner stage. Radiology 1991; 179: 735 -738

BMD in children and adolescents

BMD in children and adolescents Girls

BMD in children and adolescents Males

Bone Densitometry • T score is compared to reference population, 20 -45 years, same sex, any race, any weight. • Z score is matched for age, sex, weight and ethnicity.

Two possible reasons for this lady’s Z score being worse than the T score?

Two possible reasons for this lady’s Z score being worse than the T score? Obesity and race

The T score is based on a white, same sex, age 20 -40 population. The patient's BMD is compared to this population's BMD. A lower T score means that the patient BMD is low compared to this young, healthy normal weight population. The Z score compares the patient to an adjusted population, it adjusts for age, weight, and ethnic background. The Z score can be lower for the patient, if the average patient in this population has a higher BMD than the average in the T score population. This can be seen in patients with higher weights, (which increases bone density), and in African American groups, (which show increased bone density). If the patients comparison group has a generally higher bone density, then it is possible to have a poorer comparison to others of same age, than to younger comparisons in generally lower density group.

260 lb man, young Z above young T

Black as White

Black as White T same Z up
 will not affect")
Bone Densitometry Weight gain/loss and Z • Weight gain (or loss) will not affect Z score comparison, since Z scores are weight matched. but should cause an increase (or decrease) in absolute BMD. • An increase in weight, pushes up the reference range, and therefore the Z score may seem reduced, and vice versa. 2. 2 lbs=1 Kg
 should cause an")
Bone Densitometry Weight gain/loss and T • Weight gain (or loss) should cause an increase (or decrease) in absolute BMD. • Weight gain (or loss) will affect T score comparison, since reference range will not have changed. • Hence an increase in weight with a corresponding increase in bone density, will look like a good improvement in T score, but fracture risk is unchanged.

51 F 90 Kg 53 F 51 Kg

1. 176 1. 172 SD = 0. 1 both between -2 and -3 1 Y, 16 lb gain, 5% BMD loss = significant increase in fracture risk

Bone Densitometry Comparison with previous • Are the studies comparable • Always compare like with like – Thornton L 1 -4 – 4 th and Lewis L 2 -4 • Any intervening events • Cannot compare Hologic and Lunar

Bone Densitometry Comparison with previous • David Sartoris’s previous studies that do not mention the region or levels measured, were standardized for L 1 -4 and the femoral neck. • He usually did not quote BMD. • Many previous studies were prior to the current database. • Use the percent young adult as a guide to percentage change.

Bone Densitometry Comparison with previous • If over a period of time there is an increase in BMD in the lower lumbar spine and decrease in the upper lumbar spine, it is likely there is OA of the lower facet joints, and the upper lumbar spine is a truer reflection of useful BMD.

Bone Densitometry Comparison with previous • Increase in BMD of the femoral neck can be due to calcar buttressing with OA of the hip.

Bone Densitometry Comparison with previous • If you want to eyeball the % for a comparison, use the young adult since the reference range will not change with age. • A static bone density is actually a good result over a significant period of time • If a test is 1% precise, then a change has to be greater than 2% to be significant

Bone Densitometry Comparison with previous • If you would have expected the bone density to have fallen 4% in 2 years, and it is static, then this is a positive response to RX

Bone Densitometry Comparison with previous • Generally Rx affects all levels equally. OA does not.

Cases

63 F

63 F

63 F

63 F

63 F

63

63 F

63 F

Report Because of the previous laminectomy at L 4, which may also be affecting the reading on the inferior aspect of L 3, the BMD is averaged at L 1 -2. Note is also made of mild decrease in the L 4 vertebral height.

35 F White 242 lbs 62 in

35 F White 242 lbs 62 in

35 F White 242 lbs 62 in

Report Because of the patients weight, the T score may not fully represent the fracture risk, and note should be made that the Z score is x. SD below age and weight matched.

39 M. 1551

39 M OGI. 1551

46 F Calcified bile

46 F Calcified bile

46 F Calcified bile

47 F Black

49 F 2 Y 8 M gap Lx spine up, Fem neck down

49 F

T 49 F Sacral agenesis

50 F

50 F dense R femoral neck

50 F dense R femoral neck

2 d earlier 51 F 2 d later

2 d earlier 51 F 2 d later

51 F Barium in diverticulum from recent enema

53 F 51 Kg 47 F 59 Kg

53 F 51 Kg 6 yr later, 8 Kg wt loss 47 F 59 Kg

47 F 59 Kg 53 F 51 Kg

60 F

60 F

60 F OA

54 M ESLD s/p trans Rec. repeat

76 F response to Rx 15 m earlier 15 m later

85 M Bil THR

85 M Bil THR
- Slides: 109